
A Characterization of Voting Power for Discrete Weight Distributions
Proceedings of the Twenty-Fifth International Joint Conference on Artificial Intelligence. Pages 74-79.
Abstract
Weighted voting games model decision-making bodies where decisions are made by a majority vote. In such games, each agent has a weight, and a coalition of agents wins the game if the sum of the weights of its members exceeds a certain quota. The Shapley value is used as an index for the true power held by the agents in such games. Earlier work has studied the implications of setting the value of the quota on the agents' power under the assumption that the game is given with a fixed set of agent weights. We focus on a model where the agent weights originate from a stochastic process, resulting in weight uncertainty. We analyze the expected effect of the quota on voting power given the weight generating process. We examine two extreme cases of the balls and bins model: uniform and exponentially decaying probabilities. We show that the choice of a quota may have a large influence on the power disparity of the agents, even when the governing distribution is likely to result in highly similar weights for the agents. We characterize various interesting repetitive fluctuation patterns in agents' power as a function of the quota.
- [Aziz and Paterson, 2008] H. Aziz and M. Paterson. Com- puting voting power in easy weighted voting games. CoRR, abs/0811.2497, 2008.
- [Bachrach et al., 2010] Y. Bachrach, E. Markakis, E. Resnick, A.D. Procaccia, J.S. Rosenschein, and A. Saberi. Approximating power indices: theoretical and empirical analysis. AAMAS'10, pages 105-122, 2010.
- [Berry, 1941] A. C. Berry. The accuracy of the gaussian ap- proximation to the sum of independent variates. Transac- tions of the American Mathematical Society, 49(1):122- 136, 1941.
- [Calvert, 1985] R.L. Calvert. Robustness of the multidimen- sional voting model: Candidate motivations, uncertainty, and convergence. American Journal of Political Science, pages 69-95, 1985.
- [Caragiannis et al., 2013] I. Caragiannis, A.D. Procaccia, and N. Shah. When do noisy votes reveal the truth? In EC'13, pages 143-160, 2013.
- [Caragiannis et al., 2014] I. Caragiannis, A.D. Procaccia, and N. Shah. Modal ranking: a uniquely robust voting rule. In AAAI'14, pages 616-622, 2014.
- [Chalkiadakis and Wooldridge, 2016] G. Chalkiadakis and M.J. Wooldridge. Weighted voting games. In F. Brandt, V. Conitzer, U. Endriss, J. Lang, and A.D. Procaccia, ed- itors, Handbook of Computational Social Choice, chap- ter 16. Cambridge University Press, 2016.
- [Chalkiadakis et al., 2010] G. Chalkiadakis, E. Elkind, E. Markakis, M. Polukarov, and N.R. Jennings. Coop- erative games with overlapping coalitions. Journal of Artificial Intelligence Research, 39(1):179-216, 2010.
- [Chalkiadakis et al., 2011] G. Chalkiadakis, E. Elkind, and M.J. Wooldridge. Computational Aspects of Cooperative Game Theory. Morgan and Claypool, 2011.
- [Coughlin, 1992] P.J. Coughlin. Probabilistic voting theory. Cambridge University Press, 1992.
- [Enelow and Hinich, 1989] J.M. Enelow and M.J. Hinich. A general probabilistic spatial theory of elections. Public Choice, 61(2):101-113, 1989.
- [Fatima et al., 2008] S.S. Fatima, M. Wooldridge, and N.R. Jennings. A linear approximation method for the shapley value. Artificial Intelligence, 172(14):1673-1699, 2008.
- [Filmus et al., 2016] Y. Filmus, J. Oren, and K. Soundarara- jan. Shapley values in weighted voting games with random weights. Submitted, 2016.
- [Leech and Machover, 2003] D. Leech and M. Machover. Qualified majority voting: the effect of the quota. LSE Research Online, 2003.
- [Leech, 2002] D. Leech. Designing the voting system for the council of the european union. Public Choice, 113:437- 464, 2002.
- [Lindner, 2004] I. Lindner. Power measures in large weighted voting games. PhD thesis, Univ. of Hamburg, 2004.
- [Lu and Boutilier, 2011] T. Lu and C. Boutilier. Vote elici- tation with probabilistic preference models: Empirical es- timation and cost tradeoffs. In ADT'11, pages 135-149, 2011.
- [Markakis and Saberi, 2005] E. Markakis and A. Saberi. On the core of the multicommodity flow game. Decision sup- port systems, 39(1):3-10, 2005.
- [Mitzenmacher and Upfal, 2005] M. Mitzenmacher and E. Upfal. Probability and computing -randomized algo- rithms and probabilistic analysis. Cambridge University Press, 2005.
- [Mitzenmacher et al., 2000] M. Mitzenmacher, A. W. Richa, and R. Sitaraman. The power of two random choices: A survey of techniques and results. In Handbook of Random- ized Computing, pages 255-312. Kluwer, 2000.
- [Oren et al., 2013] Joel Oren, Yuval Filmus, and Craig Boutilier. Efficient vote elicitation under candidate uncer- tainty. In IJCAI'2013, pages 309-316, 2013. IJCAI
- [Oren et al., 2014] J. Oren, Y. Filmus, Y. Zick, and Y. Bachrach. On the effects of priors in weighted voting games. In COMSOC'14, 2014.
- [Peleg and Sudhölter, 2007] B. Peleg and P. Sudhölter. Intro- duction to the Theory of Cooperative Games, volume 34. Springer, 2007.
- [Penrose, 1946] L.S. Penrose. The elementary statistics of majority voting. Journal of the Royal Statistical Society, 109(1):53-57, 1946.
- [Raab and Steger, 1998] M. Raab and A. Steger. "balls into bins" -a simple and tight analysis. In RANDOM'98, pages 159-170, 1998.
- [Shapley, 1953] L.S. Shapley. A value for n-person games. In Contributions to the Theory of Games, vol. 2, Annals of Mathematics Studies, no. 28, pages 307-317. Princeton University Press, Princeton, N. J., 1953.
- [Słomczyński and Życzkowski, 2006] W. Słomczyński and K. Życzkowski. Penrose voting system and optimal quota. Acta Physica Polonica B, 37(11):3133-3143, 2006.
- [Tauman and Jelnov, 2012] Y. Tauman and A. Jelnov. Voting power and proportional representation of voters. Dept. of Econs. Working Papers 12-04, Stony Brook Univ., 2012.
- [Zick et al., 2011] Y. Zick, A. Skopalik, and E. Elkind. The shapley value as a function of the quota in weighted voting games. In IJCAI'11, pages 490-495, 2011. IJCAI
- [Zick, 2013] Y. Zick. On random quotas and proportional representation in weighted voting games. In IJCAI'13, pages 432-438, 2013. IJCAI
- [Zuckerman et al., 2012] M. Zuckerman, P. Faliszewski, Y. Bachrach, and E. Elkind. Manipulating the quota in weighted voting games. Artificial Intelligence, 180- 181:1-19, 2012.
References were extracted automatically from the PDF and may contain errors.
Full text extracted automatically from the PDF; figures, tables and equations may differ. The PDF is the version of record.
1 Introduction
Group decision making systems are prevalent in AI settings; expert systems and prediction markets have been commonly modeled using weighted voting games. The weighted voting game model, historically used by political scientists and economists to model political parties, has been the object of intense research by the AI/COMSOC community; in this setting, each agent (thought of as a political party) has a weight wi. A group of agents is said to be winning (i.e., can form a government, or pass a bill) if its total weight exceeds a given quota q.
One key observation is that the true decision power of an agent does not necessarily correspond to its weight. For example, consider a parliament that has three parties, two with 49 seats, and one with 2 seats. Assuming that a majority of the votes (i.e., 50 votes) is required in order to pass a bill, all
Yuval Filmus
Technion, Israel yuvalfi@cs.technion.ac.il
Yair Zick
Carnegie Mellon Univ., USA yairzick@cs.cmu.edu
three parties are equally critical to the legislative process: no single party can pass a bill on its own, whereas any two parties can. Thus, although one party has a far smaller weight than the other two, it holds the same electoral power. Various power indices have been proposed to measure the actual influence of an agent in such settings. One of the most prominent power indices is the Shapley power index (also referred to as the Shapley-Shubik power index). This index has played a central role in the analysis of real-life voting systems, such as the US electoral college, the EU council of members, and the UN security council. Empirical studies of weighted voting present an interesting phenomenon: changes to the quota of weights required to win the game can dramatically affect the agents' voting power. This phenomenon has been observed in real parliaments (e.g., the EU council of members) and in artificial WVGs [Leech and Machover, 2003; Zuckerman et al., 2012].
Prior work (see Section 1.2) studied the following question: for a given set of weights, how does voting power change as a function of the quota? In this scenario, a central authority wants to enforce a certain property on the agents' voting power. For example, the central authority may be interested in minimizing or maximizing a certain party's electoral power, ensuring that all agents have equal power, or that agents have power proportional to their weight. To achieve its goal, the central authority may control the quota prior to the formation of the electorate; for example, quota manipulation has been considered in order to ensure power/weight proportionality in the EU council of members.
Earlier work examining the impact of control over the quota has shown relatively weak upper bounds on the potential difference in power caused by changes to the quota. For example, Zuckerman et al. [2012] provide an upper bound of 1◁(n-i+1) on the additive difference in the Shapley value of the agent with the i-th smallest weight, as a result of changing the quota, as well as a simple criterion for the equivalence of the Shapley values under two different quota values. While some worst case analysis is shown to be tight, its conclusions seem unsatisfactory: these results merely tell us that for some weight vectors, power can vary widely, even when changes to the quota are small. Indeed, Zick et al. [2011] show that agent i may have minimal electoral power if the threshold is wi + 1, while its voting power is maximized when q = wi.
Even though worst case results do not seem promising, there exists virtually no work analyzing the average case; this is where our work comes in. We focus on the following question:
What is the likely effect of quota changes on the Shapley value, when weights are sampled from some known prior?
In contrast to the models underlying previous work, many real world settings exhibit uncertainty about the agent weights. As a motivating example, consider the case where one must decide on the number of votes required to pass a bill. If we assume that changes like these are not common (as is the case for the EU council of members), one must consider not only voting power in the current parliament, but in future ones. Since we have no data on the composition of a future parliament, the expected effects of our choice of quota must be assessed based on some probabilistic model of vote distribution, obtained from polling data or a stochastic model.
1.1 Our Contributions
Using natural weight generation processes, we analyze the expected behavior of the Shapley value as a function of the quota. Our results show that voting power can behave in a rather unusual manner; for example, we show that even when weights are likely to be very similar, some quota choices are likely to cause significant differences in voting power. The current body of work represents a significant advance in our understanding of weighted voting games; via careful probabilistic analysis, we strongly generalize previous known results, and inform the design of both real and randomly generated voting systems.
Our work focuses on the Balls and Bins model [Mitzenmacher et al., 2000; Mitzenmacher and Upfal, 2005; Raab and Steger, 1998]-a model that has received considerable attention in the computer science community. Briefly, m balls are independently thrown into n bins, where each ball lands in the i-th bin with probability pi.
In the voting context, this process takes on an intuitive meaning: each ball represents a single voter, who votes for party i with probability pi; thus, the weight of a party after m tosses corresponds to the number of votes it received.
In Section 3, we study a simple model, where each ball lands in one of the n bins uniformly at random. We identify a repetitive fluctuation pattern in the Shapley values, with cycles of length mn . We show that if the quota is sufficiently bounded away from the borders of its length- mn cycle, then the Shapley values of all agents are likely to be very close to each other. On the other hand, we show that due to noise effects, when the quota is situated close enough to small multiples of mn , the highest Shapley value can be roughly double than that of the smallest one.
In Section 4 we consider the case in which the probabilities decay exponentially, with a decay factor smaller than 1◁2. We show that analyzing this case essentially boils down to characterizing the Shapley values in a game where weights are a super-increasing sequence, which has already received attention (e.g., [Oren et al., 2014; Aziz and Paterson, 2008; Zuckerman et al., 2012]).
1.2 RelatedWork
Weighted voting games are a fundamental class of cooperative games, modeling several phenomena in AI domains (voting, threshold logics, task completion and others); moreover, their structure nicely lends itself to computational analysis and extensions (for more on WVGs in AI see [Chalkiadakis et al., 2011; Chalkiadakis and Wooldridge, 2016]). Measuring agent influence in WVGs is commonly done using the Shapley value [Shapley, 1953]; this is because the Shapley value has several appealing properties, and is, in fact, the only function that has these properties (see Peleg and Sudh¨olter [2007] for details).
Computing the Shapley value is known to be computationally intractable [Chalkiadakis et al., 2011], but easily approximable via random sampling [Bachrach et al., 2010; Fatima et al., 2008]. Approximation techniques exploit the inherent probabilistic nature of power indices, rather than assuming independent randomness in the weighted voting game itself, as we do here.
If one makes no assumptions on weight distributions then very little can be said about the effects of the quota on WVGs. Indeed, power measures are highly sensitive to varying quota values [Zick et al., 2011; Zick, 2013], though predicting the effect of quota variation is computationally hard [Zuckerman et al., 2012]. Our work takes a more principled approach to the matter.
The assumption of a prior on voter preferences is also a well-established practice. Many models of probabilistic voting have been discussed in the economic literature (see e.g., [Coughlin, 1992; Calvert, 1985; Enelow and Hinich, 1989]). More broadly, social choice theory has seen a recent surge in models that incorporate uncertainty on agent preferences (e.g., [Caragiannis et al., 2013; 2014; Lu and Boutilier, 2011; Oren et al., 2013]).
Several works have studied the effects of randomization on weighted voting games from a theoretical perspective [Tauman and Jelnov, 2012; Lindner, 2004; Penrose, 1946; Zick, 2013]. Finally, the effects of changes to the quota have also been studied empirically, mostly in the context of the EU council of members [Leech and Machover, 2003; Leech, 2002; Słomczy´nski and ˙Zyczkowski, 2006].
2 Preliminaries
General notation Given a vector x 2 Rn and a set S ✓ ¶1↪ ▷ ▷ ▷ ↪ n♦, let x(S) = Pi2S xi. For a random variable X, we let E[X] be its expectation, and Var[X] be its variance. For a set S, we denote by ⇥Sk ⇤ the collection of subsets of S of cardinality k. The notation T 2R ⇥Sk ⇤ means that the set T is chosen uniformly at random from ⇥Sk ⇤. We let B(n↪ p) denote the binomial distribution with n trials and success probability p.
We let Op(·) denote the usual big-O notation, conditioned on a fixed value of p. In other words, having f(n) = Op(g(n)) means that there exist functions K(·)↪N(·), such that for n ≥ N(p), f(n) K(p) · g(n).
Finally, for a distribution D over R and some event E, we simplify our notation by letting Pr[E(D)] = Prx⇠D[E(x)].
For example, for a > 0, we can write Pr[B(n↪ p) a] = Prx⇠B(n↪p)[x a].
Weighted voting games A weighted voting game (WVG) is given by a set of agents N = ¶1↪ ▷ ▷ ▷ ↪ n♦, where each agent i 2 N has a non-negative weight wi, and a quota q. Unless otherwise specified, we assume that the weights are arranged in non-decreasing order, w1 · · · wn.
A subset of agents S ✓ N is called winning (has value 1) if w(S) ≥ q and is called losing (has value 0) otherwise.
The Shapley value Let Symn be the set of all permutations of N. Given some permutation σ 2 Symn and an agent i 2 N, we let Pi(σ) = ¶j 2 N : σ(j) < σ(i)♦; Pi(σ) is called the set of i's predecessors in σ. We say that i is pivotal for a set S ✓ N if S is losing but S [ ¶i♦ is winning. Similarly, i is pivotal for a permutation σ if the set Pi(σ) is losing, but the set Pi(σ)[¶i♦ is winning. In other words, i is pivotal for a permutation σ if its predecessors have a total weight lower than q, but w(Pi(σ)) + wi ≥ q.
The Shapley-Shubik power index (often referred to as the Shapley value in the context of WVG's) is simply the probability that i is pivotal for a permutation σ 2 Symn selected uniformly at random. More explicitly,
Here, I(·) is the indicator function. Since σ-1 (i) is distributed uniformly when σ is chosen at random from Symn, we also have the alternative formula
When the WVG hw; qi is clear from the context, we will simply write 'i; however, we often wish to emphasize the role of the quota q, and refer to the Shapley value of i as 'i(q). Finally, it is easy to show that wi wj implies 'i 'j, and so if w1 · · · wn, then '1 · · · 'n. Another useful property that follows immediately from the definitions is that Pi2N 'i = 1, assuming 0 < q Pi2N wi.
The Balls and Bins Distribution In its general form, the Balls and Bins distribution is derived as follows: given a set of n bins and a distribution represented by a vector p 2 [0↪ 1]n such that Pni=1 pi = 1, the process unfolds in m steps. At each step, a ball is thrown into one of the bins based on the probability vector p. The resulting weights are then sorted in non-decreasing order w1 · · · wn.
3 The Balls and Bins Distribution: the Uniform Case
We begin our study of the balls and bins process by considering the most commonly studied version of the balls and bins model, in which each ball is thrown into one of the bins with equal probability, i.e., pi = 1◁n, for all i 2 N.
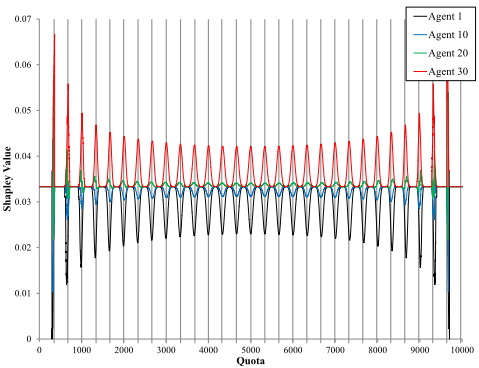
As Figure 1 shows for the case of n = 30, the behavior of the Shapley values demonstrates an almost perfect cyclic pattern, with intervals of length m◁n in Figure 1). As can be seen in the figure, for quota values that are sufficiently distant from the interval endpoints, all of the Shapley values tend to be equal (as the Shapley values of the highest and lowest agents are equal in these regions). As the number of balls grows, all of the bins tend to have nearly the same number of balls in them; however, low weight discrepancy does not immediately translate to low power discrepancy: we can guarantee nearly equal voting power for some quotas, but not for others. Example 3.1 provides some intuition to this behavior, though the formal proofs turn out to be much more involved.
Example 3.1. Let us assume m = 300 and n = 3; under a uniform balls and bins distribution, we are very likely to obtain three weights w1 = W - ↵↪ w2 = W↪ w3 = W + β, where W ' 100, and with very small ↵ and β. If we choose a quota well away from multiples of mn = 100, say q = 150, then it is extremely likely that all agents are equally influential (any two parties form a winning coalition). However, when we choose a quota that is close to multiples of 100 (say q = 100), it is likely to place a lot of power in the hands of the largest party: it can always form a winning coalition on its own.
From a legislative perspective, our theorems provide some interesting guarantees on voting power, under the assumption that voter behavior follows a uniform Balls and Bins distribution. If one wishes to ensure that all parties have similar voting power, it suffices to set a quota that is sufficiently far from mn (and is close enough to 50%); if one wishes to ensure power disparity, setting a quota closer to mn is desirable.
We begin by providing a formula for the differences between two Shapley values.
Lemma 3.2. For all agents i↪ j 2 N, suppose that wi wj;
then
We now give a theoretical justification for the near-identity of Shapley values for quotas that are well away from integer multiples of mn . In this section, we do not assume that the weights w1↪ ▷ ▷ ▷ ↪ wn are ordered, in order to maintain the fact that the weights are random variables.
The idea of the proof is to use the following criterion, which is a consequence of Lemma 3.2 (proof omitted):
Proposition 3.3. Suppose that for all agents i↪ j 2 N and for all subsets S ✓ N ∩ ¶i↪ j♦, we have q ◁2 (w(S [ ¶i♦)↪ w(S [ ¶j♦)]. Then all Shapley values are equal to 1◁n.
Next, we show that the weights w(S) are concentrated around points of the form ` mn .
Lemma 3.4. Suppose that m > 3n2 . With probability 1 - 2( 2e )n , the following holds: for all S ✓ N, ♣w(S) - ♣S♣m n ♣ p3nm.
Proof. The proof uses a straightforward Chernoff bound [Mitzenmacher and Upfal, 2005] We can assume that S 6= ; (as otherwise the bound is trivial). For each non-empty set S ✓ N, the distribution of w(S) is B(m↪ ♣S♣ n ). Therefore for 0 < δ < 1,
Choosing δ = q 3n2 ♣S♣m < 1, we obtain a bound of 2e-n . Since there are 2n possible sets S, a union bound implies that ♣w(S) - ♣S♣m n ♣ p3nm with probability at least 1 - 2( 2e )n .
Finally, we require the following simple property of quotas. Proposition 3.5. Let n m be two integers, then for any q 2 (0↪m], there exists some ` n such that ♣q - `m◁n♣ ≥ m◁n.
Theorem 3.6 is an immediate corollary of the above claims, as we now show.
Theorem3.6. LetM = m 3n3 . Suppose that ♣q- `m n ♣ > 1 pM mn for all integers `. Then with probability ≥ 1 - 2( 2e )n , all Shapley values are equal to 1n .
Proof. First, note that M > 1, as otherwise, it would imply that for all ` = 1↪ ▷ ▷ ▷ ↪ n, ♣q - `m◁n♣ > 1 pM mn ≥ mn . This is impossible according to Proposition 3.5. Thus, M > 1, i.e., m > 3n3 ≥ 3n2 .
Lemma 3.4 shows that when m > 3n3 , with probability 1 - 2( 2e )n , for all sets S we have ♣w(S) - ♣S♣m n ♣ p3nm; we assume this condition on w(S) henceforth. Suppose, for the sake of obtaining a contradiction, that 'i < 'j for some agents i↪ j. Then Proposition 3.3 shows that there must exist some S ✓ N ∩ ¶i↪ j♦ such that q 2 (w(S [ ¶i♦)↪w(S [ ¶j♦)]. Since both w(S [ ¶i♦) and w(S [ ¶j♦) are p3nmclose to (♣S♣+1)m n , this implies that ♣q - (♣S♣+1)m n ♣ p3nm. However,
contradicting our assumption that ♣q-` mn ♣ ≥ 1 pM · mn for all `. We conclude that with probability at least 1 - 2( 2e )n , all agents have the same Shapley value 1◁n.
Theorem 3.6 implies that if the voter population is much larger than the number of candidates, and votes are assumed to be cast uniformly at random, then choosing a quota that is well away from a multiple of mn will most probably lead to an even distribution of power among the elected representatives.
3.1 HowWeak Can theWeakest Agent Get?
As Theorem 3.6 demonstrates, if the quota is sufficiently bounded away from any integral multiple of mn , then the distribution of power tends to be even among the agents. When the quota is close to an integer multiple of mn , the resulting weighted voting game may not display such an even distribution of power; this is a result of weight perturbations originating in the intrinsic "noise" involved in the process.
Motivated by these observations, we now proceed to study the expected Shapley value of the weakest agent, '1 (recall that we assume that the weights are given in non-decreasing order).
We present two contrasting results. Let q = ` · mn , for an integer `. When ` = o(logn), we show that the expected minimal Shapley value is roughly 1 2n , and so it is at least half the maximal Shapley value, in expectation.
Theorem 3.7. Let q = ` · mn for some integer ` = o(logn). For m = ⌦(n3 log n), E['1] = 1◁(2n) ◦ o(1◁n).
In contrast, when ` = ⌦(n), this effect disappears.
Theorem 3.8. Let q = `· mn for ` 2 ¶1↪ ▷ ▷ ▷ ↪ n♦ such that γ `n 1 - γ for some constant γ > 0. Then for m = ⌦(n3 ), E['1] ≥ 1◁n - Oγ ⇣plog n◁n3⌘.
The idea behind the proof of both theorems is the formula for '1 given in Lemma 3.9 (the full proof is replaced by a sketch due to space constraints). In this formula and in the rest of the section, the probabilities are taken over both the displayed variables and the choice of weights.
Lemma 3.9. Let q = ` · mn , where ` 2 ¶1↪ ▷ ▷ ▷ ↪ n - 1♦. For m = ⌦(n3 log n), E['1] equals
Proof Sketch. Let pk = PrA2R[N∩¶1♦ k ] [q - w1 w(A) < q]; Formula (1) shows that E['1] = 1n Pn-1 k=0 pk. We then consider three cases, corresponding to possible sizes of the set A in the formula for pk; each of these cases will contribute a term in expression of the lemma. Since w(A) ⇡ ♣A♣m n , when ♣A♣ ≥ ` + 1 it is highly unlikely that w(A) < q. Similarly, since w(A) + w1 ⇡ (♣A♣+1)m n , when ♣A♣ ` - 2 it is highly unlikely that w(A) ≥ q - w1. So roughly speaking, E['1] ⇡ p`-1+p` n . Furthermore, when ♣A♣ = `-1, it is very likely that w(A) < q, and when ♣A♣ = `, it is very likely that w(A) ≥ q -w1. So E['1] equals approximately
The trick now is to relate the two terms; some manipulation shows that PrA2R[N∩¶1♦ ` ] [w(A) < q] equals
To address the first term in the above expression, note that when ♣A♣ = `, E[w(A)] = q, and so the first probability is roughly 1◁2. Therefore PrA2R[N∩¶1♦ ` ] [w(A) < q] is approximatelyn
Substituting this in our estimate for E['1], we obtain the desired result.
In order to estimate the expression PrA2R[N∩¶1♦ `-1 ] [w(A) + w1 ≥ q], we need a good estimate for w1. Such an estimate is given by the following lemma.
We obtain this bound by applying the Poisson approximation technique to the Balls and Bins process, which we now roughly describe. Consider the case of a random event, defined with respect to the weight distribution induced by the process. The probability of the event can be wellapproximated by the probability of an analogous event, defined with respect to n i.i.d. Poisson random variables, assuming the event is monotone in the number of balls.
We can now prove Theorem 3.7.
Proof of Theorem 3.7. It is not hard to show that PrA2R[N∩¶1♦ `-1 ] [w(A) +w1 ≥ q] is at most
The concentration bound on w1 (Lemma 3.10) shows that with probability 1 - 2◁n, q - w1 ≥ (`-1)m n + q mlogn 3n . Assuming this, a Chernoff bound gives
which is o(1) using ` = o(logn). Accounting for possible failure of the bound on q - w1, we obtain
which is o(1) assuming ` = o(logn). Lemma 3.9 therefore shows that
since ` = o(logn) implies 1 n-` = 1n + ` n(n-`) = 1n + o( 1n ). Lemma 3.9 also implies a matching lower bound:
In the regime of ` addressed by Theorem 3.7, PrA2R[N∩¶1♦ `-1 ] [w(A) + w1 ≥ q] was negligible. In contrast, in the regime of ` addressed by Theorem 3.8, PrA2R[N∩¶1♦ `-1 ] [w(A) + w1 ≥ q] ⇡ 1◁2, as the following lemma, which is proved in the full version of the paper using the Berry-Esseen theorem [Berry, 1941], shows.
Lemma 3.11. Suppose q = ` mn for an integer ` satisfying γ `-1 n 1-γ, and let
Then for m ≥ 4n3 , we have that t" ≥ 12 - " 2⇡γ plog n◁n-1◁n▷
As Lemma 3.10 shows, 1◁3 " 4 with probability 1-2◁n, which explains the usefulness of this bound. We can now prove Theorem 3.8.
Proof of Theorem 3.8. Lemma 3.10 shows that with probability 1-2◁n, w1 = mn -"q m log n n for some 1◁3 " 4, in which regime Lemma 3.11 shows that t" ≥ 12 - 2 ⇡γ q log n n - 1n . Accounting for the case in which " is out of bounds,
Finally, using Lemma 3.9, we can show that E['1] is at least 1n - Oγ ✓q log n n3 ◆.
4 The Balls and Bins Distribution: the Exponential Case
In Section 3, we showed that even when the distribution is not inherently biased towards any agent, substantial inequalities may arise due to random noise. We now turn to study the case in which the distribution is strongly biased. Returning to our formal definition of the general balls and bins process, we assume that the probabilities in the vector p are ordered in increasing order and pi◁pi+1 = ⇢, for some ⇢ < 1◁2; we henceforth refer to this distribution as ⇢-exponential. We observe that as m approaches 1, the weight vector follows a power law with probability 1, where for each i = 1↪ ▷ ▷ ▷ ↪ n-1, wi◁wi+1 = ⇢. Super-increasing weight vectors [Zuckerman et al., 2012] turn out to naturally arise under this distribution. A series of positive weights w = (w1↪ ▷ ▷ ▷ ↪ wn) is said to be super-increasing (SI) if for every i = 1↪ ▷ ▷ ▷ ↪ n, Pi-1 j=1 wj < wi .
The following three results (Lemma 4.1, Lemma 4.2 and Theorem 4.3) show that for a sufficiently large value of m, estimating the Shapley values in WVG's where the weights are sampled from an exponential distribution can be reduced to the study of Shapley values in a game with a prescribed (fixed) SI weight vector. This insight is useful, as voting power in SI WVGs is well understood (e.g., [Aziz and Paterson, 2008; Zuckerman et al., 2012; Oren et al., 2014]).
The following lemma shows that when the weights are sampled from an exponential distribution, given enough voters, it is highly probable that the resulting weights (i.e. the number of balls in each bin) are super-increasing.
Lemma 4.1. Assume that m voters submit the votes according to the ⇢-exponential distribution for some 0 < ⇢ < 1◁2. There is a (universal) constant C > 0 such that if m ≥ C⇢-n (1 - 2⇢)-2 logn then the resulting weight vector is super-increasing with probability 1 - O( 1n ). Also, as m!1, the probability approaches 1.
The proof of the lemma uses a standard concentration bound, and is omitted due to space constraints.
Before we proceed, it would be helpful to provide some intuition about the behavior of the Shapley values. Assuming that agent weights are given by an increasing sequence w of n reals, consider the set of all distinct subset sums of the weights S(w) = ¶s : 9S ✓ N s.t. s = w(S)♦. We assume that S(w) is ordered; i.e., S(w) = ¶sj♦tj=1 , such that sj < sj+1. It is easy to show that 'i(q) is constant within the interval (sj↪ sj+1] for all sj↪ sj+1 2 S(w). Given a set S ✓ N, we let S+ be the subsequent set in the ordering induced by S(w); thus, there exists a unique interval I w(S) = (sj ↪ sj+1] such that w(S) = sj ↪ w(S+) = sj+1.
Suppose that w is generated using a Balls and Bins process with probabilities p, where p is a SI sequence; then it stands to reason that if a sufficiently large number of balls is tossed (i.e., m is large enough), then the voting power distribution under w will be very close to the power distribution under the weight vector p. This intuition is captured in the following lemma, whose proof is omitted.
Lemma 4.2. Suppose that p = (p1↪ ▷ ▷ ▷ ↪ pn) is a SI sequence summing to 1, and let w1↪ ▷ ▷ ▷ ↪ wn be obtained by sampling m balls from the distribution p.
Combining both lemmas, we obtain our main result on the exponential case of the Balls and Bins distribution.
Theorem 4.3. Assume that m ≥ C⇢-n (1 - 2⇢)-2 logn voters submit their votes according to the ⇢-exponential distribution, for some 0 < ⇢ < 1◁2. Given ⌧ 2 I p(S) such that ♣⌧ - w(S)♣↪ ♣⌧ - w(S+)♣ ≥ q log(nm) n , then Pr[8i 2 N↪ 'i(w;mT) = 'i(p; T)] ≥ 1 - O( 1n ). Furthermore, for all but finitely many values of T 2 (0↪ 1], limm!1 Pr['i(w; mT ) = 'i(p; T )] = 1.
Proof. Lemma 4.1 gives a constant C > 0 such that if m ≥ C⇢-n (2⇢ - 1)-2 log n then w is SI with probability 1-O(1◁n). Hence the first part of the theorem follows from Lemma 4.2.
For the second part, Lemma 4.1 shows that as m ! 1, the probability that w is SI approaches 1. Suppose now that ⌧ does not belong to S(w) (these are the finitely many exceptions). When m is large enough, the conditions of Lemma 4.2 are satisfied, and so as m !1, the error probability in that lemma goes to 0. The second part of the theorem follows.
The theorem shows that in the case of the exponential distribution, if the number of balls is large enough then we can calculate with high probability the Shapley values of the resulting distribution based on the Shapley values of the original exponential distribution (without sampling).
5 Conclusions and FutureWork
We study the Shapley value as a function of the quota under a number of natural weight distributions, allowing us to reason rigorously about the effect of quota changes. We were also able to show that when the probability vectors constitute SI sequences, these probabilities can be treated as if they were the deterministic agent weights. The take-home message from our work is that changes to the quota matter, even when weights are nearly identical. Given the relative success of this analysis, it would be interesting to study other natural weight distributions (the case of i.i.d. weights is studied by Filmus et al. [2016]). Moreover, our results show that employing probabilistic approaches to cooperative games (beyond the case of WVG's) may be a useful research avenue. Other classes of cooperative games with a natural notion of resources are a promising direction for future work. For example, consider threshold task games [Chalkiadakis et al., 2010]: these are natural generalizations of WVGs to a setting with more than one task: every task t has a quota q(t) and a value V (t); a value of a set S is the value of the best task it can complete. Assuming that agent weights are sampled from some distribution, it would be interesting to study the expected effects on agent values, based on the choice of tasks. Similarly, in multicommodity network flow games [Markakis and Saberi, 2005], each agent controls an edge in a directed graph; the value of a set S ✓ N is the maximal multicommodity flow it can transfer through a graph. Again, the effects of choices of commodities on agents' values are a promising direction for future study.
Acknowledgments We thank the IJCAI reviewers for their helpful comments. This research was partially conducted while Oren and Zick were at MSR; Zick was supported by A*STAR Singapore.
@inproceedings{ijcai2016p18,
  title     = {A Characterization of Voting Power for Discrete Weight Distributions},
  author    = {Bachrach, Yoram and Filmus, Yuval and Oren, Joel and Zick, Yair},
  booktitle = {Proceedings of the Twenty-Fifth International Joint Conference on
               Artificial Intelligence, {IJCAI-16}},
  publisher = {AAAI Press / International Joint Conferences on Artificial Intelligence},
  editor    = {Subbarao Kambhampati},
  pages     = {74--79},
  year      = {2016},
  month     = {7},
  url       = {https://ijcai.org/proceedings/2016/18},
}
TY - CPAPER TI - A Characterization of Voting Power for Discrete Weight Distributions AU - Bachrach, Yoram AU - Filmus, Yuval AU - Oren, Joel AU - Zick, Yair T2 - Proceedings of the Twenty-Fifth International Joint Conference on Artificial Intelligence, IJCAI-16 PB - AAAI Press / International Joint Conferences on Artificial Intelligence PY - 2016 SP - 74 EP - 79 UR - https://ijcai.org/proceedings/2016/18 ER -Copied
Machine-readable versions of this paper, for tools and AI agents:





