
Bias in Algorithm Portfolio Performance Evaluation
Proceedings of the Twenty-Fifth International Joint Conference on Artificial Intelligence. Pages 712-718.
Abstract
A Virtual Best Solver (VBS) is a hypothetical algorithm that selects the best solver from a given portfolio of alternatives on a per-instance basis. The VBS idealizes performance when all solvers in a portfolio are run in parallel, and also gives a valuable bound on the performance of portfolio-based algorithm selectors. Typically, VBS performance is measured by running every solver in a portfolio once on a given instance and reporting the best performance over all solvers. Here, we argue that doing so results in a flawed measure that is biased to reporting better performance when a randomized solver is present in an algorithm portfolio. As long as there is more than 1 solver in the portfolio, a single randomized solver can cause VBS bias. Specifically, this flawed notion of VBS tends to show performance better than that achievable by a perfect selector that for each given instance runs the solver with the best expected running time. We report results from an empirical study using solvers and instances submitted to several SAT competitions, in which we observe significant bias on many random instances and some combinatorial instances. We also show that the bias increases with the number of randomized solvers and decreases as we average solver performance over many independent runs per instance. We propose an alternative VBS performance measure by (1) empirically obtaining the solver with best expected performance for each instance and (2) taking bootstrap samples for this solver on every instance, to obtain a confidence interval on VBS performance. Our findings shed new light on widely studied algorithm selection benchmarks and help explain performance gaps observed between VBS and state-of-the-art algorithm selection approaches.
- [Berthold, 2013] T. Berthold. Measuring the impact of primal heuristics. Operations Research Letters, 41(6):611-614, 2013.
- [Fréchette et al., 2016] A. Fréchette, N. Newman, and K. Leyton-Brown. Solving the station repacking problem. In Conference on Artificial Intelligence (AAAI), 2016.
- [Gagliolo and Schmidhuber, 2006] M. Gagliolo and J. Schmidhuber. Learning dynamic algorithm portfo- lios. Annals of Mathematics and Artificial Intelligence, 47(3-4):295-328, 2006.
- [Gomes and Selman, 2001] C. P. Gomes and B. Selman. Al- gorithm portfolios. Artificial Intelligence, 126(1-2):43-62, 2001.
- [Gomes et al., 1997] C. P. Gomes, B. Selman, and N. Crato. Heavy-tailed distributions in combinatorial search. In Principles and Practice of Constraint Programming-CP97, pages 121-135. Springer, 1997.
- [Gomes et al., 2008] C. P. Gomes, H. Kautz, A. Sabharwal, and B. Selman. Satisfiability solvers. Foundations of Artifi- cial Intelligence, 3:89-134, 2008.
- [Hoos and Stützle, 1999] H. H. Hoos and T. Stützle. Towards a characterisation of the behaviour of stochastic local search algorithms for sat. Artificial Intelligence, 112(1):213-232, 1999.
- [Kadioglu et al., 2011] S. Kadioglu, Y. Malitsky, A. Sabhar- wal, H. Samulowitz, and M. Sellmann. Algorithm selection and scheduling. Number 6876, pages 454-469, 2011.
- [Kotthoff et al., 2015] L. Kotthoff, P. Kerschke, H. Hoos, and H. Trautmann. Improving the state of the art in inexact TSP solving using per-instance algorithm selection. In Learn- ing and Intelligent Optimization, pages 202-217. Springer, 2015.
- [Kotthoff, 2012] L. Kotthoff. Algorithm selection for com- binatorial search problems: A survey. arXiv preprint arXiv:1210.7959, 2012.
- [Kroc et al., 2010] L. Kroc, A. Sabharwal, and B. Selman. An empirical study of optimal noise and runtime distributions in local search. In Theory and Applications of Satisfiability Testing-SAT 2010, pages 346-351. Springer, 2010.
- [Le Berre et al., 2015] D. Le Berre, O. Roussel, and L. Si- mon. The international SAT competitions web page. www.satcompetition.org, 2015. Accessed: 2015-11-16. Link
- [Leyton-Brown et al., 2003] K. Leyton-Brown, E. Nudelman, G. Andrew, J. McFadden, and Y. Shoham. A portfolio approach to algorithm selection. In Proc. IJCAI, pages 1542-1543, 2003.
- [Lindauer et al., 2015] M. Lindauer, H. H. Hoos, F. Hutter, and T. Schaub. Autofolio: Algorithm configuration for algorithm selection. In Workshops at the Twenty-Ninth AAAI Conference on Artificial Intelligence, 2015.
- [Malitsky et al., 2011] Y. Malitsky, A. Sabharwal, H. Samu- lowitz, and M. Sellmann. Non-model-based algorithm port- folios for sat. In Theory and Applications of Satisfiability Testing-SAT 2011, pages 369-370. Springer, 2011.
- [Malitsky et al., 2013] Y. Malitsky, A. Sabharwal, H. Samu- lowitz, and M. Sellmann. Algorithm portfolios based on cost-sensitive hierarchical clustering. In Proceedings of the Twenty-Third international joint conference on Artificial Intelligence, pages 608-614. AAAI Press, 2013. IJCAI
- [Nudelman et al., 2003] E. Nudelman, K. Leyton-Brown, G. Andrew, C. Gomes, J. McFadden, B. Selman, and Y. Shoham. Satzilla 0.9. Solver description, International SAT Competition, 2003.
- [Prasad et al., 2005] M. R. Prasad, A. Biere, and A. Gupta. A survey of recent advances in SAT-based formal verification. International Journal on Software Tools for Technology Transfer, 7(2):156-173, 2005.
- [Rice, 1976] J. R. Rice. The algorithm selection problem. Advances in Computers, 15:65-118, 1976.
- [Stern et al., 2010] D. H. Stern, H. Samulowitz, R. Herbrich, T. Graepel, L. Pulina, and A. Tacchella. Collaborative expert portfolio management. In AAAI, pages 179-184, 2010.
- [Sutcliffe and Suttner, 2001] G. Sutcliffe and C. Suttner. Evaluating general purpose automated theorem proving systems. Artificial intelligence, 131(1):39-54, 2001.
- [Xu et al., 2008] L. Xu, F. Hutter, H. H. Hoos, and K. Leyton- Brown. SATzilla: portfolio-based algorithm selection for SAT. JAIR, 32:565-606, 2008.
- [Xu et al., 2012] L. Xu, F. Hutter, J. Shen, H. H. Hoos, and K. Leyton-Brown. Satzilla2012: Improved algorithm selec- tion based on cost-sensitive classification models. 2012.
References were extracted automatically from the PDF and may contain errors.
Full text extracted automatically from the PDF; figures, tables and equations may differ. The PDF is the version of record.
1 Introduction
For many computational problems with important practical applications, there has been considerable research into highperformance algorithms. As in the case of the prominent satisfiability problem in propositional logic (SAT), practitioners often have access to many solvers for their particular problem and must make decisions about which solver(s) to run. Most often, this process begins with empirically evaluating available solvers on a representative set of problem instances. It is common in practice to choose a Single Best Solver (SBS) that minimizes mean performance over the instance set. However, the SBS can underperform in situations where different solvers work well on different instances. In such cases, dramatic improvements can be achieved by methods based on algorithm portfolios-either selecting an algorithm from the portfolio at runtime or running multiple algorithms in parallel. To measure the potential of such approaches, a Virtual Best Solver (VBS) is used as an idealized state-of-the-art (SOTA) solver that identifies the best algorithm from a given portfolio on a per-instance basis. The VBS is an idealized representation of the performance achievable by running all solvers in a given portfolio in parallel, and it also bounds the performance of any portfolio-based algorithm selector. 1
The notion of portfolio-based algorithm selection was introduced as a way to exploit multiple uncorrelated algorithms in practice by combining their strengths [Rice, 1976; Kotthoff, 2012]. In the model-based algorithm selection approach, a model is learned to map informative instance features to choices of algorithms and the model is queried online to select solvers for execution on a per-instance basis. There has been much research on portfolio-based algorithm selectors, and state-of-the art approaches achieve notable performance gains over their component solvers, especially in applications to NP-hard combinatorial search problems (e.g., SAT, TSP) [Nudelman et al., 2003; Xu et al., 2008; Malitsky et al., 2013; Kotthoff et al., 2015]. In the algorithm selection literature, it is common to present portfolio performance in the context of VBS performance (see citations below), using the performance gap between the best existing portfolio-based selector and the VBS bound used as a measure of the potential for further improvement. To practitioners considering the merit of algorithm selection for an application, the performance gap between SBS and VBS performance can be a good indicator for the potential merit of using an instance-based selection approach. Especially in settings where strong features do not yet exist, the size of the gap may help to determine whether a feasibility performance study is worthwhile.
1 This bound can be loose, e.g., due to variation in running time not captured by instance features, insufficient training data and the cost of computing instance features.
The concept of a VBS as described above has been used for over a decade. Sutcliffe and Suttner [2001] were among the first to introduce the concept with their idea of a "state-of-theart (SOTA) system" able to solve any problem that at least one of many existing Automated Theorem Proving (ATP) systems could tackle. Leyton-Brown et al. [2003] measured performance against an "ideal portfolio where algorithm selection is performed perfectly and with no overhead". Gagliolo and Schmidhuber [2006] and Xu et al. [2008] refer to this ideal portfolio as an "oracle" which runs the best algorithm for a given problem instance. To our knowledge, the term VBS originated in the 2009 SAT Competition, defined as an oracle that selects the submitted solver that most efficiently solves a given instance [Le Berre et al., 2015]. The concept of VBS is still widely used in the more recent literature [Stern et al., 2010; Kadioglu et al., 2011; Malitsky et al., 2011; Berthold, 2013; Lindauer et al., 2015].
With very few exceptions, VBS performance is evaluated by running every solver in a portfolio once on a given instance and reporting the minimum performance over all solvers, as in the SAT competitions. Gagliolo and Schmidhuber [2006] reran each solver in their portfolio on every instance for every iteration of their dynamic learning procedure and report 95% confidence intervals based on VBS performance evaluations (as defined above) from every iteration. Kotthoff et al. [2015] report VBS performance for an instance as the minimum of the median performance over 10 samples from each solver. Their work investigated algorithm selection for two state-ofthe-art TSP solvers. Due to high variance in the running times of these underlying solvers, they performed 10 independent runs per solver on every instance. However, their protocol was not motivated by bias in VBS performance estimation, nor did they estimate the statistical stability of their performance estimates.
In this work, we show how the standard computation of VBS performance produces optimistically biased estimates in the presence of randomized solvers. To the best of our knowledge, no previous work has identified this bias; we thus fear that it has led to errors in the evaluation of portfolio performance. We show that this bias can be overcome by considering a notion of VBS that chooses the algorithm with best expected performance on each instance. More specifically, we estimate VBS performance by (1) empirically identifying the solver with best expected performance on each instance based on many random samples; and (2) using bootstrap resampling to estimate a confidence interval for this performance estimate. Gathering many samples for a solver on each instance is computationally more expensive than current practice; however, we show that doing so can lead to qualitatively different results.
The remainder of this paper is organized as follows: Section 2 gives a detailed description of bias in VBS evaluation. Section 3 reports results from an empirical study on solvers and instances submitted to the SAT competitions and SAT races between 2007 and 2014, showing evidence of bias in VBS evaluation on sets of random and "hard combinatorial" instances; this bias increases with the number of randomized solvers and decreases as we average solver performance over many random samples. We summarize our findings in Section
4, where we also discuss implications of this research and outline directions for future work.
2 ProblemDescription
When a portfolio consists entirely of deterministic solvers, high-confidence estimates of a component algorithm's performance can usually be obtained from a single run per problem instance. 2 In contrast, randomized solvers often exhibit highly variable running times across multiple independent runs on the same instance; many samples are thus required to accurately estimate mean performance. It is current practice to estimate VBS performance as the minimum of a set of single samples from each randomized solver's running time distribution. This approach tends to underestimate the amount of time that would be required to run the selected solver again on each given instance. The resulting bias in VBS performance can be interpreted as the difference between runs of the solver with best expected performance and the best of the single runs performed for every solver in a given portfolio.
We now show more formally how the problem arises. Let Xi↪j be a random variable representing the running time of solver i on instance j, and let X1:n↪j(min) be the random variable representing the minimum of single samples from each of X1↪j, X2↪j, . . . , Xn↪j. As all samples are independent, the probability of at least one solver solving an instance j at time t is 1- Qni=1 (1-P(Xi↪j < t)). Let the CDF of Xi↪j be FXi↪j (t), and let the CDF of X1:n↪j(min) be FX1:n↪j(min)(t). We can write the CDF of the minimum in terms of the CDFs of all the randomized solvers in the portfolio,
The solver with the best expected performance on instance j is Sj best 2 arg maxs E[Xs↪j ].
We will now show how the distributions of XSj best ↪j and X1:n↪j(min) can differ. We restrict our investigation to minimizing the running time of a combinatorial search procedure - the scenario for which portfolio-based algorithm selection has been most prominent; however, we would also expect this type of VBS bias to arise in other contexts, such as combinatorial optimization, where Xi↪j would represent the solution quality of solver i on instance j for fixed running time. Substantial research effort has been expended on characterizing the running time distributions (RTDs) of randomized solvers for combinatorial search problems, particularly to inform restart strategies. It is common to model the RTDs of randomized, DPLLtype algorithms without restarts as heavy-tailed [Gomes et al., 1997]. The RTDs of DPLL-type solvers enhanced with restart strategies have been modelled as fat-tail distributions, such as Weibull or log-normal distributions [Gomes and Selman, 2001; Gomes et al., 2008]. Local-search-based solvers are unlikely to exhibit fat-tail running time distributions; Hoos and St¨utzle [1999] and Kroc et al. [2010] have demonstrated that their RTDs typically closely resemble exponential distributions. Indeed, such exponential distributions appear to closely fit the RTDs of the randomized solvers considered in our portfolios of SAT solvers (see Section 3).
2 Of course, the running time of a deterministic solver is still a random variable, due to interaction with other processes running on the same machine, cache effects, etc.
We therefore consider two idealized scenarios: one in which randomized solvers are characterized by exponential RTDs, and the other where the RTDs correspond to Weibull distributions. The CDFs of exponential and Weibull distributions are as follows:
Using Equation 1, we can write the CDF of the minimum of n samples from each distribution as follows:
We now consider the extreme example of portfolios consisting of many copies of the same solver. (Obviously, in this case, the VBS does not outperform the portfolio-based algorithm selector consisting of only one copy of the solver, meaning that any performance difference is solely due to bias in estimating VBS performance.) Figures 1a and 1b show the analytically determined RTDs of the traditionally calculated VBS in these cases. Note that the RTDs shift towards increasingly optimistic estimates as we take the minimum running times over 2, 3, 5, 10, and 20 identical, randomized solvers. The same qualitative effect occurs for the Weibull distribution, albeit with a smaller magnitude when k > 1.
3 Experimental Setup and Results
We now present an empirical study demonstrating that optimistically biased estimates of VBS performance occur in practice. We focus on the SAT competition, which has been one of the most prominent testbeds for research into algorithm portfolios and the development of their constituent algorithms. Indeed, SAT is probably the most studied NP-complete decision problem and is also very important in practice, e.g.,for hardware and software verification [Prasad et al., 2005] as well as for radio spectrum repacking [Fr´echette et al., 2016].
We began by gathering all runnable solvers submitted to SAT competitions from 2007 to 2014 in the Hard-combinatorial SAT+UNSAT, Application SAT+UNSAT, and Random SAT+UNSAT tracks. 3 We ran each solver once on a large compilation of instances from the 2012 - 2014 SAT competitions and SAT races. All runs were performed on the 544-node Westgrid cluster Orcinus (each of whose nodes is equipped with two 6-core, 2.66 GHz Intel Xeon X5650 CPUs and 24GB memory, running Red Hat Enterprise Linux Server 5.3). Every solver was given a cutoff time of 5000 CPU seconds to solve each instance; our whole experiment took 19.29 CPU years.
3 We say that a solver was not runnable when we encountered technical problems trying to run it (e.g., missing runtime libraries, runtime errors that were not fixed by recompilation). A majority of solvers (88%) were runnable, including all medalists.
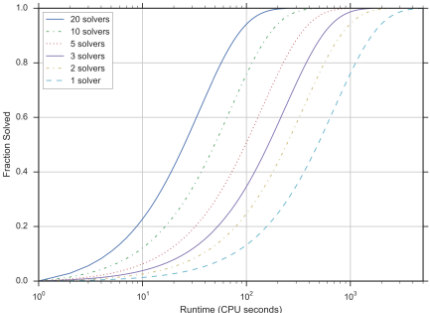
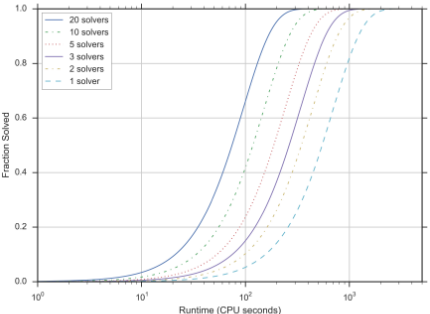
Figure 1: RTD of VBS for portfolios with increasing numbers of randomized solvers with identical, idealized yet realistic RTDs.
To determine whether the standard VBS performance estimate was optimistically biased on this data, we must compare with our improved notion of VBS. Going forward, we use the term VBS to denote the traditional (biased) VBS and the term VBS⇤ to denote our new notion of VBS that chooses the algorithm with best expected empirical performance.
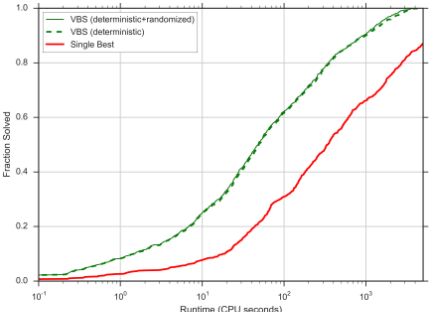
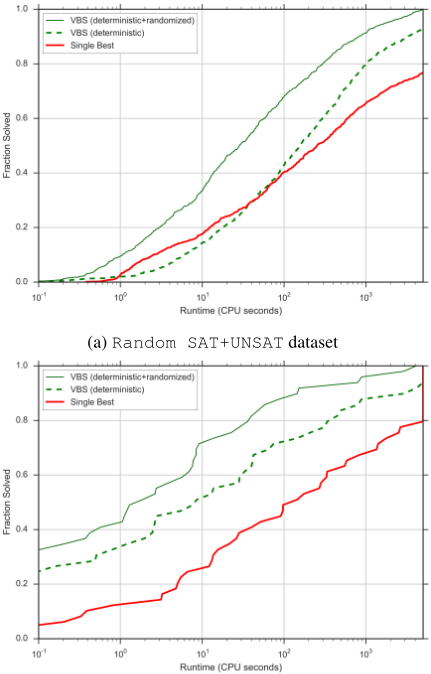
Estimating the performance of VBS⇤ is more computationally expensive, because it requires performing many runs of each randomized solver to obtain an empirical measure of expected performance on a given instance. To mitigate this cost, we can start by considering an upper bound on potential bias: the proportion of VBS gap to which randomized solvers contribute. We illustrate the marginal contribution of randomized solvers to the VBS in Figures 2 and 3, by showing CDFs for the VBS with and without randomized solvers for all instances solved by at least one solver. We expect deterministic solvers to make at most a minimal contribution to bias, since they exhibit virtually no variation in running time.
For the Application SAT+UNSAT and Hardcombinatorial SAT+UNSAT tracks in Figures 2a and 2b, the small shift in the CDF after adding randomized solvers indicates that there is very little scope for VBS bias in these datasets. 4 In contrast, for Random SAT+UNSAT in Figure 3a, the shift is substantial, giving scope for considerable bias in the VBS estimate. Indeed, it is well known that randomized solvers are considerably more important for top performance in the Random SAT+UNSAT track (constituting 81% of VBS solvers) compared to the Application SAT+UNSAT (4%) and Hard-combinatorial SAT+UNSAT (21%) tracks. We also investigated different categories of instances within the Application SAT+UNSAT and Hard-combinatorial SAT+UNSAT tracks where randomized solvers made significant contribution to the VBS. We found that on sgen 5 instances (a subset of Hard-combinatorial SAT+UNSAT) in Figure 3b, there was also a large shift in estimated VBS performance after adding randomized solvers. We thus focus our attention on the Random SAT+UNSAT and Hard-combinatorial SAT+UNSAT-sgen benchmarks.
We ran the 21 randomized solvers from Random SAT+UNSAT on 50 randomly sampled instances from the Random SAT+UNSAT track and the 12 randomized solvers from the Hard-combinatorial SAT+UNSAT on all 44 sgen instances from the Hard-combinatorial SAT+UNSAT track. The solvers are listed in Table 1. We ran each solver 50 times on every instance with distinct pseudorandom number seeds and with a per-run cutoff time of 5000 CPU seconds (as used in the 2014 SAT Competition). Due to the large number of runs required for our experiment and the dependency of CPU access on the memory requests of jobs, we elected to allocate different amounts of memory for different solvers, depending on their memory requirements. We profiled each solver's memory usage over all instances and allocated to each solver its maximum RAM usage plus a small buffer: between 1GB and 3GB in total, depending on the solver. We used the Orcinus cluster as described previously. This experiment required 7.88 CPU years to complete.
We estimated VBS performance as follows. In order to quantify the uncertainty in our estimates (due to the limited number of independent runs per solver on each instance), we used bootstrap resampling of the given instance sets. We drew 10 000 bootstrap samples of 50 and 44 instances (uniformly at random, with replacement) from our Random SAT+UNSAT and sgen instance sets, respectively. For each instance and solver, we selected one of our 50 runs uniformly at random, resulting in 21 solver runs on Random SAT+UNSAT and 12 solver runs on sgen per instance. We then determined the
4 We removed some so-called random-fixed-forced-shape instances from Hard-combinatorial SAT+UNSAT on which randomized solvers performed well, because upon further inspection, we found that these instance better fit the Random SAT+UNSAT than the Hard-combinatorial SAT+UNSAT category.
5 sgen is a generator for small, difficult SAT+UNSAT benchmarks
(a) Application SAT+UNSAT dataset.
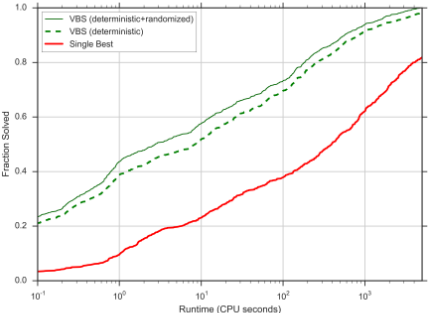
Figure 2: CDFs of running times over instances sets comparing VBS performance with and without randomized solvers for Application SAT+UNSAT and Hard-combinatorial SAT+UNSAT datasets. Cutoff = 5000 CPU seconds.
VBS estimate of performance for that instance as the minimum time required by any of the solver runs, and determined the CDF of VBS performance over the instances in that bootstrap sample, resulting in 10 000 CDFs.
We estimated VBS⇤ performance based on the full set of 50 runs per instance as follows. First, we determined the solver with the best PAR10 performance over the 50 runs for each instance in our sets. (PAR10 represents penalized average running time, counting runs that did not produce a solution, due to solver crashes or timeouts, at 10 times the cutoff time of 5000 CPU seconds. 6 ) Finally, we used bootstrap resampling
6 Our study investigates whether PAR10 VBS performance can be estimated in an unbiased way. Separately, we note that PAR10 itself is not an unbiased estimate of uncapped running time. While the best solver as identified by PARk may change with different choices of k, the direction of the bias depends on the RTDs of the constituent solvers. This problem is inherent in capping of running time, is already well understood, and is not one we consider further in this work.
- (b) Hard-combinatorial SAT+UNSAT - sgen dataset
Figure 3: CDFs of running times over instances sets comparing VBS performance with and without randomized solvers for Random SAT+UNSAT and Hard-combinatorial SAT+UNSAT: sgen datasets. Cutoff = 5000 CPU seconds.
as before and thus obtained CDFs of VBS⇤ performance for each of 10 000 bootstrap samples.
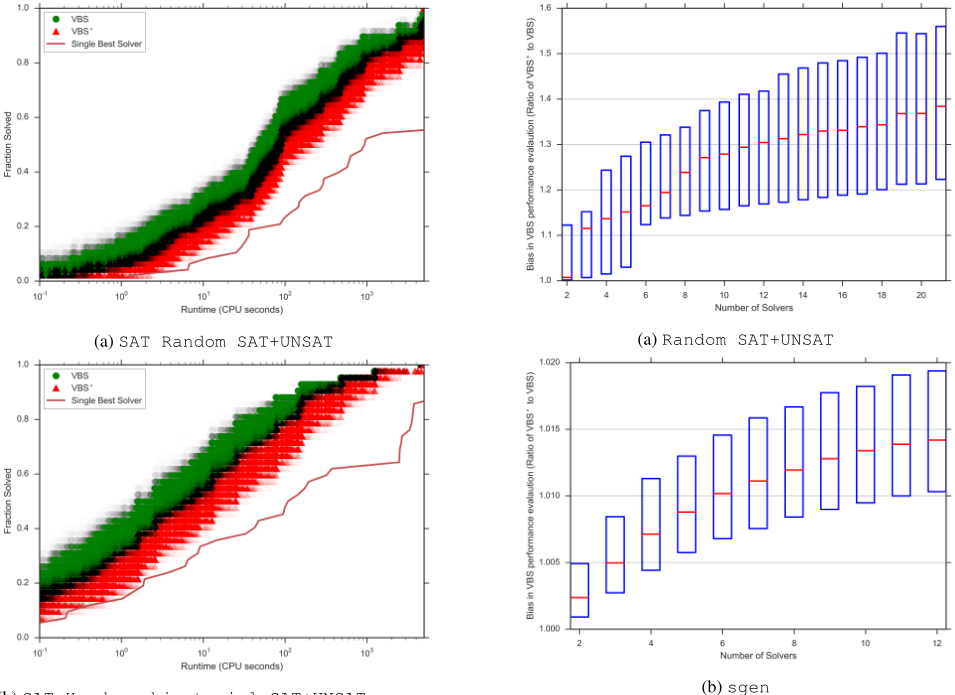
Figure 4 shows the bundles of CDFs obtained by bootstrap sampling for VBS and VBS⇤ performance estimates for our two datasets. The difference between the estimates is clearly visible, as is the sizable uncertainty associated with both estimates, given our relatively small number of instances and 50 runs per algorithm and instance. Overall, we observe that the VBS estimate was substantially optimistic: it expected about 10%more instances to be solved across a large range of running times for both datasets. For the Random SAT+UNSAT benchmark, this finding explains a substantial portion of the performance gap previously observed between VBS performance and state-of-the-art portfolio-based algorithm selectors. Specifically, the PAR10 score averaged over all bootstrap samples was 5 961 CPU seconds for VBS and 8 367 CPU seconds for VBS⇤ , while the single best solver (SB) had a PAR10 score of 21 350 CPU seconds. Therefore, VBS⇤ demonstrates that the SB-VBS gap was overestimated by ⇡ 15%. We now look at how much of the gap state-of-the-art algorithm selectors can close on the most recent SAT Random benchmarks from the literature: by 95% and 26% on SAT Random 2011 and SAT Random 2012 datasets, respectively [Lindauer et al., 2015]. However, observe that we cannot infer that the VBS bias would be identical on these other benchmarks; for example, while our SAT Random dataset contains all the solvers from these 2011 and 2012 datasets, it also includes many other powerful, recent solvers, such as dimetheus (winner of SAT Random track of the 2014 SAT Competition).
| Random | Hard-Combinatorial |
|---|---|
| adaptnovelty 2007 BalancedZ 64-bit V2014 CCA2014 2.0 CSCCSat2014 SC2014 csls pnorm 8cores 2011 dimetheus 2.100 EagleUP-1.565.350 2011 gnoveltyplus2 2009 gNoveltyplus T 2009 gNoveltyplusGCwa 1.0 hybridGM3 2009 iPAWS 2009 march br satplusunsat Nccaplus v1.05 probSAT sc14 sapsrt 2007 sattime2014r 2014r SGSeq 1.0 sparrow2011 2011 TNM 2009 YalSAT 03l | CCAnrplusglucose 2014 GlucoRed gNovelty+GCa 1.0 gNoveltyplusGCwa 1.0 priss 2011 RSeq2014 v1.1 RSeq sattimeRelbackSeq 2013 SGSeq 1dot0 SparrowToRiss 2014 SparrowToRiss SC13 varsat crafted 2009 |
In conclusion, our VBS⇤ performance estimates give a much more realistic bound on the performance of portfolio-based selectors; using this improved bound, we are able to observe that the performance achieved by state-of-the-art algorithm selection systems, such as SATzilla [Xu et al., 2012], is much closer to optimal than was known previously.
We next investigate the magnitude of the VBS bias as a function of the number of solvers. We already saw analytically, in Section 2, that expected bias in estimated VBS performance grows with the number of identical solvers. Here we investigate what happens when solvers exhibit heterogeneous performance. To do this, we again used bootstrap sampling. We first obtained a bootstrap sample for VBS⇤ as before. Then, we gathered a VBS bootstrap sample for k solvers as follows. First, we sampled 50 instances with replacement. Then, for each instance, we determined the minimum running time of a single run taken uniformly at random from each of k - 1 randomly selected randomized solvers in addition to the solver with best expected performance. We then computed the PAR10 performance of the VBS⇤ and VBS bootstrap samples. For every portfolio of size k, we took 1000 bootstrap sam-
(b) SAT Hard-combinatorial SAT+UNSAT: sgen
Figure 4: Bootstrap CDFs comparing performance of VBS (traditional biased VBS) and VBS⇤ (VBS that chooses the algorithm with best expected empirical measure of performance).
ples. These distributions are presented as boxplots in Figure 5. The y-axis indicates the ratio between PAR10 performance estimates of VBS⇤ and VBS. The top and bottom boundary of each box represent the 25th and 75th percentiles of the ratios between bootstrap sample performance estimates. We note large variability in bias, depending on which solvers were sampled, but observe a clear trend that bias increases with portfolio size.
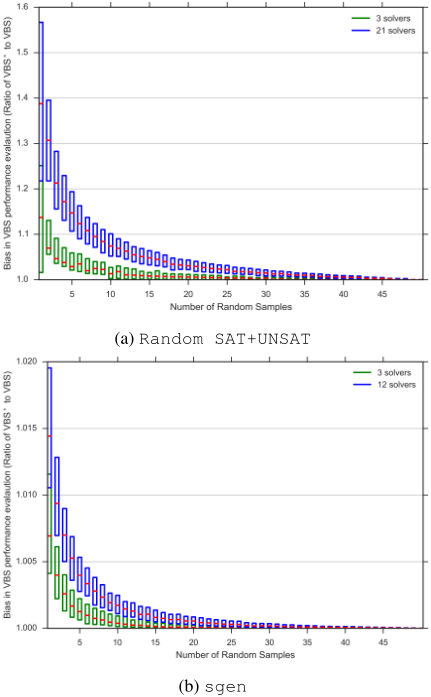
Our experiments were computationally expensive to conduct: we ran every randomized solver 50 times on every instance. Such exhaustive studies may not always be possible in practice. Thus, it is important to understand how many random samples are actually required to obtain relatively unbiased estimates of VBS performance. To do this, we once more employed bootstrap resampling. For every bootstrap sample, we first obtained the PAR10 performance of a VBS⇤ bootstrap sample as before. Then, we calculated the PAR10 performance of a VBS bootstrap sample as follows. First, we sampled 50 instances with replacement. Next, for each instance, we determined the running time of the minimum over the means of j random samples from each of k - 1 randomly selected solvers in addition to the solver with best expected performance.
Figure 5: Trend in bias of VBS performance evaluation with increasing number of solvers used to compute VBS. The yaxis is a measure of bias defined as the ratio between VBS⇤ and VBS bootstrap sample performance estimates. For a given instance in a bootstrap sample of k solvers, VBS performance is computed as the minimum of a single random sample from each of k - 1 randomly sampled solvers and the solver with best expected performance. Boundaries of box plots represent the 25 and 75 percentiles of the bootstrap samples.
Figure 6 demonstrates how VBS bias decreases as we average performance over more runs. The y-axis indicates the ratio between PAR10 performance estimates of the VBS⇤ and VBS procedures. Note that we see less bias as we restrict ourselves to fewer randomized solvers (here: 3) than found in our full datasets.
4 Conclusions and FutureWork
In this work, we have demonstrated that a traditional, widely used approach for estimating the performance of a so-called Virtual Best Solver (VBS) is optimistically biased in the presence of randomized solvers. We established this fact analytically and demonstrated empirically that the problem arises in practice. Employing bootstrap sampling to quantify uncertainty in our estimates, we showed that substantial bias arises on the Random SAT+UNSAT dataset and on the sgen instances from the Hard-combinatorial SAT+UNSAT dataset of the SAT competition, and that this bias increases with the number of randomized solvers. We also showed that an asymptotically unbiased estimate of VBS performance can be calculated by repeatedly sampling solver running time on each instance, and demonstrated how bias decreases with the number of such samples. We hope that our findings will prompt researchers to change their thinking regarding the gap between (biased estimates of) VBS performance and the performance of portfolio-based algorithm selectors. Our results clearly indicate that this gap originates at least in part from the bias inherent in traditional VBS performance estimates rather than entirely from systematic shortcomings of algorithm selection methods.
It is worth commenting briefly on parallel algorithm portfolios. In such settings, selection techniques are still applicable when the number of candidate solvers exceeds the number of CPU cores. The VBS bias we have identified will still arise in such settings but to a lesser extent, due to the VBS being defined in terms of a larger set of solvers.
In future work, it would be worthwhile to quantify the size of this effect for other realistic scenarios. Furthermore, it would be interesting to examine in detail how close the performance of state-of-the-art algorithm selectors, such as SATzilla or CSHC, is to that of unbiased estimates of VBS performance, and hence how much room for improvement still remains for research attempting to improve upon the algorithm selection techniques used in these systems.
Acknowledgements
This work was supported by Compute Canada through the use of the Westgrid cluster Orcinus, by an NSERC Steacie Fellowship, and by two NSERC Discovery Grants.
@inproceedings{ijcai2016p107,
  title     = {Bias in Algorithm Portfolio Performance Evaluation},
  author    = {Cameron, Chris and Hoos, Holger H. and Leyton-Brown, Kevin},
  booktitle = {Proceedings of the Twenty-Fifth International Joint Conference on
               Artificial Intelligence, {IJCAI-16}},
  publisher = {AAAI Press / International Joint Conferences on Artificial Intelligence},
  editor    = {Subbarao Kambhampati},
  pages     = {712--718},
  year      = {2016},
  month     = {7},
  url       = {https://ijcai.org/proceedings/2016/107},
}
TY - CPAPER TI - Bias in Algorithm Portfolio Performance Evaluation AU - Cameron, Chris AU - Hoos, Holger H. AU - Leyton-Brown, Kevin T2 - Proceedings of the Twenty-Fifth International Joint Conference on Artificial Intelligence, IJCAI-16 PB - AAAI Press / International Joint Conferences on Artificial Intelligence PY - 2016 SP - 712 EP - 718 UR - https://ijcai.org/proceedings/2016/107 ER -Copied
Machine-readable versions of this paper, for tools and AI agents:





