
DeepSchema: Automatic Schema Acquisition from Wearable Sensor Data in Restaurant Situations
Proceedings of the Twenty-Fifth International Joint Conference on Artificial Intelligence. Pages 834-839.
Abstract
We explore the possibility of automatically constructing hierarchical schemas from low-level sensory data. Here we suggest a hierarchical event network to build the hierarchical schemas and describe a novel machine learning method to learn the network from the data. The traditional methods for describing schemas define the primitives and the relationships between them in advance. Therefore, it is difficult to adapt the constructed schemas in new situations. However, the proposed method constructs the schemas automatically from the data. Therefore, it has a novelty that the constructed schemas can be applied to new and unexpected situations flexibly. The key idea of constructing the hierarchical schema is selecting informative sensory data, integrating them sequentially and extracting high-level information. For the experiments, we collected sensory data using multiple wearable devices in restaurant situations. The experimental results demonstrate the real hierarchical schemas, which are probabilistic scripts and action primitives, constructed from the methods. Also, we show the constructed schemas can be used to predict the corresponding event to the low-level sensor data. Moreover, we show the prediction accuracy outperforms the conventional method significantly.
- [Abelson and Schank, 1977] Robert Abelson and Roger C Schank. Scripts, plans, goals and understanding. An in- quiry into human knowledge structures New Jersey, 10, 1977.
- [Bastien et al., 2012] Frédéric Bastien, Pascal Lamblin, Raz- van Pascanu, James Bergstra, Ian J. Goodfellow, Arnaud Bergeron, Nicolas Bouchard, and Yoshua Bengio. Theano: new features and speed improvements. Deep Learning and Unsupervised Feature Learning NIPS 2012 Workshop, 2012.
- [Critchley, 2002] Hugo D Critchley. Book review: electro- dermal responses: what happens in the brain. The Neuro- scientist, 8(2):132-142, 2002.
- [Dargie, 2009] Waltenegus Dargie. Analysis of time and fre- quency domain features of accelerometer measurements. In Computer Communications and Networks, 2009. IC- CCN 2009. Proceedings of 18th Internatonal Conference on, pages 1-6. IEEE, 2009.
- [Doshi et al., 2015] Jigar Doshi, Zsolt Kira, and Alan Wag- ner. From deep learning to episodic memories: Creating categories of visual experiences. In Proceedings of the Third Annual Conference on Advances in Cognitive Sys- tems ACS, page 15, 2015.
- [Fleureau et al., 2013] Julien Fleureau, Philippe Guillotel, and Izabela Orlac. Affective benchmarking of movies based on the physiological responses of a real audience. In Affective Computing and Intelligent Interaction (ACII), 2013 Humaine Association Conference on, pages 73-78. IEEE, 2013.
- [Freund and Haussler, 1994] Yoav Freund and David Haus- sler. Unsupervised learning of distributions of binary vec- tors using two layer networks. Computer Research Labo- ratory [University of California, Santa Cruz], 1994.
- [Hinton, 2010] Geoffrey Hinton. A practical guide to train- ing restricted boltzmann machines. Momentum, 9(1):926, 2010.
- [Körding and Tenenbaum, 2006] Konrad P Körding and Joshua B Tenenbaum. Causal inference in sensorimotor integration. In Advances in neural information processing systems, pages 737-744, 2006.
- [Newell et al., 1956] Allen Newell, Herbert Simon, et al. The logic theory machine-a complex information process- ing system. Information Theory, IRE Transactions on, 2(3):61-79, 1956.
- [Newell et al., 1957] Allen Newell, John Clark Shaw, and Herbert Alexander Simon. Empirical explorations of the logic theory machine: a case study in heuristic. In Papers presented at the February 26-28, 1957, western joint com- puter conference: Techniques for reliability, pages 218- 230. ACM, 1957.
- [Peper et al., 2007] Erik Peper, Rick Harvey, I-Mei Lin, Hana Tylova, and Donald Moss. Is there more to blood volume pulse than heart rate variability, respiratory sinus arrhythmia, and cardiorespiratory synchrony? Biofeed- back, 35(2), 2007.
- [Sano and Picard, 2013] Akane Sano and Rosalind W Pi- card. Recognition of sleep dependent memory consol- idation with multi-modal sensor data. In Body Sensor Networks (BSN), 2013 IEEE International Conference on, pages 1-4. IEEE, 2013.
- [Subramanya et al., 2012] Amarnag Subramanya, Alvin Raj, Jeff A Bilmes, and Dieter Fox. Recognizing activities and spatial context using wearable sensors. arXiv preprint arXiv:1206.6869, 2012.
- [Trommershauser et al., 2011] Julia Trommershauser, Kon- rad Kording, and Michael S Landy. Sensory cue integra- tion. Oxford University Press, USA, 2011.
References were extracted automatically from the PDF and may contain errors.
Full text extracted automatically from the PDF; figures, tables and equations may differ. The PDF is the version of record.
1 Introduction
From the early years of artificial intelligence research, representing human knowledge to make machines and agents understand that knowledge has been a critical research topic. From weak problem-solving methods of Newell and Simon in 1950s [Newell et al., 1956; 1957], there have been various researches to find the regularity of the human knowledge and to represent the knowledge structure in formal language. The main idea of these researches is to define primitives of the knowledge structure and relationships between them in advance. As an illustrative example, we can think about the SCRIPT [Abelson and Schank, 1977]. The SCRIPT, which is designed by Schank et al. in 1977, is a structured representation describing a stereotyped sequence of events in a particular context. The primitives of the SCRIPT is conceptual dependency theory which models the semantic of natural language in formal language. The conceptual dependency theory has four primitives where the meaning of world is built from and the conceptual dependency relationships between these primitives to describe the grammar of meaningful semantic relationships. Based on the conceptual dependency theory, human knowledge about the restaurant situations can be described as in Figure 1. For the sake of the predefined structure, conventional methods can reduce ambiguity and capture the high-level knowledge structures, thus can infer richer interpretations. Nevertheless, as the primitives and the relationships between the primitives should be defined by a human in advance, the conventional knowledge representation systems could not avoid significant drawbacks. First, when facing a new situation and knowledge, it could not process the new knowledge as it was discordant with the existing structure. Second, it is hard to apply conventional systems to real situations because the real situations could be more complicated rather than expected.
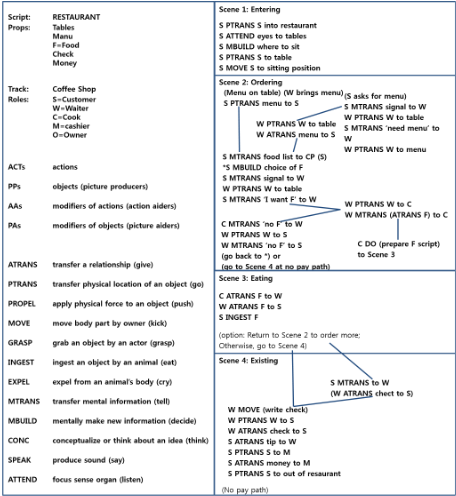
To resolve these problems, we suggest a machine learning method which automatically constructs the hierarchical schema for restaurant situations from low-level sensory data. The hierarchical schema consists of a three-layer hierarchy: action primitives, events and probabilistic scripts. Action primitives combine the low-level sensory data which has multiple streams. The event is a spatio-temporal combination of the action primitives. Finally, the probabilistic script describes a whole situation with the sequence of events.
To construct the hierarchical schema, a newmachine learning algorithm is suggested: Hierarchical event network. Above all, the network constructs the action primitives. The key idea of this step is to selectively integrate the informative sensor streams. This idea is inspired by the sensory cue integration mechanism of humans [K¨ording and Tenenbaum, 2006; Trommershauser et al., 2011]. Following the mechanism, the human gives attention to specific sensory information and combines them. After obtaining the action primitives, the event is constructed with the spatio-temporal combination of the primitives. The probabilistic scripts are the sequence of the events.
For the experiments, we collected multi-modal sensory data while having dinner at a restaurant. To obtain these sensory data, two kinds of wearable devices are used: one is an eye tracker which collects the first-person video and audio signal. The other is a watch-type wearable sensor which collects the users electrodermal activity, blood volume pulse and movement of wrist.
The experimental results mainly show three kinds of results. First, we predict the corresponding event of the input sensor data using action primitives. Second, we show the action primitives constructed from the real data. Lastly, a probabilistic script which is a framework representing the organized patterns of human behavior in restaurant is newly suggested.
The remainder of the paper is organized as follows. In the next section, we describe the restaurant behavior dataset collected from wearable devices in restaurant situations. Then, the hierarchical event network model is suggested in section 3. In the following section, three kinds of experimental results are shown. Finally, in section 5, we conclude with a discussion of future work and possible extensions.
2 Sensory Dataset in Restaurant Situations
To construct the event schema of restaurant situation, we collected sensory data during a meal with wearable devices. In the restaurant situations, the subject is instructed to behave unaffectedly whilst dining. At the same time, two wearable devices are used to collect sensory data of subject, which are a glass-type eye tracker and a watch-type wearable device. In detail, the eye tracker, Glass Smart IR made by Tobii, is embedded with a forward camera and a microphone for collecting first-person video and audio signal. The first-person video and audio signal data from the real, dynamic environment is a novel factor for recognizing real-world perception of a person [Doshi et al., 2015]. The watch-type wearable device, the E4 made by Empatica, is embedded with multiple sensors which measure electrodermal activity, blood volume pulse and movement of wrist. The electrodermal activity (EDA), referred to as skin conductance, provides a sensitive and convenient measure of assessing alterations in sympathetic arousal associated with emotion, attention, and cognition [Critchley, 2002]. Also, changes in the blood volume pulse amplitude reflects cognitive activity of the human [Peper et al., 2007] and movements of the wrist is an important feature for identifying activity and behavioral state of the user [Subramanya et al., 2012].
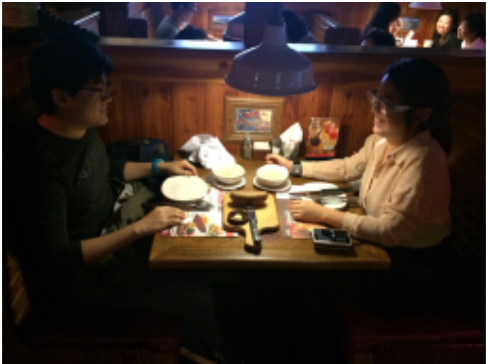
In total, 7 datasets are collected and each dataset is composed of approximately 4000 seconds of 5 heterogeneous stream data: First-person video, audio signal, electrodermal activity, blood volume purse and movement of wrist (3-axis acceleration). Also, each instance of the data is annotated for the situation which the user is in: Greeting, Having a seat, Chatting before ordering, Selecting a menu, Ordering the menu, Serving the menu, Having the meal, Drinking, Calling for staff, Requesting service to staff and Payment.
2.1 Data Preprocessing
Each sensory data stream needs to be preprocessed properly to acquire more informative representation. Also, as the sensory data has temporal characteristic, we concatenated the sensory data which are in the same time interval. We set the size of the time interval to one second. The details of the preprocessing method of each sensory data stream are shown below:
- ÷ First-person video: To process massive vision data effectively and to reduce the data size, we extracted only one image per time interval from the video. Then, we downscaled each image to a size of 80 by 60.
- ÷ Audio signal: As the data collected from real restaurant situations has severe noise, the naive acoustic signal could not be used. On behalf of the acoustic signal, we extracted the textual utterance information. We used the
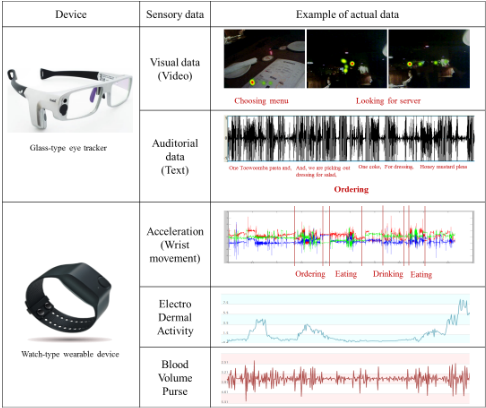
annotated text as the input of the audio modality and also used the time information of the start and end of each utterance. So each 1 second window contains utterances produced in that time interval. Next, the Bag-of-words (BoW) model was used for feature extraction of the utterances and the 4924 dimensions of BoW vectors were acquired.
Even though the annotation work is tiresome, we expect this step could be replaced by denoising and speech recognition techniques.
- ÷ 3-axis acceleration: Because of the robustness of frequency domain features of the accelerometer measurement [Dargie, 2009], we used the short time fourier transform (STFT), which is computed by dividing the sensor measurements into several overlapping windows and applying fourier transform to each windows. The squared length of acceleration vector is used to STFT and to maximize the frequency resolution, we carried out frequency normalization using a hamming window. The final extracted feature vector is a 129 dimensions magnitude vector of normalized coefficient of STFT.
- ÷ Electrodermal activity: The key information of the electrodermal activity is a fast increasing step, which is affected by emotional impact [Fleureau et al., 2013]. So, we first normalized the amplitude of the EDA by dividing all values by the maximum amplitude, obtained the first derivative of the normalized EDA, then determined where the slope has positive value. Using this, we counted the positive values in the window and also computed the mean, standard deviation and median of
- the normalized EDA amplitude.[Sano and Picard, 2013]
- ÷ Blood volume pulse: As we described above, changes of the amplitude of the blood volume pulse is the meaningful value for representation. Also, it could be a convenient measure of hear rate variability, which is a large part of heart rate analysis. To acquire a more informative representation, we calculated the average, maximum, minimum and standard deviation values of normalized amplitudes of Blood volume pulse in window and also obtained frequency domain with STFT to imply the property of heart rate variability. The final extracted feature vector is an 133 dimensions vector composed of the average, maximum, minimum, standard deviation of the amplitudes and magnitudes of the normalized coefficients of STFT.
3 Model: Hierarchical Event Network
In this section, we describe the hierarchical event network which construct hierarchical schemas.
The hierarchical event network has a three-layer structure, which consists of the multi-modal sensory data (input), action units, and event. The lowest layer represents the five kinds of sensory data of each time step (a second) as described in the previous section. In the above layer, the multi-modal sensory data streams are integrated into action units. Finally, in the highest layer, the spatio-temporal combination of actions units forms an event. The overall architecture of the model is described in Figure 4.
3.1 Lower Layer: Extracting the Action Units
As the sensory data is from the real environment, it could contain unexpected noise and to get more abstract information from low-level sensor data, we extracted characteristic feature vectors of each modality respectively. To do this, one more layer, which has an RBM structure, is added to the input (the sensory data). From the single layer RBMs, each feature vectors are learned to represent the abstract information of the data [Freund and Haussler, 1994; Hinton, 2010].
Let us define the five kinds of low-level sensory data, which are the first-person video signal, auditorial signal, accelerometer signal, electrodermal signal and blood volume pulse signal in a time step, as V, T, A, E and B respectively. Each dimension of the sensory data is nv, nt, na, ne and nb respectively.
After learning the single layer RBMs, we can obtain the abstracted feature vectors of the low-level sensor data. We define the abstracted vectors as xv, xt, xa, xe and xb.
The main idea of integrating the feature vectors to get the action units is selecting a small number of feature vectors according to the correlation. After selecting essential modalities, only the selected feature vectors are integrated into action units.
This idea is inspired by the sensory cue integration framework [K¨ording and Tenenbaum, 2006; Trommershauser et al., 2011]. Sensory cue integration framework mimics the way humans perceives multi-modal sensory signals and integrates the signal selectively. This approach has the advantage of not only reducing computational complexity, but ignoring unrelated sensory signal or noisy signal. The suggested model in this paper applies the idea of selecting small number of modalities and integrating only those data by imposing switch units between input layer and action unit layers.
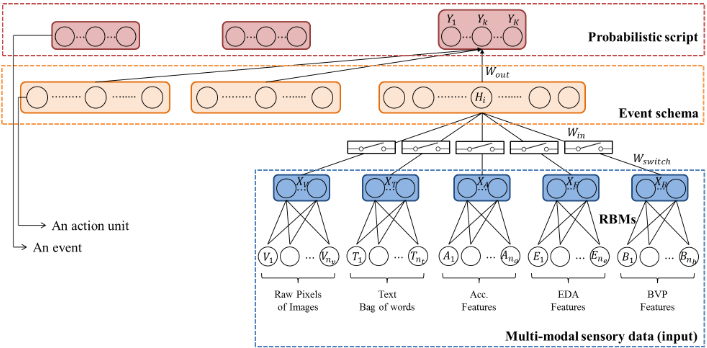
Each feature vector is connected to a switch which determines whether the vector would be combined to construct an action unit or not. If the vector is determined to be combined, the switch values for the units would be (almost) 1. Then the selected feature vectors are linearly summed according to the weight values. There are two groups of parameters of the model. One is the parameters for the switches which are the weight values wsw↪m and the bias bsw↪m determining the activation of the switch. The other one is weight values wkm for combining the selected feature vectors and the bias bkm for this.
3.2 Upper Layer: Sequential Integration
The upper layer, the action units are temporally combined to form an event. To resolve this, we simply adopt a new weight matrix wout which combines action units in time interval tw.
3.3 LearningMethods
Even though there are many notations for describing the model, the main idea is quite simple. The feature vectors are selectively combined by the values of the switch connected to the vectors. At this point, the switch values are determined by the overall combinations of the feature vectors X. (That means, a X is a concatenated vector of the feature vectors, xv, xt, xa, xe and xh.) After determining the switch values, a small number of the feature vectors xm are selected and combined by corresponding weight values wm.
To make the explanation clear, here, we describe the learning rule of the lower layer.
The objective function of the learning is reducing the cross entropy between the output of the model and the label. As the sensory data is annotated with event class labels, the output of the model can be compared with the event label.
Let us define the output of the models as y, and the label as t. As the number of labels are 11, y and t are designed as 11-dimensional binary vectors.
The output value of the k-th element of y of n-th datum yn↪k is defined by Equation 1. In this equation, sm is a switch of the action unit m, wkm is a weight vector connecting the action unit xm to yk and bkm is a bias term. Also, sm is determined by Equation 2 and um is a weight vector connecting overall combinations of the action values X and switch sm. And am is a bias term.
With these definitions, the cross entropy between the output of the model and the label are defined as (Eqation 3).
Using Chain rule, the gradient for parameters, wkm, um, bkm and am, can be calculated as below.
Using these gradients, the parameters wkm, um, bkm and am are updated as follow.
4 Experimental Results
In this section, we show three kinds of experimental results. First of all, the constructed event schemas are used to predict the corresponding events. From the prediction accuracy, the usefulness of the high-level knowledge representation, i.e. event schemas, is verified. For the second experiments, the representative event schemas of each event class are shown. Lastly, a probabilistic script which is a framework representing the organized patterns of human behavior in restaurant is newly suggested.
The suggested model is implemented with Theano framework [Bastien et al., 2012].
4.1 Event Prediction with Schemas
First, we tried to verify whether the schemas have discriminative power to classify the corresponding event. After learning the hierarchical event network with separated training data, the corresponding events of the test data are predicted with the output value of the network.
It is important to emphasize that all of the experiments we conducted were based on real data collected in actual restaurant situations. In addition, all of the prediction accuracies we presented are results from the test data set which was not used in the training phase. Due to the huge size of the data set, we did not used cross validation but instead randomly divided and assigned the data set into training or test set.
Various experiments under different conditions are conducted and the results are summarized in Figure 5.
From the comparison with well-known machine learning algorithms, the outperforming prediction performance of the suggested method is shown. The reason of this result may by virtue of the ability of the suggested method which can control the data invariance problem. Because the dataset is collected from real situations, the variance between the number of data of each event class is relatively high. So, the prediction results of SVM(75.8) and Logistic regression are skewed to a specific class (Having meal event).
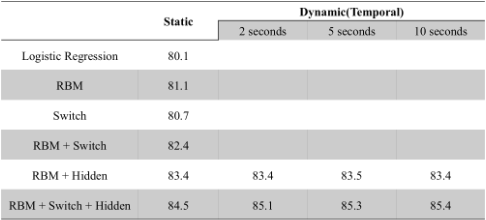
Overall, the best prediction accuracy is obtained from temporal model with RBM, Switch and Hidden. This result is due to the fact that the incoming sensory data stream is highly correlated with previous one and this property can be captured by the temporal model. Also, it can be thought that the RBM and action primitives modules help to extract schemas which contain information robust to noise. Finally, the switch modules helps to remove less informative or irrelevant input modalities.
4.2 Action Primitives for Restaurant Situations
We defined the event schema for restaurant situations as the spatio-temporal combinations of action units. With the hierarchical event network, the event schema can be constructed from the sequences of hidden layer values.
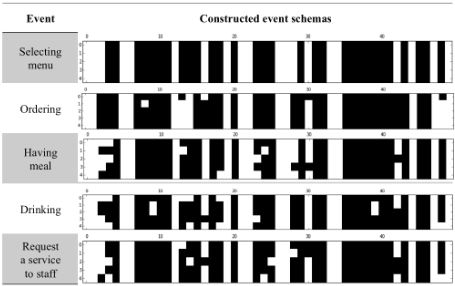
We extract the most informative event schemas of each event class. The event schemas are selected according to mutual information value between the schema and the event label. The extracted schemas are visualized in Figure 6.
As the network takes five different signals as input and only a small number of signals among the five are selected by switch values, useful features change over time or event types. For example, in Figure 6, hand movement features are more useful for Having meal, Request a service to staff classes. And visual features are useful for most of the event types.
4.3 Probabilistic Scripts for Restaurant Situations
As a rediscovery of the traditional artificial intelligence, a new SCRIPT is defined using the hierarchical event network.
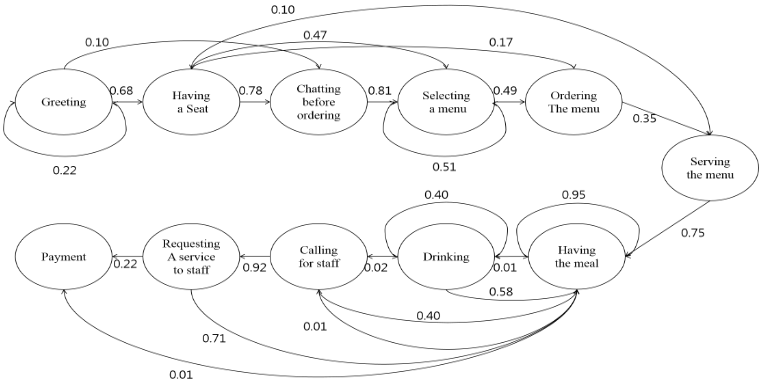
Event sequences of restaurant situations can be generated using the output of the hierarchical event network as the lowlevel sensory data stream comes in. From these generated event sequences, the state transition diagram can be constructed (Fig 7). This diagram represents the organized pattern of the human behavior in restaurant situations. We defined this diagram as a probabilistic script.
There is a thread of connections between the flows of the probabilistic script and the traditional SCRIPTs (Fig 1). From both of the scripts, we can see the general patterns which often occur in real restaurant situation. Interestingly, we can notice that the probabilistic scripts are automatically constructed from data. Also, compared with the SCRIPT, the proposed method can generate various SCRIPT based on the current sensor data of the user.
5 Conclusion
We have presented a DeepSchema which consists of three kinds of schemas.
As the primitives, we extracted action primitives from the sensor data. Then, we temporally combined the action primitives to form the event. Finally, as the highest-level schema, the probabilistic scripts are shown and compared with the traditional knowledge representation algorithm, SCRIPTs.
The main contribution of this paper is that the hierarchical schemas, i.e. DeepSchema, are acquired automatically using the hierarchical event network model. As the schemas are constructed automatically from data, there is novelty that the schemas can be easily applied to a new situation or data.
Furthermore, there is an interesting point that the result from the suggested method, which uses recent machine learning algorithms, is analogous to traditional methods.
By taking the advantages of the suggested methods, we are considering to construct the event schemas for other situations with the same model. We expect that these schemas can help to understand the human behavior, in context with the situations.
Acknowledgments
The authors thank Jiseob Kim for insightful comments and discussion. This work was partly supported by the Institute for Information & Communications Technology Promotion (R0126-16-1072-SW.StarLab) and Korea Evaluation Institute of Industrial Technology (10044009-HRI.MESSI, 10060086RISF) grant funded by the Korea government (MSIP).
@inproceedings{ijcai2016p123,
  title     = {DeepSchema: Automatic Schema Acquisition from Wearable Sensor Data in Restaurant Situations},
  author    = {Kim, Eun-Sol and On, Kyoung-Woon and Zhang, Byoung-Tak},
  booktitle = {Proceedings of the Twenty-Fifth International Joint Conference on
               Artificial Intelligence, {IJCAI-16}},
  publisher = {AAAI Press / International Joint Conferences on Artificial Intelligence},
  editor    = {Subbarao Kambhampati},
  pages     = {834--839},
  year      = {2016},
  month     = {7},
  url       = {https://ijcai.org/proceedings/2016/123},
}
TY - CPAPER TI - DeepSchema: Automatic Schema Acquisition from Wearable Sensor Data in Restaurant Situations AU - Kim, Eun-Sol AU - On, Kyoung-Woon AU - Zhang, Byoung-Tak T2 - Proceedings of the Twenty-Fifth International Joint Conference on Artificial Intelligence, IJCAI-16 PB - AAAI Press / International Joint Conferences on Artificial Intelligence PY - 2016 SP - 834 EP - 839 UR - https://ijcai.org/proceedings/2016/123 ER -Copied
Machine-readable versions of this paper, for tools and AI agents:





