
Driver Frustration Detection from Audio and Video in the Wild
Proceedings of the Twenty-Fifth International Joint Conference on Artificial Intelligence. Pages 1354-1359.
Abstract
We present a method for detecting driver frustration from both video and audio streams captured during the driver's interaction with an in-vehicle voice-based navigation system. The video is of the driver's face when the machine is speaking, and the audio is of the driver's voice when he or she is speaking. We analyze a dataset of 20 drivers that contains 596 audio epochs (audio clips, with duration from 1 sec to 15 sec) and 615 video epochs (video clips, with duration from 1 sec to 45 sec). The dataset is balanced across 2 age groups, 2 vehicle systems, and both genders. The model was subject-independently trained and tested using 4-fold cross-validation. We achieve an accuracy of 77.4% for detecting frustration from a single audio epoch and 81.2% for detecting frustration from a single video epoch. We then treat the video and audio epochs as a sequence of interactions and use decision fusion to characterize the trade-off between decision time and classification accuracy, which improved the prediction accuracy to 88.5% after 9 epochs.
- [Boril et al., 2010] Hynek Boril, Seyed Omid Sadjadi, Tris- tan Kleinschmidt, and John HL Hansen. Analysis and de- tection of cognitive load and frustration in drivers' speech. Proceedings of INTERSPEECH 2010, pages 502-505, 2010.
- [Ekman and Friesen, 1977] Paul Ekman and Wallace V Friesen. Facial action coding system. 1977.
- [Eyben et al., 2010] Florian Eyben, Martin Wöllmer, Tony Poitschke, Björn Schuller, Christoph Blaschke, Berthold Färber, and Nhu Nguyen-Thien. Emotion on the Road - Necessity, Acceptance, and Feasibility of Affective Com- puting in the Car. Advances in Human Computer Interac- tion, Special Issue on Emotion-Aware Natural Interaction, 2010(Article ID 263593), 2010. 17 pages. Eyben et al., 2013] Florian Eyben, Felix Weninger, Florian Groß, and Björn Schuller. Recent Developments in openS- MILE, the Munich Open-Source Multimedia Feature Ex- tractor. In Proceedings of the 21st ACM International Conference on Multimedia, MM 2013, pages 835-838, Barcelona, Spain, October 2013. ACM, ACM.
- [Eyben et al., 2015] Florian Eyben, Klaus Scherer, Björn Schuller, Johan Sundberg, Elisabeth André, Carlos Busso, Laurence Devillers, Julien Epps, Petri Laukka, Shrikanth Narayanan, and Khiet Truong. The Geneva Minimalis- tic Acoustic Parameter Set (GeMAPS) for Voice Research and Affective Computing. IEEE Transactions on Affective Computing, 2015.
- [Fernandez and Picard, 1998] Raul Fernandez and Ros- alind W Picard. Signal processing for recognition of hu- man frustration. In Acoustics, Speech and Signal Pro- cessing, 1998. Proceedings of the 1998 IEEE International Conference on, volume 6, pages 3773-3776. IEEE, 1998.
- Fridman et al., 2016 In Press] Lex Fridman, Joonbum Lee, Bryan Reimer, and Trent Victor. Owl and lizard: Patterns of head pose and eye pose in driver gaze classification. IET Computer Vision, 2016, In Press.
- [Grimm et al., 2007] Michael Grimm, Kristian Kroschel, Helen Harris, Clifford Nass, Björn Schuller, Gerhard Rigoll, and Tobias Moosmayr. On the necessity and feasi- bility of detecting a driver's emotional state while driving. In Lecture Notes on Computer Science (LNCS), volume 4738, pages 126-138, Berlin, Germany, 2007. Springer.
- [Hall et al., 2009] Mark Hall, Eibe Frank, Geoffrey Holmes, Bernhard Pfahringer, Peter Reutemann, and Ian H Witten. The weka data mining software: an update. ACM SIGKDD explorations newsletter, 11(1):10-18, 2009.
- [Hassenzahl, 2004] Marc Hassenzahl. Emotions can be quite ephemeral; we cannot design them. interactions, 11(5):46-48, 2004.
- [Hoque et al., 2012] Mohammed Ehsan Hoque, Daniel J McDuff, and Rosalind W Picard. Exploring temporal pat- terns in classifying frustrated and delighted smiles. Af- fective Computing, IEEE Transactions on, 3(3):323-334, 2012.
- [Kappas and Krämer, 2011] Arvid Kappas and Nicole C Krämer. Face-to-face communication over the Internet: emotions in a web of culture, language, and technology. Cambridge University Press, 2011.
- [Karegowda et al., 2010] Asha Gowda Karegowda, AS Manjunath, and MA Jayaram. Comparative study of attribute selection using gain ratio and correlation based feature selection. International Journal of Information Technology and Knowledge Management, 2(2):271-277, 2010.
- [Kuncheva, 2002] Ludmila I Kuncheva. A theoretical study on six classifier fusion strategies. IEEE Transactions on Pattern Analysis & Machine Intelligence, (2):281-286, 2002.
- [Mahlke, 2005] Sascha Mahlke. Understanding users' ex- perience of interaction. In Proceedings of the 2005 an- nual conference on European association of cognitive er- gonomics, pages 251-254. University of Athens, 2005.
- [Mehler et al., 2015] Bruce Mehler, David Kidd, Bryan Reimer, Ian Reagan, Jonathan Dobres, and Anne McCartt. Multi-modal assessment of on-road demand of voice and manual phone calling and voice navigation entry across two embedded vehicle systems. Ergonomics, pages 1-24, 2015. PMID: 26269281.
- [NHTSA, 2013] NHTSA. Visual-manual nhtsa driver distraction guidelines for in-vehicle electronic devices (docket no. nhtsa-2010-0053). Washington, DC: US Department of Transportation National Highway Traffic Safety Administration (NHTSA), 2013.
- [Pantic et al., 2005] Maja Pantic, Nicu Sebe, Jeffrey F Cohn, and Thomas Huang. Affective multimodal human- computer interaction. In Proceedings of the 13th annual ACM international conference on Multimedia, pages 669- 676. ACM, 2005.
- [Picard, 1997] Rosalind W Picard. Affective computing, vol- ume 252. MIT press Cambridge, 1997.
- [Picard, 1999] Rosalind W Picard. Affective computing for hci. In HCI (1), pages 829-833, 1999.
- [Schuller et al., 2013] Björn Schuller, Stefan Steidl, Anton Batliner, Alessandro Vinciarelli, Klaus Scherer, Fabien Ringeval, Mohamed Chetouani, Felix Weninger, Flo- rian Eyben, Erik Marchi, Marcello Mortillaro, Hugues Salamin, Anna Polychroniou, Fabio Valente, and Samuel Kim. The INTERSPEECH 2013 Computational Paralin- guistics Challenge: Social Signals, Conflict, Emotion, Autism. In Proceedings INTERSPEECH 2013, 14th An- nual Conference of the International Speech Communi- cation Association, Lyon, France, August 2013. ISCA, ISCA. 5 pages.
- [Senechal et al., 2015] Thibaud Senechal, Daniel McDuff, and Rana Kaliouby. Facial action unit detection using ac- tive learning and an efficient non-linear kernel approxima- tion. In Proceedings of the IEEE International Conference on Computer Vision Workshops, pages 10-18, 2015.
- [Stevens et al., 2002] A. Stevens, A. Quimby, A. Board, T. Kersloot, and P. Burns. Design guidelines for safety of in-vehicle information systems. TRL Limited, 2002.
- [Viola and Jones, 2004] Paul Viola and Michael J Jones. Ro- bust real-time face detection. International journal of com- puter vision, 57(2):137-154, 2004.
- [Zeng et al., 2009] Zhihong Zeng, Maja Pantic, Glenn Ro- isman, and Thomas S Huang. A survey of affect recogni- tion methods: Audio, visual, and spontaneous expressions. Pattern Analysis and Machine Intelligence, IEEE Transac- tions on, 31(1):39-58, 2009.
References were extracted automatically from the PDF and may contain errors.
Full text extracted automatically from the PDF; figures, tables and equations may differ. The PDF is the version of record.
1 Introduction
The question of how to design an interface in order to maximize driver safety has been extensively studied over the past two decades [Stevens et al., 2002]. Numerous publications seek to aid designers in the creation of in-vehicle interfaces that limit demands placed upon the driver [NHTSA, 2013]. As such, these efforts aim to improve the likelihood of driver's to multi-task safely. Evaluation questions usually take the form of "Is HCI system A better than HCI system B, and why?". Rarely do applied evaluations of vehicle systems consider the emotional state of the driver as a component of demand that is quantified during system prove out, despite of numerous studies that show the importance of affect and emotions in hedonics and aestetics to improve user experience [Mahlke, 2005].
The work in this paper is motivated by a vision for an adaptive system that is able to detect the emotional response of the driver and adapt, in order to aid driving performance. The critical component of this vision is the detection of emotion in the interaction of the human driver with the driver vehicle interface (DVI) system. We focus on the specific affective state of "frustration" as self-reported by the driver in response to voice-based navigation tasks (both entry and cancellation of the route) completed while underway. We then propose a method for detecting frustration from the video of the driver's face when he or she is listening to system feedback and the audio of the driver's voice when he or she is speaking to the system.




Figure 1: Representative video snapshots from voice navigation interface interaction for two subjects. The subject (a) self-reported as not frustrated with the interaction and the (b) subject self-reported as frustrated. In this paper, we refer to subjects in the former category as "satisfied" and the latter category as "frustrated." As seen in the images, the "satisfied" interaction is relatively emotionless, and the "frustrated" interaction is full of affective facial actions.
We consider the binary classification problem of a "frustrated" driver versus a "satisfied" driver annotated based on a self-reported answer to the following question: "To what extent did you feel frustrated using the car voice navigation interface?" The answers were on a scale of 1 to 10 and naturally clustered into two partitions as discussed in §3.2. Representative examples from a "satisfied" and a "frustrated" driver are shown in Fig. 1. As the question suggests, these affective categories refer not to the general emotional state of the driver but to their opinion of the interaction with an in-vehicle technology. It is interesting to note that smiling was a common response for a "frustrated" driver. This is consistent with previous research that found smiles can appear in situations when people are genuinely frustrated [Hoque et al., 2012]. The reason for these smiles may be that the voice-based interaction was "lost-in-translation" and this was in part entertaining. Without contextual understanding, an observer of short clip might label the emotional state as momentarily happy. However, over the context of an entire interaction the obvious label becomes one of "frustrated". Thus, detecting driver frustration is challenging because it is expressed through a complex combination of actions and reactions as observed throughout facial expressions and qualities in one's speech.
2 RelatedWork
Affective computing, or the detection and consideration of human affective states to improve HCI, was introduced two decades ago [Picard, 1997]. Context-sensitive intelligent systems have increasingly become a part of our lives in, and outside, of the driving context [Pantic et al., 2005]. And while detection of emotion from audio and video has been extensively studied [Zeng et al., 2009], it has not received much attention in the context of driving where research has focused to a large extent on characterization and detection of distraction and drowsiness. Our work takes steps toward bridging the gap between affective computing research and applied driving research for DVI evaluation and real-time advanced driver assistance systems (ADAS) development.
The first automated system for detecting frustration via multiple signals were proposed by [Fernandez and Picard, 1998]. Most of the subsequent studies over the past decade have been examining affect and emotion in HCI with an aim to reduce the user's frustration while interacting with the computer. In many cases "violent and abusive" behavior toward computers has been reported [Kappas and Kr¨amer, 2011]. Affective computing is relevant to HCI in a number of ways. Four broad areas of interest are: (1) reducing user frustration; (2) enabling comfortable communication of user emotion; (3) developing infrastructure and applications to handle affective information; and, (4) building tools that help develop social-emotional skills [Picard, 1999]. It has been emphasized that for the successful design of future HCI systems the "emotional design" has to explore the interplay of cognition and emotion, rather than dismissing cognition entirely [Hassenzahl, 2004].
The face is one of the richest channels for communicating information about one's internal state. The facial action coding system (FACS) [Ekman and Friesen, 1977] is the most widely used and comprehensive taxonomy of facial behavior. Automated software provides a consistent and scalable method of coding FACS. The facial actions, and combinations of actions, have associations with different emotional states and levels of emotional valence. For example, lip depressing (AU15 - frowning) typically is associated with negative valence and states such as sadness or fear.
The audio stream is a rich source of information and the literature shows its importance in the domain of in-car affect recognition [Eyben et al., 2010]. In fact, for the recognition of driver states like anger, irritation, or nervousness, the audio stream is particularly valuable [Grimm et al., 2007]. This is not surprising considering how strongly anger is correlated to simple speech features like volume (and energy respectively) or pitch.
The task of detecting drivers' frustration has been researched in the past [Boril et al., 2010]. Boril et al. exploited the audio stream of the drivers' speech and discriminated "neutral" and "negative" emotions with 81.3% accuracy (measured in Equal Accuracy Rate - EAR) across 68 subjects. This work used SVMs to discriminate between classes. The ground truth came from one annotation sequence. A "humored" state was presented as one of the 5 "neutral" (non-negative) emotions. This partitioning of emotion contradicts our findings that smiling and humor are often part of the response by frustrated subject. Therefore, an external annotator may be tempted to label a smiling subject as not frustrated, when in fact, the smile may be one of the strongest indicators of frustration, especially in the driving context.
Contributions We extend this prior work by (1) leveraging audiovisual data collected under real driving conditions, (2) using self-reported rating of the frustration for data annotation, (3) fusing audio and video as complimentary data sources, and (4) fusing audio and video streams across time in order to characterize the trade-off between decision time and classification accuracy. We believe that this work is the first to address the task of detecting self-reported frustration under real driving conditions.
3 Dataset Collection and Analysis
3.1 Data Collection
The dataset used for frustration detection was collected as part of a study for multi-modal assessment of on-road demand of voice and manual phone calling and voice navigation entry across two embedded vehicle systems [Mehler et al., 2015]. Participants drove one of two standard production vehicles, a 2013 Chevrolet Equinox (Chevy) equipped with the MyLink system and a 2013 Volvo XC60 (Volvo) equipped with the Sensus system.
The full study dataset is composed of 80 subjects that fully met the selection criteria as detailed in [Mehler et al., 2015], equally balanced across two vehicles by gender (male, female) and four age groups (18-24, 25-39, 40-54, 55 and older). In the original study, each subject had to accomplish three tasks: (1) entering an address into the navigation system, (2) making a call via manual control, (3) making a call via voice control. It is important to note that all subjects drove the same route and all tasks from Table 1 were performed while driving. For this paper, we focused in on the navigation task, but mention the other tasks to provide a broader context for the dataset used in this work. After each task, subjects completed a short written survey in which they self-reported the workload and rated an accomplished task, including their frustration level on a scale from 1 to 10, with 1 being "not at all" and 10 "very". The question that the subjects were asked to answer is as follows: "To what extent did you feel frustrated using the car voice navigation system?".
3.2 Dataset for Detecting Frustration
We found that the navigation system task had a clustering of responses for self-reported frustration that naturally fell into two obvious classes, after removing the minority of "neutral" responses with self-reported frustration level from 4 to 6. The "frustrated" class contained all subjects with self-reported frustration level between 7 and 9, and "satisfied" class contained all subjects with self-reported frustration level from 1 to 3.
For the frustration detection task we selected 20 subjects from the initial dataset of 80 such that our selection spanned both vehicles and different demographics profiles. This pruning step was made for two reasons. First, a significant amount of videos had poor lighting conditions where extraction of facial expressions was not possible or was very difficult. To address this issue, we discarded subjects where less than 80% of video frames contained a successfully detected face. We applied the face detector described in [Fridman et al., 2016 In Press] that uses a Histogram of Oriented Gradients (HOG) combined with a linear SVM classifier, an image pyramid, and a sliding window detection scheme. Second, a substantially higher proportion of subjects self-reported low frustration level (class "satisfied"), thus we had to select our subjects viligantly to keep the dataset balanced and have both classes represented equally. Although we balanced the dataset in terms of meta data (demographics and number of subjects per class), the number of audio and video clips that represent the HCI (epochs) may vary significantly for both classes throughout all subtasks. There are two obvious reasons that explain this phenomenon: (1) the data has been collected over two different vehicles that offer two distinctive human-computer interfaces, with different number of steps to accomplish the task, and (2) the complexity of subtasks (Table 1) in combination with the familiarity and competence of subjects to use voice-control systems varies significantly, which then consequently determines the number of epochs.
| ID | Subtask Name |
|---|---|
| 1 | 177 Massachusetts Avenue, Cambridge, MA |
| 2 | Cancel navigation |
| 3 | 293 Beacon Street, Boston, MA |
| 4 | Cancel navigation |
| 5 | Enter home address |
| 6 | Cancel navigation |
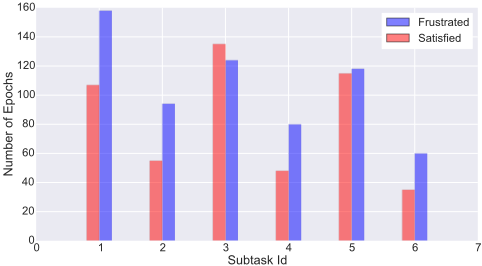
Fig. 2 visualizes the distribution of classes throughout subtasks (Table 1), where epochs relate to the number of audio and video clips. Additionally, it shows that for the majority of subtasks there are more epochs labeled as "frustrated" than "satisfied", which originates from the fact that "frustrated" subjects produced more failed attempts while accomplishing subtasks. It also visualizes a trend of declining epochs as the subtask id increases. This is especially visible when considering subtasks 2, 4, and 6 which are the navigation cancelation subtasks that are similar in terms of difficulty. The average number of epoch required to accomplish these tasks decreases as the subtask id increases. This trend indicates that both the "satisfied" and the "frustrated" subjects were becoming more efficient at using the voice-based system with time.
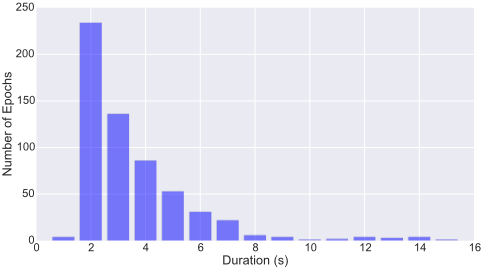
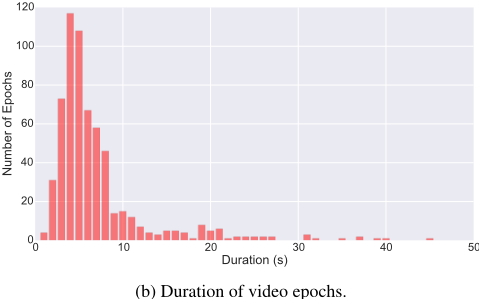
There are two different types of epochs: (1) audio epochs, where subjects are dictating commands to the machine, and (2) video epochs, where subjects are listening to a response from the machine and signaling frustration through various facial movements. The Fig. 3 visualizes the number of epochs by duration (in seconds).
4 Methods
4.1 Audio Features
In contrast to large scale brute-force feature sets [Schuller et al., 2013], a smaller, expert-knowledge based feature set has been applied. In fact, a minimalistic standard parameter set reduces the risk of over-fitting in the training phase as compared to brute-forced large features sets, which in our task is of great interest. Recently, a recommended minimalistic standard parameter set for the acoustic analysis of speaker states and traits has been proposed in [Eyben et al., 2015]. The proposed feature set is the so-called Geneva Minimalistic Acoustic Parameter Set (GeMAPS). Features were mainly selected based on their potential to index affective physiological changes in voice production, for their proven value in former studies, and for their theoretical definition. Acoustic low-level descriptors (LLD) were automatically extracted from the speech waveform on a per-chunk level by using the open-source openSMILE feature extractor in its 2.1 release
(a) Duration of audio epochs.
[Eyben et al., 2013]. A detailed list of the LLD is provided in Table 2.
4.2 Video Features
We used automated facial coding software to extract features from the videos. The software (Affdex - Affectiva, Inc.) has three main components. First, the face is detected using the Viola-Jones method [Viola and Jones, 2004] (OpenCV implementation). Thirty-four facial landmarks are then detected using a supervised descent based landmark detector and an image region of interest (ROI) is segmented. The ROI includes the eyes, eyebrows, nose and mouth. The region of interest is normalized using rotation and scaling to 96x96 pixels. Second, histogram of oriented gradient (HOG) features are extracted from the ROI within each frame. Third, support vector machine classifiers are used to detect the presence of each facial action. Details of how the classifiers were trained and validated can be found in [Senechal et al., 2015]. The facial action classifiers return a confidence score from 0 to 100. The software provided scores for 14 facial actions (see Table 3). In addition to facial actions we used the three axes of head pose and position of the face (left and right eye corners and center of top lip) as observations from which to extract features. For each epoch the mean, standard deviation, minimum and maximum values for each action, head pose and
| 6 frequency related LLD | Group |
|---|---|
| F0 (linear & semi-tone) Jitter (local), Formant 1 (bandwidth) Formants 1, 2, 3 (frequency) Formant 2, 3 (bandwidth) (eGeMAPS) | Prosodic Voice qual. Vowel qual. Voice qual. |
| Alpha ratio (50-1000Hz / 1-5kHz) Hammarberg index | |
| 3 energy/amplitude related LLD | Group |
| Sum of auditory spectrum (loudness) log. HNR, shimmer (local) | Prosodic Voice qual. |
| 9 spectral LLD | |
| Group | |
| Spectral | |
| Spectral | |
| Spectral slope (0-500Hz, 0-1kHz) | Spectral |
| Formants 1, 2, 3 (rel. energy) | Voice qual. |
| Harmonic difference H1-H2, H1-A3 | Voice qual. |
1
2
4
9
10





12
12*
15
17
18





| AU | Action | AU | Action |
|---|---|---|---|
| 1 | Inner Brow Raise | 15 | Lip Depressor |
| 2 | Outer Brow Raise | 17 | Chin Raise |
| 4 | Brow Furrow | 18 | Lip Pucker |
| 9 | Nose Wrinkle | 24 | Lip Press |
| 10 | Upper Lip Raise | 25 | Lips Part |
| 12 | Lip Corner Pull | 28 | Lip Suck |
| 12* | Assym. Lip Cor. Pull | 43 | Eyes Closed |
position metric were calculated to give 60 video features ((14 actions + 3 head pose angles + 3 landmark positions)*4).
24
25
28
43




4.3 Classifier
We used a Weka 3 implementation of Support Vector Machines (SVMs) with the Sequential Minimal Optimization (SMO), and audio and video features described in §4 [Hall et al., 2009]. We describe a set of SMO complexity parameters as:
For each SMO complexity parameter C from (1) we upsampled the feature vectors (one per epoch) from the original datasets to balance the number of epochs per class by calculating the upsampling factors. An average upsampling factor across four folds is 1.03 for the "frustrated" class and 1.24 for the "satisfied" class, details are presented in Table 4. We kept the original datasets, and produced an additional upsampled dataset for further experiments.
| Fold | 1 | 2 | 3 | 4 |
|---|---|---|---|---|
| Factor | ||||
| Factor for "frustrated" | 1.00 | 1.00 | 1.00 | 1.13 |
| Factor for "satisfied" | 1.57 | 1.26 | 1.11 | 1.00 |
We then (a) normalized and (b) standardized both upsampled and original datasets for each SMO complexity parameter C, and obtained 36 different configurations per fold. We carried out 144 experiments across four folds, computed accuracy, and selected the configuration that gave us the best average result. The term "accuracy" stands for Unweighted Average Recall (UAR).
5 Results
We used features and a classifier as described in §4 and achieved an accuracy of 77.4% for "audio" epochs and 81.2% for "video" epochs as presented in Table 5. The epoch type column indicates whether the human or the machine are speaking and data source indicates the source of the signal which is being used for extracting features. The presented results are the average accuracy for the subject-independent cross-validation over four folds.
| Epoch Type | Data Source | C Acc. (%) |
|---|---|---|
| Machine Speaking | Video | 1e-3 81.2 |
| Human Speaking | Audio | 5e-3 77.4 |
In order to characterize the tradeoff between classification accuracy and the duration of the interaction, we fused the predictions from consecutive epochs for both video and audio using a majority vote fusion rule [Kuncheva, 2002]. The interaction of the driver with the voice-based system is a sequence of mostly-alternating epochs of face video data and voice data. In presenting the results, we consider two measures of duration: (1) de is the duration in the number epochs and (2) ds is the duration in the number of seconds. Both measures are important for the evaluation of systems performance, since classifier decisions are made once per epoch (as measured by de) but the driver experiences the interaction in real-time (as measured by ds). In other words, de can be thought of as classifier time and ds can be thought of as human time.
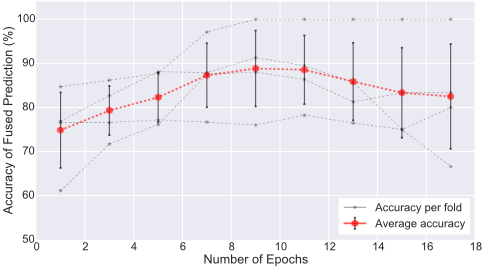
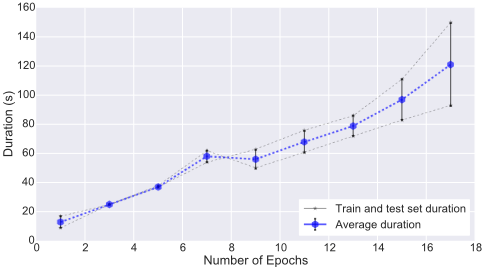
The fused results for up to 17 epochs are presented in Fig. 4 where duration de is used. The average accuracy is shown with the red line and the accuracy for each of the four folds is shown with the gray line. The average accuracy does not monotonically increase with the number of predictions fused. Instead, it slightly fluctuates due to a broad variation in complexity of the underlying subtasks. In Fig. 4 the length of interactions is measured in the number of epochs. In order to reduce practical ambiguity of this tradeoff, we characterize the absolute duration in seconds with respect to the number of epochs in Fig. 5. Grey lines indicate the duration for the train and test sets, whilst the blue line represents the average duration. These two figures allow us to observe that an average accuracy of 88.5% is achieved for an interaction that lasts approximately 1 minute but a lower average accuracy of 82.8% is achieved for an interaction that lasts approximately 2 minutes.
Evaluation over one of the folds in Fig. 4 achieves 100% accuracy after 9 epochs. This is possible due to the fact that the number of epochs for total interaction varies between subjects, and the reported accuracy for a specific duration de is averaged over only the interactions that last at least that long. It follows that with the longer durations de (x-axis), the number of subjects over which the accuracy is averaged decreases and the variance of the accuracy increases.
We used a Weka implementation of the Information Gain (IG) feature evaluation to rank video features [Karegowda et al., 2010]. Then, we grouped features into the feature categories by summing corresponding category IG ranking values for mean, maximum, minimum and standard deviation. Each feature category represents one action, i. e., inner brow rise, nose wrinkle or lip depressor as presented in Table 3. The 5 best discriminating feature categories are: (1) horizontal location of the left eye corner, (2) horizontal location of the top of the mouth, (3) horizontal location of the right eye corner, (4) the angle of head tilt (i.e. rotation of the head about an axis that passes from the back of the head to the front of the head), and (5) smile confidence (on a scale of 0 - 100). We ranked only video features to select the most interesting epochs for our presentation video: http://lexfridman.com/driverfrustration.
6 Conclusion
We presented a method for detecting driver frustration from 615 video epochs and 596 audio epochs captured during the driver's interaction with an in-vehicle voice-based navigation system. The data was captured in a natural driving context. Our method has been evaluated across 20 subjects that span over different demographic parameters and both cars that were used in our study. This method resulted in an accuracy of 81.2% for detecting driver frustration from the video stream and 77.4% from the audio stream. We then treated the video and audio streams as a sequence of interactions and achieved 88.5% accuracy after 9 epochs by using decision fusion. Future work will include additional data streams (i. e., heart rate, skin conductance) and affective annotation methods to augment the self-reported frustration measure.
Acknowledgments
Support for this work was provided by the New England University Transportation Center, and the Toyota Class Action Settlement Safety Research and Education Program. The views and conclusions being expressed are those of the authors, and have not been sponsored, approved, or endorsed by Toyota or plaintiffs class counsel. Data was drawn from studies supported by the Insurance Institute for Highway Safety (IIHS) and Affectiva.
@inproceedings{ijcai2016p195,
  title     = {Driver Frustration Detection from Audio and Video in the Wild},
  author    = {Abdic, Irman and Fridman, Lex and McDuff, Daniel and Marchi, Erik and Reimer, Bryan and Schuller, Björn W.},
  booktitle = {Proceedings of the Twenty-Fifth International Joint Conference on
               Artificial Intelligence, {IJCAI-16}},
  publisher = {AAAI Press / International Joint Conferences on Artificial Intelligence},
  editor    = {Subbarao Kambhampati},
  pages     = {1354--1359},
  year      = {2016},
  month     = {7},
  url       = {https://ijcai.org/proceedings/2016/195},
}
TY - CPAPER TI - Driver Frustration Detection from Audio and Video in the Wild AU - Abdic, Irman AU - Fridman, Lex AU - McDuff, Daniel AU - Marchi, Erik AU - Reimer, Bryan AU - Schuller, Björn W. T2 - Proceedings of the Twenty-Fifth International Joint Conference on Artificial Intelligence, IJCAI-16 PB - AAAI Press / International Joint Conferences on Artificial Intelligence PY - 2016 SP - 1354 EP - 1359 UR - https://ijcai.org/proceedings/2016/195 ER -Copied
Machine-readable versions of this paper, for tools and AI agents:





