
Asymptotic Optimality of Myopic Optimization in Trial-Offer Markets with Social Influence
Proceedings of the Twenty-Fifth International Joint Conference on Artificial Intelligence. Pages 2458-2463.
Abstract
We study dynamic trial-offer markets, in which participants first try a product and later decide whether to purchase it or not. In these markets, social influence and position biases have a greater effect on the decisions taken in the sampling stage than those in the buying stage. We consider a myopic policy that maximizes the market efficiency for each incoming participant, taking into account the inherent quality of products, position biases, and social influence. We prove that this myopic policy is optimal and predictable asymptotically.
- [Abeliuk et al., 2015] A. Abeliuk, G. Berbeglia, M. Cebrian, and P. Van Hentenryck. The benefits of social influence in optimized cultural markets. PLOS ONE, 10(4), 2015.
- [Abeliuk et al., 2016] A. Abeliuk, G. Berbeglia, M. Cebrian, and P. Van Hentenryck. Assortment optimization under a multinomial logit model with position bias and social influence. 4OR, 14(1):57-75, 2016.
- [Aggarwal et al., 2008] Gagan Aggarwal, Jon Feldman, S Muthukrishnan, and Martin Pál. Sponsored search auc- tions with markovian users. In Internet and Network Eco- nomics, pages 621-628. Springer, 2008.
- [Doob, 1953] Joseph L Doob. Stochastic processes, volume 101. New York Wiley, 1953.
- [Ghose et al., 2012] Anindya Ghose, Panagiotis G Ipeirotis, and Beibei Li. Designing ranking systems for hotels on travel search engines by mining user-generated and crowd- sourced content. Marketing Science, 31(3):493-520, 2012.
- [Ghose et al., 2014] Anindya Ghose, Panagiotis G Ipeirotis, and Beibei Li. Examining the impact of ranking on con- sumer behavior and search engine revenue. Management Science, 60(7):1632-1654, 2014.
- [Higueras et al., 2003] I. Higueras, J. Moler, F. Plo, and M. San Miguel. Urn models and differential algebraic equations. Journal of applied probability, pages 401-412, 2003.
- [Hogg and Lerman, 2015] Tad Hogg and Kristina Lerman. Disentagling the effects of social signals. Human Com- putation Journal, 2(2):189-208, 2015.
- [Kempe and Mahdian, 2008] David Kempe and Mohammad Mahdian. A cascade model for externalities in sponsored search. In Internet and Network Economics, pages 585- 596. Springer, 2008.
- [Kleinberg, 2008] Jon Kleinberg. The convergence of social and technological networks. Communications of the ACM, 51(11):66-72, 2008.
- [Krumme et al., 2012] Coco Krumme, Manuel Cebrian, Galen Pickard, and Sandy Pentland. Quantifying so- cial influence in an online cultural market. PloS one, 7(5):e33785, 2012.
- [Lerman and Hogg, 2014] Kristina Lerman and Tad Hogg. Leveraging position bias to improve peer recommenda- tion. PLOS ONE, 9(6):1-8, 2014.
- [Ljung, 1977] Lennart Ljung. Analysis of recursive stochas- tic algorithms. Automatic Control, IEEE Transactions on, 22(4):551-575, 1977.
- [Luce, 1965] D. Luce. Individual Choice Behavior. John Wiley and Sons, 1965. [Muchnik et al., 2013] Lev Muchnik, Sinan Aral, and Sean J. Taylor. Social influence bias: A randomized ex- periment. Science, 341(6146):647-651, 2013.
- [Renlund, 2010] Henrik Renlund. Generalized Polya Urns Via Stochastic Approximation. ArXiv e-prints 1002.3716, February 2010.
- [Salganik and Watts, 2008] Matthew J Salganik and Dun- can J Watts. Leading the herd astray: An experimen- tal study of self-fulfilling prophecies in an artificial cul- tural market. Social Psychology Quarterly, 71(4):338- 355, 2008.
- [Salganik and Watts, 2009] Matthew J Salganik and Dun- can J Watts. Web-based experiments for the study of col- lective social dynamics in cultural markets. Topics in Cog- nitive Science, 1(3):439-468, 2009.
- [Salganik et al., 2006] Matthew J Salganik, Peter Sheridan Dodds, and Duncan J Watts. Experimental study of in- equality and unpredictability in an artificial cultural mar- ket. Science, 311(5762):854-856, 2006.
- [van de Rijt et al., 2014] Arnout van de Rijt, Soong Moon Kang, Michael Restivo, and Akshay Patil. Field experi- ments of success-breeds-success dynamics. Proceedings of the National Academy of Sciences, 111(19):6934-6939, 2014.
- [Van Hentenryck et al., 2016] Pascal Van Hentenryck, Andrés Abeliuk, Franco Berbeglia, Felipe Maldonado, and Gerardo Berbeglia. Aligning popularity and quality in online cultural markets. In Tenth International AAAI Conference on Web and Social Media (ICWSM-16), 2016.
References were extracted automatically from the PDF and may contain errors.
Full text extracted automatically from the PDF; figures, tables and equations may differ. The PDF is the version of record.
1 Introduction
Social influence is ubiquitous in online cultural markets. From book recommendations to song popularities, social influence has become a critical aspect of the customer experience. Social influence may appear through different signals such as the number of past purchases; consumer ratings; and/or consumer recommendations, depending on the market and/or platform. Social influence often comes reinforced by position bias (e.g., [Lerman and Hogg, 2014]), as consumer preferences are also affected, sometimes significantly, by the visibility of the choices. In digital markets, the impact of visibility on consumer behavior has been widely observed [Kempe and Mahdian, 2008; Aggarwal et al., 2008].
Yet, despite its ubiquity, there is still considerable debate about the benefits of social influence and its effects on the market. Salganik et al. [2006] argued that social influence makes markets more unpredictable. They created an artificial music market, a trial-offer market called the MUSICLAB and showed that social influence may create significant unpredictability and inefficiencies. Follow-up experiments have been made confirming these initial findings [Salganik and Watts, 2009; van de Rijt et al., 2014].
The MUSICLAB experiments, however, relied on an implicit but critical design choice: The songs were displayed to participants in decreasing order of popularity, reinforcing the social signal with position bias. Thus, creating a herding effect [Muchnik et al., 2013; Hogg and Lerman, 2015], leading to a "rich get richer" phenomenon. Unfortunately, popular-
Gerardo Berbeglia
Melbourne Business School g.berbeglia@mbs.edu
Pascal Van Hentenryck
University of Michigan pvanhent@umich.edu
ity is not always a good proxy for quality and may lead to self-fulfilling prophecies [Salganik and Watts, 2008]. Different search engine rankings have been studied experimentally (see e.g., [Ghose et al., 2012; 2014]).
Kleinberg (2008) articulated the need to develop an expressive computational model to understand the long-term effect of social influence. A first step in answering this open issue appeared in Krumme et al. [2012]: The authors proposed a discrete choice model for modeling the MUSICLAB. This model was then used in Abeliuk et al. [2015] to analyze a new policy for displaying the products, referred to as performance ranking. This ranking is a myopic policy that maximizes the efficiency of the market for each incoming participant, taking into account the inherent quality of products, position bias, and social influence. Their computational results show that the performance ranking significantly decreases the unpredictability of the market. A different policy, referred to as quality ranking, was proposed in Van Hentenryck et al. [2016]. The quality ranking only takes into account the inherent quality of products and yet, the authors showed that this policy is optimal and predictable asymptotically.
In this paper, we reconsider the performance ranking from Abeliuk et al. [2015] and study its asymptotic convergence. We show that this myopic policy is also optimal and predictable asymptotically, in addition to being optimal at each step. In contrast to the quality ranking, which is a static policy, the performance ranking is dynamic. Thus, from a technical standpoint, our analysis is the first to provide theoretical guarantees over a dynamic policy in cultural markets. Moreover, computational results show that the rate of convergence for the performance ranking is considerably faster than the quality ranking. Additionally, we correct and simplify a proof from Abeliuk et al. [2015] showing that the market always benefits from position bias and social influence in expectation under this policy. These results indicate that the performance ranking is an attractive policy for trial-offer markets: It avoids the pathological effects of the popularity ranking and it optimizes market efficiency both locally and asymptotically.
2 Trial-Offer Markets
This section introduces trial-offer markets in which participants can try a product before deciding to buy it. Such models are now pervasive in online cultural markets (e.g., books and songs). The market is composed of n products and each product i 2 ¶1↪ ▷ ▷ ▷ ↪ n♦ is characterized by two values:
- Its appeal ai which represents the inherent preference of trying product i;
- Its quality qi which represents the conditional probability of purchasing product i given that it was tried.
Each market participant is presented with a product list ⇡: she then tries a product s in ⇡ and decides whether to purchase s with a certain probability. The product list is a permutation of ¶1↪ ▷ ▷ ▷ ↪ n♦ and each position p in the list is characterized by its visibility vp > 0 which is the inherent probability of trying a product in position p. Since the list ⇡ is a bijection from positions to products, its inverse is well-defined and is called a ranking. Rankings are denoted by the letter σ, ⇡i denotes the product in position i of the list ⇡, and σi identifies the position of product i in the ranking σ. Hence vσi denotes the visibility of the position of product i.
Our primary objective is to maximize the market efficiency, i.e., the expected number of purchases. Note also that the higher this objective is, the lower the probability that consumers try a product but then decide not to purchase it. Hence, maximizing the expected efficiency of the market also minimizes unproductive trials.
Dynamic Market Since we are interested in the long-term effects of social influence, we consider a multi-period, dynamic market where consumers arrive sequentially, one per time period. Upon arrival, a consumer is able to observe the aggregate purchase decisions of her predecessors. Denote by dt = (dt1 ↪ ▷ ▷ ▷ ↪ dtn ) the total number of consumers who purchased product i until the beginning of period t. The probability that the consumer arriving at period t will try product i if items are displayed using position assignment σ is given by
Observe that consumer choice preferences for trying the products are essentially modeled as a discrete choice model based on a multinomial logit [Luce, 1965] in which product utilities are affected by their position. The market uses the number of purchases dt of product i at time t as the social signal. However, other social signals such as the market share, used in online site such as iTunes, are equivalent as we show next. Let φt = (φt1 ↪ ▷ ▷ ▷ ↪ φtn ) denote the market shares at time t in terms of the total number of purchases dt , i.e.,
The probability of trying product i can be rewritten as a function of φt , yielding,
where, for simplicity, the vector d0 is initialized with the products appeals, i.e., d0t = ai. Both notations are convenient to stress different results; we use market shares when analyzing the asymptotic behavior of the market and the number of purchases for analyzing the static behavior of the market. Since qi is the conditional probability of purchasing product i given that it was tried and hence, the expected number of purchases at time t is given by Pni=1 Pi(σ↪ dt ) qi▷
Our goal is to study how the market shares evolve over time when social influence is present. Observe that the probability of trying a product depends on its position in the list, its appeal, and its number of purchases at time t. As the market evolves over time, the number of purchases dominates the appeal of the product and the trying probability of a product becomes its market share. Note also that in a dynamic market when no social signals are displayed, the purchase history plays no role and hence, the market behaves as a static market. Following Salganik and Watts [2008], we refer to this setup as the independent condition.
3 Rankings Policies
This section presents the ranking policies studied in this paper. Without loss of generality, we assume that the qualities and visibilities are non-increasing, i.e., q1 ≥ q2 ≥ · · · ≥ qn and v1 ≥ v2 ≥ · · · ≥ vn. We also assume that the qualities and visibilities are known. In practical situations, the product qualities are obviously unknown but Abeliuk et al. (2015) have shown that they can be recovered accurately and quickly, either before or during the market execution.
The performance ranking was proposed by Abeliuk et al. (2015) to show the benefits of social influence in cultural markets. It maximizes the expected number of purchases at each iteration, exploiting all the available information globally, i.e., the appeal, the visibility, the purchases, and the quality of the products. More precisely, the performance ranking at step t produces a ranking σ⇤ t defined as
The performance ranking can be computed in strongly polynomial time and the resulting policy scales to large markets [Abeliuk et al., 2015].
The quality ranking which simply orders the products by quality, assigning the product of highest quality to the most visible position and so on. With the above assumptions, the quality ranking σ satisfies σi = i (1 i n). The quality ranking was shown to be asymptotically optimal and entirely predictable in Van Hentenryck et al. [2016].
These results contrast with the popularity ranking used in Salganik et al. [2006] to show the unpredictability caused by social influence in cultural markets. At iteration t, the popularity ranking orders the products by the number of purchases dti but these purchases do not necessarily reflect the inherent quality of the products, since they depend on how many times the products were tried, which in turn depends on the position and social signal of the product.
4 Theoretical Analysis
In this section, we present a number of theoretical results on the performance ranking. In particular, we show that the performance ranking always benefits from position bias and social influence and is an optimal and predictable policy asymptotically. For simplicity, the results assume that q1 > q2 > ▷ ▷ ▷ > qn.
Our first results characterize some fundamental properties of the performance ranking.
Lemma 1. Let ⇡⇤ be the optimal list for the static problem (Equation (1)) given market share φ and λ⇤ be the expected number of purchases given ⇡⇤ and φ. Then
Proof. First observe that
Now assume that there exists ⇡0 such that
By reordering the terms, it comes that Pni=1 viφ⇡0i q⇡0i Pni=1 viφ⇡0i > λ⇤ ↪ which contradicts the optimality of ⇡⇤ .
Lemma 1 through the rearrangement inequality provides an important characterization of the optimal ranking at time t.
Corollary 1. Let λ⇤t be the expected number of purchases at time t under the performance ranking. The performance ranking ⇡⇤ t satisfies
This corollary indicates that a product with quality greater or equal to λ⇤t is ranked higher than a product with quality smaller than λ⇤t . This property is independent of the market shares at time t.
The optimal expected number of purchases (Equation (1)) can be written as a function of the market shares:
The continuity of λ(φ) is necessary to apply stochastic approximation methods, which are key to the derivation of the asymptotic behavior of the performance ranking.
Proof. When ⇡ is fixed, it is easy to verify that λ(φ) is continuous. The only source of discontinuity could come when the list ⇡ changes as a function of φ. However, Corollary 1 states that the list only changes when the inequality (3) flips sign for some i↪ j given market share φ0 . This happens when
Since qi 6= qj, this implies that φ0i 6= φ0j . Solving Equation (4) for λ(φ0 ) yields
Thus, limφ!φ0+ λ(φ) = limφ!φ0- λ(φ) = λ(φ0 ).
The Benefits of Social Influence An important question in cultural markets is whether the revelation of past purchases to consumers improves market efficiency. The theorem below states that, under the performance ranking policy, the expected marginal number of purchases in the studied trial-offer model increases when past purchases are revealed. The key to the proof is Lemma 3 which uses the following notations:
- ÷ V1(σ ♣ d) is the expected number of purchases at period t when position assignment σ is displayed conditional to dt = d, i.e.,
- ÷ V2(σ ♣ d) is the expected number of purchases at period t + 1 conditional to dt = d when ranking σ is used at periods t and t + 1 consecutively, i.e.,
where ei denotes the ith unit vector.
The right term captures the case where no product is purchased at period t, while the left term captures the cases where a product i is purchased, which increases its social influence for the next period.
Lemma 3. Let σ⇤ be the optimal position assignment of the static problem at period t given any dt = d. We have
Proof. We use ai↪t = ai +di↪t to denote the perceived appeal of product i under social influence at time t. When the period t is not relevant, we omit it and use ai instead for simplicity. Without loss of generality, we can rename the products so that σ⇤ i = i. Let λ⇤ denote the optimal expected number of purchases at period t given dt = d, i.e.,
We need to prove that V2 (σ⇤ ♣ d) ≥ V1(σ⇤ ♣ d) = λ⇤ , which amounts to showing that
By Corollary 1, the performance ranking at period t satisfies
Hence, the performance ranking allocates all products with a negative term after the products with a positive term. Define P1 = ¶i 2 N♣ (qi -λ⇤ ) ≥ 0♦ and P2 = ¶i 2 N♣ (qi -λ⇤ ) < 0♦. It follows that vi ≥ vj for all i 2 P1, j 2 P2. Inequality (5) can be rewritten as follows:
By definition of P1 and P2, the terms in the left summation are positive and the terms in the right summation are negative. Additionally, for any c > 0,
Let v = mini2P1 vi the smallest visibility assigned to an item in P1. Thus, v ≥ maxi2P2 vi. Similarly, let q = mini2P1 qi. By definition of P1 and P2, q ≥ maxi2P2 qi. These observations leads to the following inequality:
The result follows from Equation (2) in Lemma 1 which implies that
Lemma 3 states that, if the optimal position assignment in period t is used at period t+1, the expected number of purchases at t+1 is at least as high as the expected number of purchases at period t. Clearly, re-optimizing at period t+1 by using the optimal position assignment for period t+1 can only increase the expected number of purchases. Together with Lemma 3, this observation leads to the following theorem.
Theorem 1. The expected rate of purchases is nondecreasing over time for the performance ranking under social influence.
Proof. For any t and dt = d, let σ⇤ be the optimal position assignment in period t. By Lemma 3, we know that V2 (σ⇤ ♣ d) ≥ V1(σ⇤ ♣ d). The performance ranking policy computes
and the result follows.
This result contrasts with the popularity ranking, under which Theorem 1 does not hold [Abeliuk et al., 2016].
As a direct consequence of Theorem 1, the sequence λ⇤1 ↪ ▷ ▷ ▷ ↪ λ⇤t of expected numbers of purchases over time is a sub-martingale. By Doob's sub-martingale convergence theorem [Doob, 1953], the process ¶λ⇤t ♦t>0 converges almost surely. The next section studies the convergence points.
Asymptotic Behavior of Performance Ranking We now prove the key result of the paper: The trial-offer market becomes a monopoly for the best product when the performance ranking is used at each step. As a consequence, the performance ranking is optimal asymptotically since the best product has the highest probability to be purchased. The result also indicates that trial-offer markets are predictable asymptotically when the performance ranking is used. The proof needs the following lemma that characterizes the probability that the next purchase is product i.
Lemma 4. The probability pi that the next purchase (after any number of steps) is product i given ranking σ is
Proof. The probability that product i is purchased in step m while no product was purchased in earlier steps is
Since, by Lemma 4, the steps in which no product is purchased can be ignored, we can use the following variables (1 i n) to specify the market:
Hence the probability that the next purchased product is product i is given by pi = P1m=0 pmi . The result follows from P1m=0 (1 - a)m = 1a .
where ˆ qj(σ) = vσj qj. The trial-offer market can thus be modeled as generalized P´olya scheme [Renlund, 2010], where Xi↪t represents the number of balls of type i at step t and Zi↪t is the proportion of balls of type i at step t. Since Xi↪t+1 = Xi↪t + ˆ qi(σ) if product i is purchased, the generalized P´olya scheme add ˆ qi(σ) balls each time product i is purchased. As a result, the P´olya scheme uses the stochastic replacement matrix
Higueras et al (2003) showed that a generalized P´olya urn scheme with n colors can be modeled as a Robbins-Monro Algorithm as follows. The process ¶Zi♦ can be written as
where: (1) the process ¶γi♦ is a decreasing sequence of positive random variables, Pi≥1 γi = 1 and Pi≥1 γ 2 i < 1; (2) ¶✏i♦ is a sequence of martingale differences with respect to ¶Fi♦ ↪ where Fi is the natural filtration of the entire process; (3) ¶βi♦ is a negligible sequence such that βi ! 0 almost surely; (4) F(x) = xR(I - 1T x) must be continuous, where R is the replacement matrix of the P´olya scheme. The ODE method [Ljung, 1977] relates the recurrence Equation (9) with the ordinary differential equation ˙x = F(x). If this ODE has a globally asymptotically stable equilibrium point u 2 Rn , then the discrete process ¶Zi♦ converges almost surely to this point. The equilibrium points u are obtained by solving F (φ) = 0 when Pni=1 φi = 1.
Lemma 5. Let F(φ) = φR(σ)(I - 1T φ). The solutions to F(φ) = 0 when Pni=1 φi = 1 are given by the set ¶ei : 1 i n♦, where ei denotes the ith unit vector.
Proof.
with
An equilibrium point must satisfy Fi(φ) = 0 for all i. Thus, the points in ¶ei : 1 i n♦ are trivial solutions. We now show these are the only solutions. Assume that S = ¶i : φi > 0♦ is such that ♣S♣ > 1. Then, an equilibrium must satisfy
Define l = arg-mini2S qi and m = arg-maxi2S qi. Equation (11) when applied twice to l and m implies that vσm qm = vσl ql. Since qm > ql, vm < vl must hold to satisfy the equilibrium condition (11). This means that product l is assigned in a better position than product m. Thus, by Corollary 1, the performance ranking must satisfy that,
However, the expected number of purchases λ(φ) is bounded from below and above by ql and qm respectively, i.e.,
Hence ql - λ(φ) 0, qm - λ(φ) ≥ 0 and qm > ql, resulting in a contradiction since it violates Equation (12). Hence, condition (11) can never met when ♣S♣ > 1.
We now proceed to check the stability of the equilibrium points. The behavior of the solutions depend on σ, which itself depends on φ by Corollary 1. We will exploit this fact.
Theorem2. [Monopoly] Consider a trial-offer market under the performance ranking. Then the market converges almost surely to a monopoly for the product with the best quality.
Proof. In order to use the ODEMethod, we study the asymptotic behavior of the solutions of ˙x = F(x), or equivalently
If xi 6= 0, we can rewrite the previous equation as follows:
where the right-hand-side of the equation is constant for every product. Therefore
From any initial condition where the appeals are non-zero, no product will ever reach a market share of exactly one or zero. Hence, we analyze the behavior of the performance ranking when arbitrarily close to the equilibrium points. Define φi to be a small perturbation from ei, i.e.,
where ✏ is an arbitrarily small positive quantity. The expected number of purchases for any φi is λ(φi ) ⇡ qi. For i = 1, any perturbation of the market shares will slightly decrease the expected number of purchases, i.e., λ(φ1 ) = q1 - δ, δ > 0. Then, q1-λ(φ1 ) > 0 and, for any k ≥ 2, qk-λ(φ1 ) 0. By the condition in Corollary 1 and the fact that all φ1k > 0, the best quality product q1 is assigned in the top slot, i.e., σ1 = 1. Hence, vσ1 q1 - vσk qk > 0 for any k 6= 1.
For i > 1, consider a perturbation where some product j : qj > qi has a small increase in its market such that the expected number of purchases increases very slightly, i.e., λ(φi ) = qi +δ, δ > 0. Thus, for small δ, qj -λ(φi ) > 0 and
Consider the process given by Equation (13) with initial condition x0 = φ1 . The process begins in the simplex, i.e., 0 < xi↪0 < 1↪ 8i, and hence ln( xi↪0 xk↪0 ) is bounded. Since the ranking does not change, the behavior of the solutions is given by the asymptotic behavior of t[vσi qi -vσk qk] which depends on the sign of vσi qi - vσk qk. Taking i = 1 and k 2 ¶2↪ ▷▷▷↪ n♦, we have that vσ1 q1 - vσk qk > 0, and hence t[vσ1 q1 - vσk qk] ! +1 as t ! +1. Hence, ln( x1↪t xk↪t ) ! +1 for all k > 1, and consequently xk(t) ! 0. As Pni=1 xi↪t = 1, x1↪t ! 1 and the equilibrium e1 is stable.
qi - λ(φi ) = -δ < 0, which implies that φij (qj - λ(φi )) > φii (qi - λ(φi )). Therefore, by Corollary 1, product j is assigned in a better position than product i, i.e., vσj ≥ vσi and hence, vσj qj - vσi qi > 0. Consider the process given by Equation (13) with initial conditions x0 = φi , i > 1. At t = 0, as described above, it holds that vσj qj -vσi qi > 0 and consequently, at the next period of time t = 1, ln( xj↪1 xi↪1 ) > ln( xj↪0 xi↪0 ). This implies that xj↪1 > xj↪0 or xi↪1 < xi↪0, which, in either case, indicates that the new state is farther away from the initial state. Hence, ei is an unstable equilibrium.
Theorem 2 states that, given any initial condition with nonzero appeals, the market eventually reaches to a monopoly for the product of highest quality, entailing the following.
Corollary 2. The performance ranking is asymptotically optimal in trial-offer markets.
5 Computational Experiments
We conclude by presenting computational results that illustrate and complement the theoretical results about the asymptotic behavior of the performance rank. We use an agentbased simulation and each simulation consists of N participants. For each participant at time t, the simulator randomly selects a product i according to the probabilities pi(σ↪ d), where σ is the ranking policy under evaluation and d is the social influence signal. Then, the simulator randomly determines, with probability qi, whether selected product i is purchased; In the case of a purchase, the social influence signal for product i increases, i.e., di↪t+1 = di↪t + 1. Otherwise, di↪t+1 = di↪t. For every participant, a new list σ is computed using one of the ranking policies described above. We consider 50 songs (as in the MUSICLAB) and 40,000 participants. For every experiment, the product qualities qi, product appeals ai and the position visibilities vi are independently drawn from a normal distribution with mean 0▷5 and deviation 0▷2. The values are then normalized to be between 0 and 1 and the appeals ai are scaled by a factor of 50.
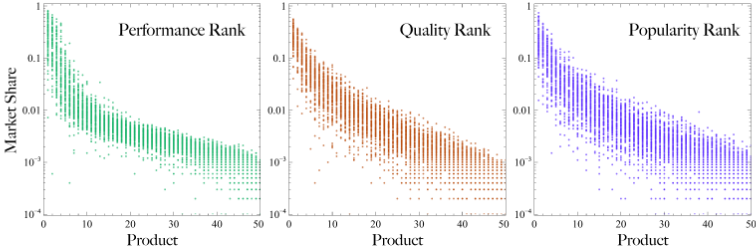
Figure 1 depicts computational results on the distribution of market shares under various ranking policies (in log scale). Each dot is the market share of a product in one of the 100 experiments. Figure 1 shows that the best product almost always receives the most purchases in the performance ranking. Quality ranking also performs well although the variance in its market shares is larger. The popularity ranking, while it shows the same overall correlation between quality and market share, exhibits many outliers. In terms of market efficiency, the performance ranking achieves 10% more purchases than the popularity ranking and 8% more than the quality ranking overall. For a single simulation, the performance ranking can achieve up to 23% more purchases than the other rankings.
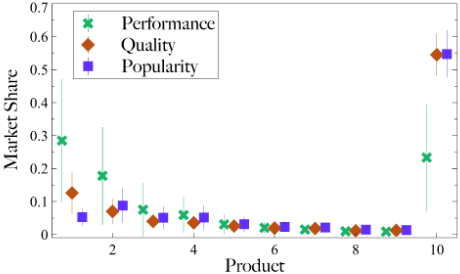
Figure 2 illustrates the instability of sub-optimal monopolies and the benefits of the performance ranking to escape them. Each dot is the average market share product in one of the 100 experiments, where the 10th best product starts with 500 purchases, i.e., we start close to a monopoly for the 10th product. The figure shows that the performance ranking decreases the market share of the 10th product and significantly boosts the best product. This is not the case of the quality ranking at the completion of the experiments.
In conclusion, the theoretical and computational results indicate that the performance ranking has attractive properties for dynamic trial-offer markets. It is optimal and predictable asymptotically and it optimizes market efficiency at each time point. Computational results also show that it recovers from poor initial conditions much faster than the quality ranking.
Acknowledgement
Data61 (formerly known as NICTA) is funded by the Australian Government through the Department of Communications and the Australian Research Council through the ICT Centre of Excellence Program.
@inproceedings{ijcai2016p350,
  title     = {Asymptotic Optimality of Myopic Optimization in Trial-Offer Markets with Social Influence},
  author    = {Abeliuk, Andres and Berbeglia, Gerardo and Maldonado, Felipe and Van Hentenryck, Pascal},
  booktitle = {Proceedings of the Twenty-Fifth International Joint Conference on
               Artificial Intelligence, {IJCAI-16}},
  publisher = {AAAI Press / International Joint Conferences on Artificial Intelligence},
  editor    = {Subbarao Kambhampati},
  pages     = {2458--2463},
  year      = {2016},
  month     = {7},
  url       = {https://ijcai.org/proceedings/2016/350},
}
TY - CPAPER TI - Asymptotic Optimality of Myopic Optimization in Trial-Offer Markets with Social Influence AU - Abeliuk, Andres AU - Berbeglia, Gerardo AU - Maldonado, Felipe AU - Van Hentenryck, Pascal T2 - Proceedings of the Twenty-Fifth International Joint Conference on Artificial Intelligence, IJCAI-16 PB - AAAI Press / International Joint Conferences on Artificial Intelligence PY - 2016 SP - 2458 EP - 2463 UR - https://ijcai.org/proceedings/2016/350 ER -Copied
Machine-readable versions of this paper, for tools and AI agents:





