
Baseline Regularization for Computational Drug Repositioning with Longitudinal Observational Data
Proceedings of the Twenty-Fifth International Joint Conference on Artificial Intelligence. Pages 2521-2527.
Abstract
Computational Drug Repositioning (CDR) is the knowledge discovery process of finding new indications for existing drugs leveraging heterogeneous drug-related data. Longitudinal observational data such as Electronic Health Records (EHRs) have become an emerging data source for CDR. To address the high-dimensional, irregular, subject and time-heterogeneous nature of EHRs, we propose Baseline Regularization (BR) and a variant that extend the one-way fixed effect model, which is a standard approach to analyze small-scale longitudinal data. For evaluation, we use the proposed methods to search for drugs that can lower Fasting Blood Glucose (FBG) level in the Marshfield Clinic EHR. Experimental results suggest that the proposed methods are capable of rediscovering drugs that can lower FBG level as well as identifying some potential blood sugar lowering drugs in the literature.
- [Anderson et al., 1999] James W Anderson, Lisa D Allgood, Jan Turner, Peter R Oeltgen, and Bruce P Daggy. Effects of psyllium on glucose and serum lipid responses in men with type 2 diabetes and hypercholesterolemia. The American Journal of Clinical Nutrition, 70(4):466-473, 1999.
- [Andronis et al., 2011] Christos Andronis, Anuj Sharma, Vassilis Virvilis, Spyros Deftereos, and Aris Persidis. Literature mining, ontologies and information visualiza- tion for drug repurposing. Briefings in Bioinformatics, 12(4):357-368, 2011.
- [Arnold et al., 2014] Taylor B Arnold, Ryan J Tibshirani, Maintainer Taylor Arnold, and TRUE ByteCompile. Pack- age genlasso. Statistics, 39(3):1335-1371, 2014.
- [Chow and Stone, 1957] Bacon F Chow and Howard H Stone. The relationship of vitamin b12 to carbohydrate metabolism and diabetes mellitus. The American Journal of Clinical Nutrition, 5(4):431-439, 1957.
- [Damci et al., 2003] Taner Damci, Serkan Tatliagac, Zeynep Osar, and Hasan Ilkova. Fenofibrate treatment is associ- ated with better glycemic control and lower serum leptin and insulin levels in type 2 diabetic patients with hyper- triglyceridemia. European Journal of Internal Medicine, 14(6):357-360, 2003.
- [De Boer et al., 2008] Ian H De Boer, Lesley F Tinker, Stephanie Connelly, J David Curb, Barbara V Howard, Bryan Kestenbaum, Joseph C Larson, JoAnn E Manson, Karen L Margolis, David S Siscovick, et al. Calcium plus vitamin d supplementation and the risk of incident diabetes in the women's health initiative. Diabetes Care, 31(4):701-707, 2008.
- [DiabetesInControl, 2015] DiabetesInControl. Drugs that can affect blood glucose levels. http: //www.diabetesincontrol.com/wp-content/uploads/ 2010/07/www.diabetesincontrol.com images tools druglistaffectingbloodglucose.pdf, 2015. (Visited on 09/28/2015). Link
- [Fakhraei et al., 2013] Shobeir Fakhraei, Louiqa Raschid, and Lise Getoor. Drug-target interaction prediction for drug repurposing with probabilistic similarity logic. In Proceedings of the 12th International Workshop on Data Mining in Bioinformatics, pages 10-17. ACM, 2013.
- [Fournier et al., 2015] Jean-Pascal P Fournier, Laurent Azoulay, Hui Yin, Jean-Louis L Montastruc, and Samy Suissa. Tramadol use and the risk of hospitalization for hypoglycemia in patients with noncancer pain. JAMA Internal Medicine, 175(2):186-193, 2015.
- [Frees, 2004] Edward W Frees. Longitudinal and panel data: analysis and applications in the social sciences. 2004.
- [Friedman et al., 2010] Jerome Friedman, Trevor Hastie, and Rob Tibshirani. Regularization paths for generalized linear models via coordinate descent. Journal of statistical software, 33(1):1, 2010.
- [GovernmentOfCanada, 2015] GovernmentOfCanada. Glu- conorm (repaglinide) -new contraindication for concomi- tant use with clopidogrel -recalls & alerts -healthy cana- dians website. http://healthycanadians.gc.ca/recall-alert- rappel-avis/hc-sc/2015/54454a-eng.php, 2015. (Visited on 01/29/2016). Link
- [Hess et al., 2013] Wolfgang Hess, Maria Persson, Stephanie Rubenbauer, and Jan Gertheiss. Using lasso-type penalties to model time-varying covariate effects in panel data regressions-a novel approach il- lustrated by the'death of distance'in international trade. 2013.
- [Kesim et al., 2011] Murat Kesim, Ahmet Tiryaki, Mine Ka- dioglu, Efnan Muci, Nuri Ihsan Kalyoncu, and Ersin Yaris. The effects of sertraline on blood lipids, glucose, insulin and hba1c levels: A prospective clinical trial on depressive patients. Journal of Research in Medical Sciences: the Of- ficial Journal of Isfahan University of Medical Sciences, 16(12):1525, 2011.
- [Ko et al., 2006] Gary TC Ko, Hendena PS Wai, and Joyce SF Tang. Effects of age on plasma glucose levels in non-diabetic hong kong chinese. Croatian Medical Jour- nal, 47(5):709-713, 2006.
- [Kuang et al., 2016] Zhaobin Kuang, James Thomson, Michael Caldwell, Peggy Peissig, Ron Stewart, and David Page. Computational drug repositioning using continuous self-controlled case series. arXiv preprint, 2016.
- [Li and Lu, 2013] Jiao Li and Zhiyong Lu. Pathway-based drug repositioning using causal inference. BMC Bioinfor- matics, 14(16):1, 2013.
- [Lustman et al., 2007] Patrick J Lustman, Monique M Williams, Gregory S Sayuk, Billy D Nix, and Ray E Clouse. Factors influencing glycemic control in type 2 di- abetes during acute-and maintenance-phase treatment of major depressive disorder with bupropion. Diabetes Care, 30(3):459-466, 2007.
- [Mitri and Pittas, 2014] Joanna Mitri and Anastassios G Pit- tas. Vitamin d and diabetes. Endocrinology and Metabolism Clinics of North America, 43(1):205-232, 2014.
- [Mitri et al., 2011] Joanna Mitri, Bess Dawson-Hughes, Frank B Hu, and Anastassios G Pittas. Effects of vitamin d and calcium supplementation on pancreatic cell func- tion, insulin sensitivity, and glycemia in adults at high risk of diabetes: the calcium and vitamin d for diabetes mel- litus (caddm) randomized controlled trial. The American Journal of Clinical Nutrition, 94(2):486-494, 2011.
- [NIH, 2016] NIH. Drug-induced hypoglycemia: Medline- plus medical encyclopedia. https://www.nlm.nih.gov/ medlineplus/ency/article/000310.htm, 2016. (Visited on 01/29/2016). Link
- [O'Sullivan, 1974] John B O'Sullivan. Age gradient in blood glucose levels: magnitude and clinical implications. Dia- betes, 23(8):713-715, 1974. [SanofiAventisCanadaInc., 2015] SanofiAventisCanadaInc. Product monograph plaquenil. http://products.sanofi.ca/ en/plaquenil.pdf, 2015. (Visited on 01/29/2016). Link
- [Shah et al., 2006] Pankaj Shah, Jarek Aniszweski, and John F Service. Propoxyphene-induced hypoglycemia in renal failure. Endocrine Practice, 12(2):170-173, 2006.
- [Simpson et al., 2013] Shawn E Simpson, David Madigan, Ivan Zorych, Martijn J Schuemie, Patrick B Ryan, and Marc A Suchard. Multiple self-controlled case series for large-scale longitudinal observational databases. Biomet- rics, 69(4):893-902, 2013.
- [Tibshirani and Taylor, 2011] Ryan J. Tibshirani and Jonathan Taylor. The solution path of the generalized lasso. The Annals of Statistics, 2011.
- [Tibshirani, 1996] Robert Tibshirani. Regression shrinkage and selection via the lasso. Journal of the Royal Statistical Society. Series B (Methodological), pages 267-288, 1996.
- [Ting et al., 2006] Rose Zhao-Wei Ting, Cheuk Chun Szeto, Michael Ho-Ming Chan, Kwok Kuen Ma, and Kai Ming Chow. Risk factors of vitamin b12 deficiency in pa- tients receiving metformin. Archives of Internal Medicine, 166(18):1975-1979, 2006.
- [Tseng, 2001] Paul Tseng. Convergence of a block co- ordinate descent method for nondifferentiable minimiza- tion. Journal of Optimization Theory and Applications, 109(3):475-494, 2001.
- [Xu et al., 2014] Hua Xu, Melinda C Aldrich, Qingxia Chen, Hongfang Liu, Neeraja B Peterson, Qi Dai, Mia Levy, Anushi Shah, Xue Han, Xiaoyang Ruan, Min Jiang, Ying Li, Jamii St Julien, Jeremy Warner, Carol Friedman, Dan M Roden, and Joshua C Denny. Validating drug re- purposing signals using electronic health records: a case study of metformin associated with reduced cancer mor- tality. Journal of the American Medical Informatics Asso- ciation, pages amiajnl-ami2014, 2014.
- [Zammit, 2012] Paul Zammit. Ssri-induced hypoglycemia causing confusion in a nondiabetic octogenarian. Annals of Long-Term Care: Clinical Care and Aging, 20:28-30, 2012.
- [Zou et al., 2007] Hui Zou, Trevor Hastie, Robert Tibshirani, et al. On the degrees of freedom of the lasso. The Annals of Statistics, 35(5):2173-2192, 2007.
- [Zuccoli et al., 2013] ML Zuccoli, PC Brasesco, G Milano, A Martelli, S Leone, F Mattioli, and C Fucile. A case report on escitalopram-induced hyperglycaemia in a dia- betic patient. The International Journal of Psychiatry in Medicine, 46(2):195-201, 2013.
References were extracted automatically from the PDF and may contain errors.
Full text extracted automatically from the PDF; figures, tables and equations may differ. The PDF is the version of record.
1 Introduction
Computational Drug Repositioning (CDR) is the knowledge discovery process of finding new indications for existing drugs, leveraging heterogeneous drug-related data. It is a challenging and rapidly-growing application of artificial intelligence [Andronis et al., 2011; Fakhraei et al., 2013; Li and Lu, 2013]. Longitudinal observational data such as Electronic Health Records (EHRs) have become an emerging data source for CDR [Xu et al., 2014]. In EHRs, detailed across-time clinical information on patients, such as drug prescriptions, conditions, lab test results, and demographics, are collected from a large and diverse population. This largescale data source provides potentially valuable information to foster the study of correlations among various drugs, conditions, and lab results in diverse patient profiles, which is an important task for predictive analytics in the healthcare industry.
For the task of CDR, we build a predictive model that uses the drug prescription history of patients to predict their continuous numeric value of Fasting Blood Glucose (FBG) level. We examine the drugs (predictors) that have significant blood sugar lowering effects. If some of them are not known to lower blood sugar already, we can consider those drugs as potential candidates for repositioning to control blood sugar, with further inspection.
We observe that patients in the EHRs have extremely diverse FBG level profiles (e.g. some people tend to have higher FBG level than the others). Furthermore, different FBG level measurements taken far apart in time might have very different values. This is especially true if some persistent blood glucose altering events occur to a person, such as the diagnosis of diabetes.
Based on these observations, our Baseline Regularization (BR) model assumes that there is a patient-specific, timevarying, but unknown baseline FBG value for each patient over different time periods. The model further assumes that the observed FBG level of a particular patient taken at a particular time is influenced by the joint effects of the baseline value and the exposure statuses of various drugs for that patient at that time. We first build a sparse fixed-effect model to describe our assumptions, and then we impose regularization to the baseline model parameters, hence the name of our model, baseline regularization. For computational efficiency, we also propose an alternative formulation to the original baseline regularization model.
Our contributions are threefold:
- ÷ We introduce the baseline regularization model for the task of CDR, which generalizes the standard one-way fixed effect model [Frees, 2004].
- ÷ We propose an alternative formulation to the original baseline regularization model, which is equivalent to an L1 regularized linear model and hence can be solved efficiently.
- ÷ Using our methodology, we discover some drugs with literature support indicating their potential glucose-lowering effects that are worthy of further investigation.
2 Background
2.1 Electronic Health Records (EHRs)
Figure 1 visualizes a simple EHR with two patients stored in a relational database. Two tables are presented. Table 1a represents drug era records. Each row records the identifier of a patient with the name, the start date, and the end date of a drug prescribed to this patient. We consider that the patient is under exposure of the drug during the time span from the start date to the end date of the drug era record. Table 1b
| PATIENT ID | DRUG NAME | START DATE | END DATE |
| 1 | HUMALOG | Jan-28-2005 | Mar-23-2005 |
| 1 | HUMALOG | Jun-17-2005 | Jul-20-2005 |
| 2 | INSULIN | Mar-07-1998 | May-14-1998 |
| PATIENT ID | DATE | VALUE |
|---|---|---|
| 1 | Jan-28-2005 | 130 |
| 2 | Apr-13-1998 | 95 |
| 2 | Aug-12-1998 | 140 |
Figure 1: Electronic Health Records (EHRs)
represents FBG level records. Each row records the identifier of a patient, with the measured date and the numeric value of a FBG measurement. Within each patient, drug era records of the same drug do not overlap in time. Furthermore, only one FBG measurement can be taken at a particular date within each patient.
2.2 Notation
Let there be N patients and M drugs in the EHR. We use yij to denote the numeric value of the j th FBGmeasurement taken from the ith patient, where i 2 ¶1↪ 2↪ · · · ↪N♦ and j 2 ¶1↪ 2↪ · · · ↪ Ji♦. We denote n = PNi=1 Ji. Furthermore, we use xij to denote an M ⇥ 1 binary vector, with xijk = 1 representing that the ith patient is under the exposure of the kth drug at the time when the j th FBG measurement was taken, where i 2 ¶1↪ 2↪ · · · ↪N♦, j 2 ¶1↪ 2↪ · · · ↪ Ji♦, and k 2 ¶1↪ 2↪ · · · ↪M♦. Similarly, xijk = 0 indicates that the ith patient is not exposed to the kth drug at the time when the j th FBG measurement was taken.
3 The Baseline RegularizationModel 3.1 The Fixed-Effect Model
We are interested in using xij's to predict yij's. For this purpose, we consider the following one-way fixed-effect model:
yij ♣ xij = ↵i +β>xij + ✏ij↪ ✏ij iid ⇠ N (0↪ σ2 ) ↪ (1) where ↵i is a patient-specific, time-invariant, nonrandom parameter representing the constant baseline FBG level of the ith patient, and β is an M ⇥ 1 vector with βk, k 2 ¶1↪ 2↪ · · · ↪M♦, representing the effect of the kth drug on the j th measurement of the ith patient if the patient is exposed to that drug at the time when the measurement was taken. ✏ij's represent the independent and identically Gaussian distributed noises with zero mean and fixed but unknown variance σ2 . Based on the aforementioned definitions, intuitively, if xij = 0, then
indicating that the baseline parameter ↵i is the value of the expected FBG level of the ith patient if the patient is exposed to no drugs.
Fitting the fixed-effect model in (1) is equivalent to solving the following least square problem:
where
where Z is a block diagonal matrix with 1i being an all-one Ji ⇥ 1 vector.
3.2 Time-Varying Baseline
The introduction of the patient-specific baseline parameter ↵ in (2) explains the heterogeneous nature of the FBG levels measured from different patients. However, since ↵ is timeinvariant, the model in (2) essentially assumes that the baseline FBG level of each patient does not change over time. This is a restrictive assumption for EHR data in that FBG records of a person can be collected over decades, and the baseline FBG level will usually change over such a long period of time [O'Sullivan, 1974; Ko et al., 2006]. This is especially true if some persistent glucose altering events occur to a patient, such as the diagnosis of diabetes. To incorporate a time-varying baseline, we extend the fixed-effect model in (1) as follows:
where tij can be considered as the deviation of the FBG level baseline from ↵i at the time when the j th measurement was taken from the ith patient. Fitting model (3) is equivalent to solving the following least square problem:
and I is an n ⇥ n identity matrix.
3.3 Parsimonious Representation
The parameter of interest in our task is β. In contrast, we refer to ↵ and t as nuisance parameters. In this section, we consider deriving a parsimonious model from (4) that is ↵- free. Minimizing L(↵↪ β↪ t) with respect to ↵ is equivalent to:
where Z = (Z>Z)-1 Z>, ¯ y is an N ⇥ 1 vector with ¯ yi = 1 Ji PJi j=1 yij, and ¯X is an N ⇥M matrix with the ith row being ¯Xi· = 1 Ji PJi j=1 x>ij . Substituting (5) into (4) yields,
which is free of ↵.
3.4 Sparsity and Baseline Regularization
The sample size in (6) is n; however, the number of parameters in the model is M + n. Overparameterization in (6) motivates us to impose regularization onto the parameters β and t so as to control their degree of freedom. A type of regularization that can be imposed on β is the lasso [Tibshirani, 1996] penalty that encourages sparsity, which yields,
where λ1 > 0. The incorporation of the lasso penalty in (7) can potentially set most components of β to zero, which means the model makes the assumption that only a small subset of drugs in the EHRs will alter the FBG level.
We now consider the regularization of the baseline parameter t. For this purpose, we first consider an adjacent pair of FBG measurements from the same patient i, i.e. yij and yi(j+1), where i 2 ¶1↪ 2↪ · · · ↪N♦, and j 2 ¶1↪ 2↪ · · · ↪ Ji - 1♦. We predefine a time threshold δ; furthermore, we denote the time when yij was taken as ⌧ij and we define ⌧i(j+1) accordingly. We consider only adjacent pairs of FBG measurements from the same patient that satisfies
In words, the constraint in (8) means that we only focus on adjacent pairs of FBG measurements from the same patient that are measured close enough in time. For the pair of yij and yi(j+1), their corresponding baseline FBG levels are ↵i + tij and ↵i + ti(j+1) respectively. A reasonable assumption is, if a pair of adjacent FBG measurements from the same patient are close enough in time, their FBG baseline levels should not be very different from each other; that is to say, we expect the
to be small. This assumption motivates us to incorporate a fused lasso penalty [Tibshirani and Taylor, 2011] to (7) in order to regulate the baseline parameter t, yielding:
In (9), λ2 > 0 and Dδ is a matrix that depends on δ. It only contains 0, and ◦1 entries. When multiplied with t, the role of each row of Dδ is to subtract the earlier FBG baseline parameter from the later baseline parameter of an adjacent pair of records from the same patient that were collected within a time span of δ. We denote the number of adjacent pairs that satisfy the aforementioned criteria as s, then Dδ is an s ⇥ n matrix. The fused lasso penalty in (9) penalizes adjacent baseline parameters that are very different from each other, and can potentially drive most differences to zero. Therefore the model helps to keep the value of many adjacent components in t the same or very closed to each other, which reduces the degree of freedom of t significantly. With regularization for both β and t, the overparameterization problem in the time-varying baseline model is relieved substantially.
We define = (I -ZZ ) t and hence:
where
As illustrated in Section 3.2, tij's can be considered as deviation of baseline FBG level from↵i. Therefore, it is reasonable to assume that the mean deviation, ¯ ti, is close to zero. Furthermore, as Ji's increase, 8i, the entries in ZZ are closer and closer to zero too. Based on these observations, we approximate I - ZZ in (9) with I, and define the baseline regularization model as:
The approximation made in (10) offers substantial computational advantages in solving the problem, which we will further illustrate in Section 4.
4 Optimization Procedure for BR
The baseline regularization model in (10) can be rewritten as a generalized lasso [Tibshirani and Taylor, 2011] problem:
However, due to the large volume of data in EHRs, solving (11) directly using a generalized lasso solver might be slow or even infeasible. The difficulty of directly solving (11) motivates us to consider the following optimization strategy.
Notice that β and t are separable in the lasso and fused lasso penalty in (10), i.e. the penalty part of the BR model in (10) is a summation of two functions that involves only β and t respectively in each function. We therefore can perform blockwise minimization over β and t alternatively [Tseng, 2001] in order to solve (10). Specifically, denote β(k) as the estimation of β generated after the kth iteration, at iteration k + 1, we consider β(k) as a constant and optimize with respect to t for t(k+1) by solving the t-step subproblem:
The t-Step:
The problem in (12) is a fused lasso problem with identity design matrix, which can be solved efficiently by the genlasso [Arnold et al., 2014] package in R. Notice that the reason why we have an identity design matrix in (12) is due to the approximation made in (10). Had the approximation not been made, we need to solve a fused lasso problem
with a general design matrix, which is much less efficient than solving the problem in (12).
After computing t(k+1) from (12), we fix t(k+1) and optimize with respect to β for β(t+1) by solving the β-step subproblem:
The β-Step:
The β-step is an L1 regularized linear model, which can be solved efficiently by the glmnet [Friedman et al., 2010] package in R. The blockwise minimization algorithm can therefore iteratively alternate between the t-step and the βstep to solve for the BR model defined in (10). The algorithm is summarized in Algorithm 1.
Algorithm 1 Blockwise Minimization
Require: y, X, Z, Dδ, λ1 > 0↪ λ2 > 0
Ensure: solution β, t
- 1: Initialize t(0) = 0, solve
- 3: Solve the t-Step in (12) for t(k+1)
- 2: for k 0↪ 1↪ 2↪ · · · do
- 4: Solve the β-Step in (13) for β(k+1)
- 5: if stop criterion satisfied then
- 6: return β(k+1) , t(k+1)
- 7: end if
- 8: end for
5 An Alternative Formulation of BR
Let δ be given, we can define Dδ accordingly. Consider the following modification of the unregulated problem in (4):
which multiples Dδ with the residue in (4) and considers the square of norm of the transformed residue. In (14), DδZ↵ = 0, and hence the problem in (14) is ↵-free. Equipped the problem in (14) with the lasso and the fused lasso penalty, and let γ = Dδt, we consider an optimization problem with respect to β and γ:
Note that we can verify that Dδ is a row full rank matrix. Therefore, 8γ 2 Rs , 9t 2 Rn , s.t. γ = Dδt. This property indicates that the equality constraint can always be satisfied and hence can be dropped, resulting in an Alternative formulation of the BR model (ABR):
which is also an L1 regularized linear model that can be solved efficiently. The intuition behind this modification is to take the difference between a pair of adjacent records that are close enough with each other in time from the same patient in order to eliminate ↵ for a parsimonious representation. However, in practice, the model in (15) generates different yet sensible estimation of β than that generated by (10), which will be further illustrated in Section 6.
6 Experiments
We conduct experiments to empirically evaluate the proposed methods in two aspects:
- ÷ Application: we would like to demonstrate that our algorithms are not only able to rediscover drugs with known FBG-lowering indications (Section 6.2) but also able to identify potential drugs that might be repositioned to control blood sugar (Section 6.3).
- ÷ Methodology: we will show that the incorporation and regularization of time-varying baseline parameters in both BR and ABR models help to improve predictive performance compared with models without such parameters.
The time-invariant counterpart of BR can be derived by setting t = 0 in (10), degenerating to an L1 regularized linear model named Continuous Self-Controlled Case Series (CSCCS) in [Kuang et al., 2016]:
One can also set γ = 0 in (15), resulting in yet another L1 regularized linear model named CSCCS for Adjacent records (CSCCSA) [Kuang et al., 2016]:
Notice that the model in (17) is still time-varying, because the least square part of the objective function depends on δ. It essentially assumes that two adjacent records from the same patient within δ amount of time share the same FBG baseline and the difference between the two measurements is only dependent on their difference of drug exposure statuses. In our experiments, we set δ = 4 years. We present our experimental results in details in subsequent sections.
6.1 Dataset
EHRs from Marshfield Clinic are used in our experiments. 64515 patients are admitted in the cohort with 219306 FBG measurements in total. 2980 drugs are considered in the experments.
FPR Threshold
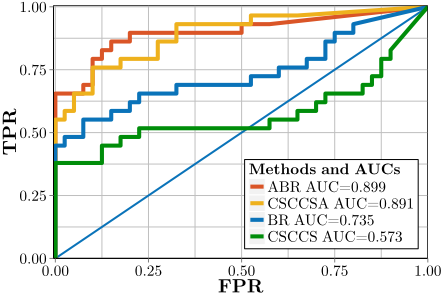
Figure 4: ROC curves on the union list of drugs generated by combining the top-forty drugs from each model
6.2 Rediscovering FBG-Lowering Drugs Model Selection
Table 1 summarizes the configurations of λ1 and λ2 of the BR model defined in (10) and their corresponding number of drugs selected in our experiments. The pairs of λ1 and λ2 are chosen in a way to ensure that approximately two hundred drugs or more are selected. We use Bayesian Information Criterion (BIC) [Zou et al., 2007; Tibshirani and Taylor, 2011] to select the best model from the eight candidates and use the best model as a representative of BR. In this case, model 7 is selected and shaded in gray in Table 1. For this model, 194 drugs are selected. We choose λ3 in (16) adaptively so that the number of drugs selected by (16) is also equal to 194. We use this model as the representative of CSCCS.
| INDX | λ1 | λ2 | # DRUGS |
|---|---|---|---|
| 1 | 0.003923 | 291.141 | 205 |
| 2 | 0.003257 | 290.046 | 252 |
| 3 | 0.003923 | 228.185 | 197 |
| 4 | 0.003257 | 227.232 | 245 |
| 5 | 0.003923 | 177.043 | 196 |
| 6 | 0.003257 | 176.502 | 238 |
| 7 | 0.003923 | 161.502 | 194 |
| 8 | 0.003257 | 161.087 | 231 |
| Name | Definition | Time-Varying |
|---|---|---|
| BR | (10) | Yes |
| ABR | (15) | Yes |
| CSCCS | (16) | No |
| CSCCSA | (17) | Yes |
For the ABR model, we first define r = λ2 λ1 , where λ1 and λ2 are defined in (15). We let r range from 1◁16 to 1 with an incremental step length of 1 400 , resulting in 376 different r's. We choose λ1 (and hence λ2 because λ2 = rλ1) adaptively so as to select two hundred drugs approximately for each r. Now that we have 376 pairs of distinct β's and γ's, one pair for each r, we use BIC again to select the best model among the 376 candidates. The minimum BIC is achieved when r = 0▷075, and 201 drugs are selected in this case. We use this model as a representative of ABR. To compare ABR with its degenerated counterpart in (17), we tune λ4 in (17) such that 201 drugs are also chosen by (17). We use this model as a representative of (17). After model selection, we have four representatives, one for each model. Each representative returns a list of approximately two hundred drugs. The four models used in our experiments are summarized in Table 2.
Top-Forty Drugs
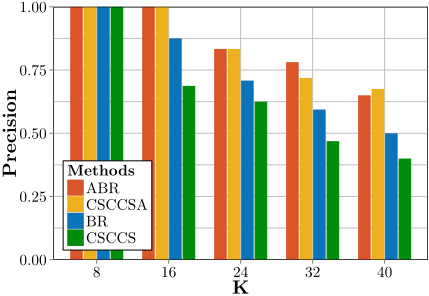
We sort the drugs returned by each model in ascending order according to their coefficients that correspond to components in β. We then manually label the top-forty drugs of each list, considering drugs with known FBG-lowering indications as positives while others as negatives. The labeling process is somewhat analogous to web search, where the search algorithm should return a short list of potential results for further human determination. In this scenario, the results at the top K positions might matter the most. We hence report the precision-at-K metric for each of the four models in Figure 2.
| INDX | CODE | NAME | SCORE |
|---|---|---|---|
| 1 | 2919 | DIVALPROEX SODIUM | -1.818 |
| 2 | 8025 | PROZAC | -1.073 |
| 3 | 7768 | PREMARIN | -1.023 |
| 4 | 4616 | HYDROXYCHLOROQUINE SULFATE | -0.883 |
| 5 | 5204 | LANCETS | -0.873 |
| 6 | 1216 | BLOOD SUGAR DIAGNOSTIC | -0.816 |
| 7 | 5822 | METHOTREXATE SODIUM | -0.708 |
| 8 | 7963 | PROPOXYPHENE NAP/ACETAMINOPHEN | -0.684 |
| 9 | 10392 | ZOLOFT | -0.654 |
| 10 | 5636 | MAVIK | -0.631 |
| 11 | 3471 | ESTROGEN CON/M-PROGEST ACET | -0.583 |
| 12 | 5319 | LEXAPRO | -0.570 |
| 13 | 467 | AMITRIPTYLINE | -0.565 |
| 14 | 7831 | PRILOSEC | -0.545 |
| 15 | 2367 | COUMADIN | -0.474 |
| 16 | 2426 | CYANOCOBALAMIN (VITAMIN B-12) | -0.446 |
| 17 | 3686 | FERROUS SULFATE | -0.389 |
| 18 | 3646 | FENOFIBRATE MICRONIZED | -0.381 |
| 19 | 6610 | NORGESTIMATE-ETHINYL ESTRADIOL | -0.356 |
| 20 | 1455 | CALCIUM CARBONATE/VITAMIN D3 | -0.355 |
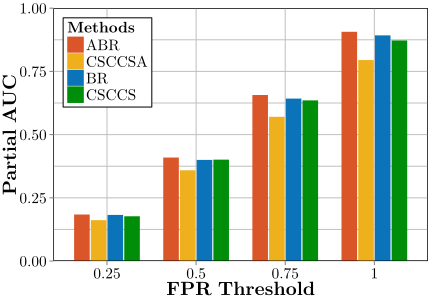
In Figure 2, all four models return a reasonable amount of true positives at the top-forty positions, indicating their capabilities of identifying FBG-lowering drugs. We also notice that introducing and regulating time-varying baseline parameters substantially improve the precision of BR at all K thresholds, compared with CSCCS; while the integration of such parameters does not change the performance of ABR much in terms of precision, compared with CSCCSA. However, in Figure 3, we notice that ABR has a substantially higher Area Under Curve (AUC) than CSCCSA, dominating CSCCSA at every FPR threshold. This phenomenon suggests that making more intrinsic time-varying baseline assumptions in ABR might be potentially beneficial to classification performance.
Union List
We now consider generating a union list of drugs by combining all the top-forty drugs from the four models. The Receiver Operating Characteristics (ROC) curves of all models on the union list are reported in Figure 4. For each model, if a drug from the union list is not selected by the model, we consider it as an example that will be identified as positive at the every end, which results in the straight line parts of the curves in the liberal region. In Figure 4, BR dominates CSCCS at every FPR threshold, demonstrating the potential benefits of incorporating time-varying baseline information. Although the AUC of ABR is very close to that of CSCCSA, we notice that ABR has a higher partial AUC than CSCCSA in the conservative region, from which the operating points of most medical classifiers are usually selected.
6.3 Identifying Potential Drugs
We now turn to discuss identifying drugs that have potential glucose lowering effects. From experiments in Section 6.2, we notice the substantial improvement of rediscovery performance related to the introduction of the time-varying parameters. We therefore will focus on the results generated by the two models with such parameters, BR and ABR. For each of the two models, we follow the model selection procedure described in Section 6.2. However, we only select approximately one hundred drugs for each model and evaluate the potential of the top-twenty drugs in each drug list. We exclude all the records from patients that have any one of the FBG-lowering drugs discovered in Section 6.2, and run our algorithms only on the subset of data after exclusion. Table 3 and Table 4 summarize the findings from BR and ABR respectively, with gray rows representing drugs discovered by both methods. We evaluate the potential of each drug based on literature review in the subsequent sections.
| INDX | CODE | NAME | SCORE |
|---|---|---|---|
| 1 | 5204 | LANCETS | -1.610 |
| 2 | 2919 | DIVALPROEX SODIUM | -1.490 |
| 3 | 1216 | BLOOD SUGAR DIAGNOSTIC | -1.344 |
| 4 | 5319 | LEXAPRO | -1.232 |
| 5 | 5822 | METHOTREXATE SODIUM | -1.086 |
| 6 | 2426 | CYANOCOBALAMIN (VITAMIN B-12) | -0.715 |
| 7 | 8025 | PROZAC | -0.604 |
| 8 | 3686 | FERROUS SULFATE | -0.589 |
| 9 | 10392 | ZOLOFT | -0.529 |
| 10 | 7768 | PREMARIN | -0.526 |
| 11 | 7963 | PROPOXYPHENE NAP/ACETAMINOPHEN | -0.502 |
| 12 | 9034 | SULFAMETHOXAZOLE/TRIMETHOPRIM | -0.500 |
| 13 | 1455 | CALCIUM CARBONATE/VITAMIN D3 | -0.433 |
| 14 | 1200 | BLOOD-GLUCOSE METER | -0.372 |
| 15 | 10215 | WELLBUTRIN SR | -0.334 |
| 16 | 7831 | PRILOSEC | -0.327 |
| 17 | 8073 | PSYLLIUM SEED (WITH SUGAR) | -0.253 |
| 18 | 9531 | TRAMADOL HCL | -0.214 |
| 19 | 7496 | PLAVIX | -0.212 |
| 20 | 494 | AMOXICILLIN/POTASSIUM CLAV | -0.209 |
Potential Decrease
In both Table 3 and Table 4, for propoxyphene nap and acetaminophen, a case has been reported relating to propoxyphene-induced hypoglycemia [Shah et al., 2006]. Zoloft, which is a type of antidepressant, is related to increase of insulin level [Kesim et al., 2011]. Lack of vitamin B12 is related to hyperglycemia in a rat model reported by [Chow and Stone, 1957], and diabetic patients with metformin prescriptions might be vitamin B12 deficient [Ting et al., 2006].
In Table 3, Hydroxychloroquine sulfate is known to cause severe hypoglycemia [SanofiAventisCanadaInc., 2015]. Fenofibrate micronized might also be helpful to lower FBG level, based on the findings in [Damci et al., 2003]. In Table 4, Sulfamethoxazole and trimethoprim, or Bactrim, is known to induce hypoglycemia [NIH, 2016]. Wellbutrin SR is another antidepressant that might be potentially beneficial to control blood sugar level [Lustman et al., 2007]. Psyllium is also reported to improve glycemic control in a study with type 2 diabetes male patients [Anderson et al., 1999]. A recent study suggests that tramadol HCl might increase the risk of hospitalization due to hypoglycemia [Fournier et al., 2015]. Finally, Plavix is reported to cause hypoglycemia due to interactions with Prandin [GovernmentOfCanada, 2015].
Mixed Evidence
In both Table 3 and Table 4, divalproex sodium might increase blood sugar level, according to [DiabetesInControl, 2015]. Prozac could both increase or decrease blood glucose level [DiabetesInControl, 2015]. A hyperglycemia case has also been reported due to Lexapro [Zuccoli et al., 2013]. However, Lexapro is a type of antidepressants called Selective Serotonin Reuptake Inhibitor (SSRI), which is linked to hypoglycemia in certain situations [Zammit, 2012]. The effects of calcium carbonate and vitamin D3 on blood glucose level have been widely studied, but mixed conclusions are reported [De Boer et al., 2008; Mitri et al., 2011;
6.4 BR versus ABR
In Section 6.3, from Table 3 and Table 4, we notice that BR and ABR provide somewhat different potential drug lists. For both lists, we can find literature support to substantiate the blood sugar lowering potentials of many drugs. This experiment indicates that both methods might be viable options to aid the knowledge discovery process of drug repositioning. On the other hand, in Section 6.2, although experiments suggest that regulating time-varying baseline help to improve the rediscovery performance, ABR outperforms BR (and the other methods) in general in the rediscovery task. This observation points to several directions for future work that may extend beyond the CDR application.
First, since the submission of this paper, we have discovered an unpublished manuscript [Hess et al., 2013] that describes a modeling framework similar to BR that is applied to econometric analysis. The empirical advantage we observe for ABR over BR in the present paper for one application of longitudinal data analysis, CDR, suggests investigating whether ABR enjoys a similar advantage for some econometric forecasting applications.
Second, CSCCS and CSCCSA are extensions-to predict continuous variables such as FBG, rather than binary variables-of self-controlled case series, arguably the current leading approach to adverse drug event discovery [Simpson et al., 2013] from clinical data. Hence our results suggest that ABR might have advantages for ADE discovery as well. Testing this conjecture is a direction for further research.
More generally, an important direction for further work is the application of ABR to areas involving longitudinal data, especially when time intervals may be irregularly sampled as in the EHR data we use for CDR. Another direction for future research is to further validate the predictions of ABR for the CDR application.
7 Conclusion
We have introduced the baseline regularization model and its variant for the task of computational drug repositioning. Our proposed methods take into account the high dimensionality, irregularity, subject-heterogeneity and time-heterogeneity of longitudinal observational data and generalize the standard fixed effect model. Experimental results suggest that our methods are not only able to rediscover drugs with confirmed indications, but also able to identify drugs that might be potentially helpful to control FBG level. We therefore believe that the proposed methods can potentially aid the knowledge discovery process of drug repositioning.
Acknowledgments
The authors would like to thank the anonymous reviewers for their constructive comments and advices. The authors would also like to gratefully acknowledge the NIH BD2K Initiative grant U54 AI117924, and the NIGMS grant 2RO1 GM097618.
@inproceedings{ijcai2016p359,
  title     = {Baseline Regularization for Computational Drug Repositioning with Longitudinal Observational Data},
  author    = {Kuang, Zhaobin and Thomson, James A. and Caldwell, Michael and Peissig, Peggy L. and Stewart, Ron M. and Jr., C. David Page},
  booktitle = {Proceedings of the Twenty-Fifth International Joint Conference on
               Artificial Intelligence, {IJCAI-16}},
  publisher = {AAAI Press / International Joint Conferences on Artificial Intelligence},
  editor    = {Subbarao Kambhampati},
  pages     = {2521--2527},
  year      = {2016},
  month     = {7},
  url       = {https://ijcai.org/proceedings/2016/359},
}
TY - CPAPER TI - Baseline Regularization for Computational Drug Repositioning with Longitudinal Observational Data AU - Kuang, Zhaobin AU - Thomson, James A. AU - Caldwell, Michael AU - Peissig, Peggy L. AU - Stewart, Ron M. AU - Jr., C. David Page T2 - Proceedings of the Twenty-Fifth International Joint Conference on Artificial Intelligence, IJCAI-16 PB - AAAI Press / International Joint Conferences on Artificial Intelligence PY - 2016 SP - 2521 EP - 2527 UR - https://ijcai.org/proceedings/2016/359 ER -Copied
Machine-readable versions of this paper, for tools and AI agents:





