
Bayesian Nonparametric Collaborative Topic Poisson Factorization for Electronic Health Records-Based Phenotyping
Proceedings of the Twenty-Fifth International Joint Conference on Artificial Intelligence. Pages 2544-2551.
Abstract
Phenotyping with electronic health records (EHR) has received much attention in recent years because the phenotyping opens a new way to discover clinically meaningful insights, such as disease progression and disease subtypes without human supervisions. In spite of its potential benefits, the complex nature of EHR often requires more sophisticated methodologies compared with traditional methods. Previous works on EHR-based phenotyping utilized unsupervised and supervised learning methods separately by independently detecting phenotypes and predicting medical risk scores. To improve EHR-based phenotyping by bridging the separated methods, we present Bayesian nonparametric collaborative topic Poisson factorization (BN-CTPF) that is the first nonparametric content-based Poisson factorization and first application of jointly analyzing the phenotye topics and estimating the individual risk scores. BN-CTPF shows better performances in predicting the risk scores when we compared the model with previous matrix factorization and topic modeling methods including a Poisson factorization and its collaborative extensions. Also, BN-CTPF provides faceted views on the phenotype topics by patients' demographics. Finally, we demonstrate a scalable stochastic variational inference algorithm by applying BN-CTPF to a national-scale EHR dataset.
- [Asuncion et al., 2009] A. Asuncion, M. Welling, P. Smyth, and Y. W. Teh. On smoothing and inference for topic mod- els. In UAI, pages 27-34. AUAI Press, 2009.
- [Bellazzi and Zupan, 2008] R. Bellazzi and B. Zupan. Pre- dictive data mining in clinical medicine: current issues and guidelines. International journal of medical informatics, 77(2):81-97, 2008.
- [Blei et al., 2003] D. M Blei, A. Y Ng, and M. I Jordan. La- tent dirichlet allocation. Journal of machine Learning re- search, 3:993-1022, 2003.
- [Canny, 2004] J. Canny. Gap: a factor model for discrete data. In ACM SIGIR, pages 122-129. ACM, 2004.
- [Davis et al., 2010] D. A Davis, N. V Chawla, N. A Chris- takis, and A.-L Barababasi. Time to care: a collaborative engine for practical disease prediction. Data Mining and Knowledge Discovery, 20(3):388-415, 2010.
- [Evans et al., 2012] D. C Evans, C. H Cook, J. M Christy, C. V Murphy, A. T Gerlach, D. Eiferman, D. E Lind- sey, M. L Whitmill, T. J Papadimos, P. R Beery, et al. Comorbidity-polypharmacy scoring facilitates outcome prediction in older trauma patients. Journal of the Ameri- can Geriatrics Society, 60(8):1465-1470, 2012.
- [Ghassemi et al., 2014] M. Ghassemi, T. Naumann, F. Doshi-Velez, N. Brimmer, R. Joshi, A. Rumshisky, and P. Szolovits. Unfolding physiological state: Mortality modelling in intensive care units. In ACM SIGKDD, pages 75-84. ACM, 2014.
- [Ghassemi et al., 2015] M. Ghassemi, M. AF Pimentel, T. Naumann, T. Brennan, D. A Clifton, P. Szolovits, and M. Feng. A multivariate timeseries modeling approach to severity of illness assessment and forecasting in icu with sparse, heterogeneous clinical data. In AAAI, pages 446- 453, 2015.
- [Gopalan et al., 2013] P. Gopalan, J. M Hofman, and D. M Blei. Scalable recommendation with poisson factorization. arXiv preprint arXiv:1311.1704, 2013.
- [Gopalan et al., 2014] P. K Gopalan, L. Charlin, and D. Blei. Content-based recommendations with poisson factoriza- tion. In NIPS, pages 3176-3184, 2014.
- [Hajjar et al., 2007] E. R Hajjar, A. C Cafiero, and J. T Han- lon. Polypharmacy in elderly patients. American journal of geriatric pharmacotherapy, 5(4):345-351, 2007.
- [Ho et al., 2014] J. C Ho, J. Ghosh, and J. Sun. Mar- ble: high-throughput phenotyping from electronic health records via sparse nonnegative tensor factorization. In ACM SIGKDD, pages 115-124. ACM, 2014.
- [Hoffman et al., 2013] M. D Hoffman, D. M Blei, C. Wang, and J. Paisley. Stochastic variational inference. JMLR, 14(1):1303-1347, 2013.
- [Hripcsak and Albers, 2013] Ge. Hripcsak and D. J Albers. Next-generation phenotyping of electronic health records. Journal of the American Medical Informatics Association, 20(1):117-121, 2013.
- [Kim and Oh, 2014] D. Kim and A. Oh. Hierarchical dirich- let scaling process. In ICML, pages 973-981, 2014.
- [Koren et al., 2009] Y. Koren, R. Bell, and C. Volinsky. Ma- trix factorization techniques for recommender systems. Computer, (8):30-37, 2009.
- [Lasko et al., 2013] T. A Lasko, J. C Denny, and M. A Levy. Computational phenotype discovery using unsupervised feature learning over noisy, sparse, and irregular clinical data. PloS one, 8(6):e66341, 2013.
- [Lehman et al., 2012] L. H Lehman, M. Saeed, W. J Long, J. Lee, and R. G Mark. Risk stratification of icu patients using topic models inferred from unstructured progress notes. In AMIA. Citeseer, 2012.
- [McCarty et al., 2011] C. A McCarty, R. L Chisholm, C. G Chute, I. J Kullo, G. P Jarvik, E. B Larson, R. Li, D. R Masys, M. D Ritchie, D. M Roden, et al. The emerge network: a consortium of biorepositories linked to elec- tronic medical records data for conducting genomic stud- ies. BMC medical genomics, 4(1):13, 2011.
- [Paisley et al., 2012] J. Paisley, C. Wang, D. M Blei, et al. The discrete infinite logistic normal distribution. Bayesian Analysis, 7(4):997-1034, 2012.
- [Pathak et al., 2013] J. Pathak, A. N Kho, and J. C Denny. Electronic health records-driven phenotyping: challenges, recent advances, and perspectives. Journal of the Amer- ican Medical Informatics Association, 20(e2):e206-e211, 2013.
- [Ranganath and Blei, 2015] Rajesh Ranganath and David Blei. Correlated random measures. arXiv preprint arXiv:1507.00720, 2015.
- [Saria and Goldenberg, 2015] S. Saria and A. Goldenberg. Subtyping: What it is and its role in precision medicine. IEEE Intelligent Systems, 30(4):70-75, 2015.
- [Saria et al., 2010] S. Saria, D. Koller, and A. Penn. Learn- ing individual and population level traits from clinical tem- poral data. In Proc. Neural Information Processing Sys- tems (NIPS), Predictive Models in Personalized Medicine workshop. Citeseer, 2010.
- [Sethuraman, 1994] J. Sethuraman. A constructive definition of dirichlet priors. Statistica sinica, pages 639-650, 1994.
- [Sundararajan et al., 2004] V. Sundararajan, T. Henderson, C. Perry, A. Muggivan, H. Quan, and W. A Ghali. New icd-10 version of the charlson comorbidity index predicted in-hospital mortality. Journal of clinical epidemiology, 57(12):1288-1294, 2004.
- [Teh et al., 2012] Y. W. Teh, M. I Jordan, M. J Beal, and D. M Blei. Hierarchical dirichlet processes. Journal of the american statistical association, 2012.
- [Tran et al., 2015] T. Tran, T. D. Nguyen, D. Phung, and S. Venkatesh. Learning vector representation of medical objects via emr-driven nonnegative restricted boltzmann machines (enrbm). Journal of biomedical informatics, 54:96-105, 2015.
- [Wang and Blei, 2011] C. Wang and D. M Blei. Collabora- tive topic modeling for recommending scientific articles. In ACM SIGKDD, pages 448-456. ACM, 2011.
- [Zhou et al., 2014] J. Zhou, F. Wang, J. Hu, and J. Ye. From micro to macro: data driven phenotyping by densifica- tion of longitudinal electronic medical records. In ACM SIGKDD, pages 135-144. ACM, 2014.
References were extracted automatically from the PDF and may contain errors.
Full text extracted automatically from the PDF; figures, tables and equations may differ. The PDF is the version of record.
1 Introduction
Discovering phenotypes, or clinical attributes, of each individual can be a solid foundation for understanding the latent pathology of complex diseases and preventing patients from potential risk of the diseases. This paper presents a phenotyping method to predict a human's medical status with electronic medical records, or EHR. The EHR phenotyping requires the estimation of the latent background on individual patients [Pathak et al., 2013], and the EHR phenotyping predicts observable medical status with the estimated latent variables to verify the validity of the estimated phenotypes. Therefore, this paper proposes a model 1) to discover latent phenotype patterns, or phenotype topics, which this paper refers to them as topics, and 2) to predict a patient's critical medical risk score, such as comorbidity and polypharmacy.
EHR phenotyping is difficult from three aspects. The first aspect is the combination of the unsupervised and the supervised learning tasks. The EHR phenotyping needs to extract the critical latent information from the collected EHRs, which falls under the unsupervised domain [Bellazzi and Zupan, 2008]. Then, the EHR phenotyping uses the latent information to predict the medical risks, which is a supervised learning task. Often, the difference of the two tasks made researchers to combine two different analysis models to pipeline, or batch-process, one analysis output to another in the step-wise manner. This pipelining of two separate models would limit the accuracy of the combined model because of two different learning objectives. Hence, an ideal model would combine two separate models into a single model by representing the unique structure of EHR for phenotyping. The second challenge is reflecting the medical domain characteristics in the learning model. The model should incorporate the medical data structure, and the model should anticipate and design potential noises and mixtures from the medical practices. The third difficulty is the scalability of the learning process. The phenotyping fields have noticed the importance of the subject sizes to retrieve the meaningful phenotyping results [Hripcsak and Albers, 2013].
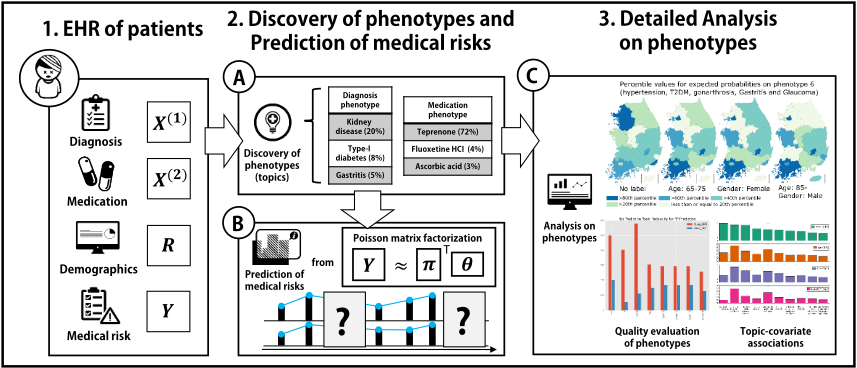
This paper introduces a new statistical model, Bayesian Nonparametric Collaborative Topic Poisson Factorization, or BN-CTPF, for EHR phenotyping. BN-CTPF extracts the demographic latent information by relating it to the prediction of medical risks. Specifically, BN-CTPF extracts phenotype topics, which are combinations of diagnosis and medication, then BN-CTPF infers the correlations, named as topic associations, between two topics. BN-CTPF models that the topic associations are indirectly linked to the patient demographic information, and we name these indirect links as topic-covariate associations. These topic-covariate associations provide multiple views on the phenotype topics with faceted demographics. Finally, BN-CTPF predicts the medical risks by combining the topic associations and the topiccovariate associations conditioned upon a patient's demographic background. These inferences are unified and scalable to optimize a single objective function unlike the previous pipelined approaches. The entire procedures and analyses of BN-CTPF is summarized by Figure 1. BN-CTPF is a consolidated statistical model that provides more statistically accurate predictions and more statistically coherent latent information. Also, BN-CTPF is able to analyze over one-million EHRs gathered at the national level by stochastic variational inference. Moreover, this is the first nonparametric model of the collaborative topic Poisson factorization, which utilizes a normalized gamma construction of hierarchical Dirichlet processes.
2 RelatedWork
The first subsection of the related work is on the automated phenotyping on EHR with the machine learning methodologies. The second subsection enumerates the previous contentbased recommendation studies, which BN-CTPF conceptually belongs to.
2.1 Automated EHR Phenotyping
While earlier works used knowledge-based approaches [McCarty et al., 2011], probabilistic topic models have been recently applied to the unsupervised EHR phenotyping. For example, latent Dirichlet allocation [Blei et al., 2003], or LDA, generates medial coherent concepts, or topics, which could be used for prediction tasks in the subsequent model. [Saria et al., 2010] suggested a nonparametric topic model with temporal aspects, and this model was applied to track physiological signals of premature infants from the topical perspective. They also used a separate supervised learning model to predict risks of infants. [Lehman et al., 2012] used hierarchical Dirichlet processes, or HDP [Teh et al., 2012], to learn topics from unstructured clinical notes, and they performed risk stratification for intensive care unit (ICU) patients with the topics. [Ghassemi et al., 2015] adopted multi-task Gaussian processes (GPs) along with topic models to summarize multivariate patients' physiological signals as well as topic proportions, and the extracted topic proportions are fed into the multi-task GPs to learn the kernel hyperparameters. They found that the inferred hyperparameters were useful in predicting the mortality with a separate logistic regression model. [Ghassemi et al., 2014] also used both topic modeling and SVM to predict patient mortality in a dynamic setting.
Some used other approaches besides of the probabilistic topic models. For instance, [Lasko et al., 2013] adopted a deep learning auto-encoder and GPs to extract representative features of 4,368 patients having either gout or acute leukemia. [Tran et al., 2015] utilized restricted Boltzmann machines (RBM) to derive a new representation of medical objects, such as diseases and procedures by mapping high-dimensional observations into a low-dimensional vector space. [Zhou et al., 2014] proposed a matrix imputation approach to remedy the noisy EHRs for the better phenotyping result. Recently, a tensor factorization-based approach [Ho et al., 2014], which decomposes multi-dimensional EHR observations into clinically meaningful tensors, or phenotypes, performed a separate prediction on heart failure by utilizing obtained phenotypes.
BN-CTPF improves the previous works by two aspects. The step-wise fashion of the previous works have limits in finding clinically meaningful phenotypes because the overall performance can be dominated by the chosen classifier. Furthermore, some classifiers involve onerous parameter tuning procedures that could be limited to a fixed phenotype. In contrast, BN-CTPF integrates two models to jointly optimize the phenotype discovery and the subsequent prediction. Additionally, BN-CTPF estimates the associations between environmental factors and phenotypes, yet the associations have not been inferred by most of the unsupervised approaches including the tensor factorization. The associations are keys in finding applicable research insights [Saria and Goldenberg, 2015]. For example, the existing models would not infer the relations between the patient's demographic background and the phenotypes, while this could be a useful source of information in the medical practices.
2.2 Content-Based Recommendation
In the machine learning field, there is much literature devoted to studies on collaborative filtering by matrix factorization for recommender systems. Under the assumption that users with similar records of events would share similar traits, the matrix factorization methods discover the lowdimensional latent factors which capture essential information for representing present records and predicting unobserved outcomes. Matrix factorization has been applied to a wide range of applications, i.e. recommender systems [Koren et al., 2009], document modeling [Canny, 2004], and disease risk prediction [Davis et al., 2010]. [Wang and Blei, 2011] developed collaborative topic regression, or CTR, to recommend scientific articles. CTR combines the matrix factorization with the topic modeling to collaboratively predict ratings and to learn topics. However, a matrix factorization of CTR assumes a rating following the Gaussian distribution which could be other distributions in some factors, particularly when observations are sparse with implicit feedback [Gopalan et al., 2013]. Therefore, [Gopalan et al., 2014] presented collaborative topic Poisson factorization, or CTPF, that replaces the Gaussian assumption in the rating prediction and the multinomial-Dirichlet distributions in the topic modeling with the Poisson and the Poisson-gamma distributions, respectively.
While the content-based recommendation models introduced above are useful in both recommending tailored items for users and providing interpretable reasons, there are three points that should be considered when applying those models to the EHR phenotyping. First, the models should be tailored to incorporate the EHR structure. For example, the relationship between diagnoses and medications should be treated by multiple types of observations, not a single type of observations (words) as in the topic models. Thus, we use the two different types of observations, diagnoses and medications, to learn the phenotypes with both distinct observations in EHRs. In addition, we use another type of observation, a patient medical risk score as a prediction target variable with Poisson factorization. Second, the model needs to consider that different medications are feasible for a single diagnosis in the medical practices. To enable this modeling, we design BN-CTPF to have a mixed-membership representation in the medications as well as another mixed-memberships in the diagnosis. The two mixed memberships are joined by the topic intensities at the patient dimension. Third, the EHR phenotyping for medical risk scores needs to optimize continuous measures, i.e. mean absolute error (MAE) and root mean squared error (RMSE), because the scores are inherently continuous. However, the surveyed models were evaluated under measures for categorical results, i.e. recall and precision.
3 Methodology
In this section, we present a detailed model description of BN-CTPF which is a Bayesian nonparametric extension of parametric CTPF. To compute posterior probabilities, we derive a mean-field stochastic variational inference algorithm to approximate it. We also provide a prediction procedure for unseen risk scores.
3.1 Model Description
BN-CTPF builds on the parametric CTPF that models both user-ratings and document-word counts by Poisson distributions. Unlike CTPF, BN-CTPF adopts a mixed-membserhip representation to describe medical contents, which are patients' diagnoses and medications. Each patient is realized from a mixture with components shared by all patients. This mixed-membership assumption allows the model to encode the heterogeneity of patients. In the perspective of topic modeling, BN-CTPF can be viewed as a collaborative extension of mixed-membership models built on HDP [Teh et al., 2012]. HDP have been widely used to model grouped data in the Bayesian nonparametrics literature. When it comes to modeling a mixture, the model with HDP allows the data to determine how many components are needed, which means that it can adaptively determine the model complexity as data become available.
Suppose that we have EHR containing three types of observations: VD unique diagnoses, VN unique medications, and clinical risk scores of M individual patients for P timesteps. We assume that each patient has records containing N medications and D diagnoses, but this assumption can be easily relaxed to indicate Nm and Dm by a patient m. Additionally, all patients have covariates rmj, where j = 1↪ ▷▷▷↪ J is the dimension of covariates. These covariates reflect the patient demographics, such age, gender, and region. For modeling convenience, we use medication words and diagnosis words to refer to medication and diagnosis records from each patient, respectively.
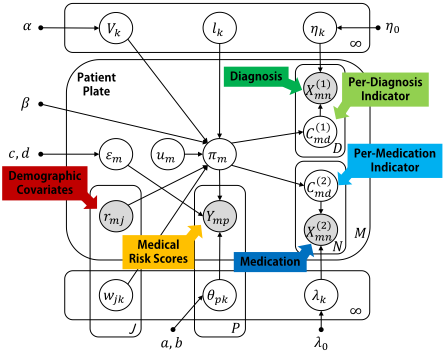
Let X(1) md denote which diagnosis is encoded in d-th record out of total D observed diagnoses for a patient m. X(2) mn defines the same meaning to indicate a medication record. BNCTPF infers phenotype topics from co-occurrence patterns from both diagnoses and medications. Figure 1 represents the inferred topics by two distincnt, yet coupled distributions over diagnoses and medications: a diagnosis topic ⌘k and a medication topic λk, where k = 1↪ ▷▷▷↪1. Clinical risk scores are subject to the prediction by the matrix factorization.
Here, we jointly model the latent phenotype topics and the risk scores. Let Y be an M by P matrix describing the longitudinal risk scores of each patient, where Ymp 2 ¶1↪ 2↪ 3↪ ▷▷♦ is the integer risk score of a patient m at a timestep p. BNCTPF assumes that Ymp follows a Poisson distribution with the inner product of (⇡m+✏m) and ✓p; where ⇡m is topic intensities of a patient m, ✏m is topic offsets, ✓p is topic intensities of the timestep p, and all of these are infinite dimensional nonnegative vectors. Topic offests ✏m are introduced to capture the inherent heterogeneity of individual patients, which is not fully explained by the topic intensities ⇡m.
We now describe a hierarchical Dirichlet process construction of BN-CTPF. For the top-level Dirichlet process (DP) we use stick-breaking processes [Sethuraman, 1994]:
where G0, H0, L0, and W0 are base measures of corresponding atoms. Also, lk is a d-dimensional latent location vector of topic k introducing topic associations, and wk is a weight parameter of topic k. For EHR with J demographic factors of each patient, wk becomes a J-dimensional parameter. Lastly, Vk is a top-level stick length, and ↵ is a top-level concentration parameter. Components of an atom G are as follows:
For the second-level construction, we utilize a normalized gamma construction [Paisley et al., 2012] to introduce topic assocations. We also combine the original construction with different one [Kim and Oh, 2014] to introduce topic-covariate associations. The second-level construction for describing patient-wise heterogeneity is as follows:
where β is a concentration parameter.
There is a recently published work [Ranganath and Blei, 2015], correlated random measures (CorrRM), which introduces a unified framework to generalize the construction processes of previous correlated random measures. BN-CTPF differs from CorrRM in that we consider additional dependency structures, named topic-covariate associations, which are not fully discussed in CorrRM. In order to model topiccovariate associations, we assume a Gaussian processe (GP)
with mean PJj=1 wkjrmj, a weighted average of observed covariates. Unlike our model, CorrRM considers a GP with a random mean vector, and it can be viewed as a funciton of latent covariates. While the GP framework is not introduced in our notation, the generative processes can be easily transformed into a GP notation as shown in [Paisley et al., 2012].
The d-dimensional vector um is a latent location vector of a patient m, and F controls the degree of latent topic intensities. For example, as the distance between two location vectors lk and um is getting closer or a weight parameter wkj grows, the topic intensity ⇡mk increases. From the two-level construction, we can ensure that all atoms (⌘k↪ λk↪ lk↪ wk)1k=1 are shared across the entire patients with different degrees of exhibition.
Finally, we describe a generative process for 1) observed diagnoses and medications in patients; and 2) observed individual risk scores under BN-CTPF:
- For each topic k = 1↪ ▷▷▷↪1 and timestep p = 1↪ ▷▷▷↪ P :
- For each patient m= 1↪ ▷▷▷↪M:
- (a) For each diagnosis word d = 1↪ ▷▷▷↪ D:
- (b) For each medication word n = 1↪ ▷▷▷↪ N:
- (a) For each topic k = 1↪ ▷▷▷↪1:
- (b) For each timestep p = 1↪ ▷▷▷↪ P:
where C (1) md and C (2) mn are a per-diagnosis and a permedication topic indicators, respectively. Figure 2 shows the plate notation of BN-CTPF. We omit several base measures and priors such as G0, G, and Gm for simplicity.
3.2 Stochastic Variational Inference of BN-CTPF
In many hierarchical Baysian models incluing nonparametric models, computing an exact posteior is intractable. Therefore, we derive a stochastic variational inference (SVI) algorithm based on mean-field variational families [Hoffman et al., 2013]. To faciliate the posterior inference of BN-CTPF like the inference of CTPF [Gopalan et al., 2014], we should incorporate two kinds of auxiliary latent variables for risk scores Ymp. The first auxiliary latent variable is K latent variables Z amp↪k ⇠ Poisson(⇡mk✓pk), and the second one is K latent variables Z bmp↪k ⇠ Poisson(✏mk✓pk).
Next, we posit the fully factorized variational families.
where T is the truncation level and Zmp = (Z amp ↪Z bmp ). We assume that the following variational distribution for each variable,
where the set of these distributions are parameterized by their own variational parameters, denoted by . At each iteration t, we select 1) a set of observations, ⌦Bt , from the subset patients, Bt ⇢ ¶1↪ ▷▷▷M♦; 2) a set of given batch-specific variatoinal parameters Bt ; and 3) a set of global variational parameters 0 . With these three sets of information, BN-CTPF stochastically optimizes the following objective function:
where ⌦, ⇥, and H[Q] denote all observations, hidden variables, and an entropy of Q distribution, respectively. Additionally, ⇥m and ⇥0 denote a set of batch-specific hidden variables and a set of global hidden variables, respectively.
In the local updates of SVI, at each iteration t, we update the variational distributions over ⇥m for m 2 Bt until they converge by using closed-form equations while holding fixed 0 . In the global updates of SVI, we update the variational distributions over ⇥0 by taking a gradient step, multiplied by a precondition matrix G 0 . We use the inverse Fisher information or inverse negative Hessian as a precondition matrix:
where ˜r L := G r L is a natural gradient of 2 0 , and ⇢t > 0 is a step size satisfying the convergence condition. The overall update information is summarized in Table 1.
3.3 Prediction
After the entire variational parameters are learned, BNCTPF predicts individual risk scores Y . Specifically, given patients excluded from a training set, we predict the risk scores Ymp of a patient m at the timestep p, by their posterior expected Poisson parameters.
We can approximate the posterior distributions of ⇡m and ✏m by the SVI for BN-CTPF from Section 3.2.
4 Results
We demonstrate the applicability of BN-CTPF on EHR phenotyping with three experimental results. First, we provide error metrics to evaluate the performance of risk score predictions by Poisson factorization. Second, we performed a quantitative evaluation of phenotypes through the computation of heldout predictive perplexity (PPX). Finally, we analyze the various inter-dependency patterns which are represented by topic associations and topic-covariate associations by exploring the differences on intensities of a certain phenotypes as demographic factors vary.
4.1 Data Description and Experimental Design
We used a National Patient Sample (NPS) that is provided from Health Insurance Review and Assessment (HIRA), which is a public institution of Republic of Korea. We use 2011 NPS dataset, which is accessible after registrations, of both inpatients and outpatients. The dataset includes the entire prescription records of approximately 1.1 million patients. All diagnoses and medications are encoded in the prescription records. We select the subset of patients who are older than or equal to 65 years.
Although the large amount of data promises myriad ways of healthcare applications, the dataset lacks detailed information in some aspects. For instance, the NPS dataset has no physiolocal signals and lab test results. Thus, we calculate Charlson's comorbidity index (CMB) [Sundararajan et al., 2004] and polypharmacy (PP) scores [Hajjar et al., 2007] to use these values as potential medical risk scores. The potential risk of CMB and PP has been a traditional subject matter of research in medicine [Evans et al., 2012]. The selected subset for experiments includes 158,630 patients, 3,156,234 prescription records, 9,138 unique diagnoses, and 2,256 unique medications. The average number of unique medications and diagnoses per patient are 82.022 and 39.790, respectively.
We set hyperparameters as follows: ↵ = 20↪ β = 5↪ T = 200↪ d = 20↪ σ2 ▷ = 1 250 ↪ ⇢t = (25+ t)-0▷9 , and ♣Bt♣ = 1↪ 024. All topic Dirichlet hyperparameters are fixed by 0.1. We set training and heldout ratio by 80:20. The algorithm terminates when the fractional change in the validation probability falls below 10-3 , where we set aside 1% of training data as a validations set for convergence checking.
We introduce the following alternative models to compare performances. Specifically, to compare the error metrics, we adopt the following models: Poisson factorization,
| Variable | Type | Udpate Information |
|---|---|---|
| C (1) md | Closed-form | φ(1) md↪k / exp nEq [log ⌘k↪X(1) ] + Eq [log ⇡mk ]o |
| C (2) mn | Closed-form | md φ(2) mn↪k / exp nEq [log λk↪X(2) mn ] + Eq [log ⇡mk ]o |
| Zmp | Closed-form | φ(3) mp↪k / ⇢exp¶Eq[log⇡mk] +Eq [log ✓pk]♦ for k = 1↪ ▷▷▷↪ T exp¶Eq[log ✏mk] +Eq [log ✓pk]♦ for k = T +1↪ ▷▷▷↪ 2T |
| ⇡mk | Closed-form | a⇡mk = βpk + Pd φ(1) md↪k + Pn φ(2) mn↪k + PTt=1 Ymtφ(3) mt↪k b⇡mk = Nm+Dm Pk Eq[⇡mk] + Pt Eq [✓pk] + exp ⇣- ˆ Fmk ⌘ |
| ✏mk | Closed-form | a✏mk = c + P2T t=T+1 Ymtφ(3) mt↪k b✏mk = d + Pt Eq [✓pk] |
| um | Gradient | @L @ˆum = - 1 σ2u ˆum + Pk ˆlk ✓-βp+ Eq[⇡mk] exp( ˆ Fmk) ◆ |
| ✓pk | Natural gradient | @a✓kt = -a✓kt +a+ M ♣Bt♣ nPm Ymtφ(3) mt↪k2¶1:T ♦ + Pm Ymtφ(3) mt↪k2¶T +1:2T ♦o @b✓kt = -b✓kt + b + M ♣Bt♣ Pm ¶Eq [⇡mk] + Eq [✏mk]♦ |
| ⌘k | Natural gradient | @γ ⌘ k↪l = -γ ⌘ k↪l + ⌘0 + M ♣Bt♣ Pm Pd φ(1) md↪k 1 hX(1) md = li for l = 1↪ ▷▷▷↪ VD |
| λk | Natural gradient | @γ λ k↪l = -γ λ k↪l +λ0 + M ♣Bt ♣ Pm Pn φ(2) mn↪k 1 hX(2) mn = li for l = 1↪ ▷▷▷↪ VN |
| wkj | Gradient, Hessian | @L @ ˆwkj = - ˆwkj σ2w + M ♣Bt♣ Pm rmj ✓-βpk + Eq[⇡mk] exp( ˆ Fmk) ◆ @ 2L @ ˆwkj@ ˆw0kj = -1 [j = j 0 ] 1 σ2w - Pm2♣Bt♣ r0mj rmj ✓ Eq[⇡mk] exp( ˆ Fmk) ◆ |
| lk | Gradient, Hessian | @L @ˆlk = - ˆlk σ2 l + M ♣Bt♣ Pm2♣Bt♣ ˆum ✓-βpk + Eq[⇡mk] exp( ˆ Fmk) ◆ @ 2L @ˆlk@ˆl0k = - Id σ2 l - Pm2♣Bt♣ ˆumˆuTm ✓ Eq[⇡mk] exp( ˆ Fmk) ◆ |
| Vk | Gradient, Hessian | @L @Vk = - ↵-1 (1- ˆ Vk) - βpk ˆ Vk h M ♣Bt♣ Pm2♣Bi♣ n ˆ Fmk -Eq [log⇡mk]o + M ♣Bt♣ (βpk)i + PTl=k+1 βpl (1- ˆ Vk) h M ♣Bt♣ Pm2♣Bi♣ n ˆ Fml -Eq [log⇡ml]o + M ♣Bt♣ (βpl)i @ 2L @ ˆ V 2 k = - ↵-1 (1- ˆ Vk)2 - pk ˆ Vk hβ2 ♣Bt♣ 0 (βpk) pk ˆ Vk i + PTl=k+1 pl (1- ˆ Vk) hβ2 ♣Bt♣ 0 (βpl) pl ˆ Vl i @ 2L @ ˆ Vk@ ˆ Vr = βpk ˆ Vk(1- ˆ Vr) nPm2♣Bt♣ ⇣ ˆ Fmk -Eq [log⇡mk]⌘ + ♣Bt♣ (βpk)o + β2 pk ˆ Vk n♣Bt♣ 0 (βpk) pk 1- ˆ Vr o - PTl=k+1 βpl (1- ˆ Vk)(1- ˆ Vr) nPm2♣Bt♣ ⇣ ˆ Fml -Eq [log⇡ml]⌘ + ♣Bt♣ (βpl)o - β2 pl (1- ˆ Vk) 0 (βpl) pl 1- ˆ Vr (for r < k) |
- PTl=k+1
or PF, CTPF, and CTR. Also, we use a variations of BNCTPF by limiting some of modeled features, so we can measure the effect of topic associations and topic-covariate associations. All parametric models have a latent dimension of K = 200. For the hyperparameter selection, we use validation datasets to tune to the optimal setting. Accordingly, the shape and the rate parameters of gamma distributions for Poisson factorization-based models are fixed as 0.3 like CTPF. Content-based recommendation models are initialized by the learned parameters from LDA [Blei et al., 2003].
PF [Gopalan et al., 2013]. PF is a simple model that fac- Vk) n♣Bt♣ 0 (βpl) pl Vr o (for r < k)
torizes risk scores without contents information.
CTPF [Gopalan et al., 2014]. That is one of the main components of BN-CTPF. CTPF is a parametric model and factorizes risk scores with a single source of information, so CTPF only utilizes either medications or diagnoses.
CTR [Wang and Blei, 2011]. Original CTR does not scale to massive datasets. Thus, we fix topics and patient-topic proportions to their LDA values, and it is known that the performance resembles an original CTR. CTR also suffers from the problem of the single source information.
HDP-PF, DILN-PF and HDSP-PF. A variation of BN-
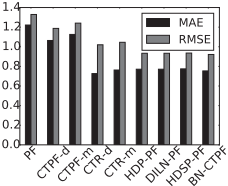
(a) CMB Prediction Errors.
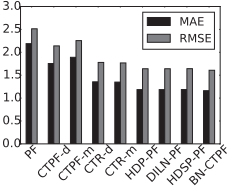
(b) PP Prediction Errors.
- (a) PPX of models on CMB.
(b) PPX of models on PP.
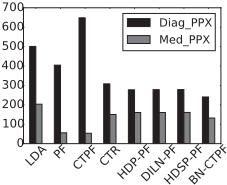
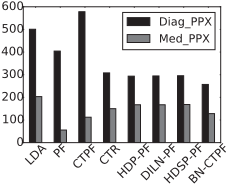
Figure 4: Comparisons of Predictive Perplexity for phenotyping quality.
CTPF which excludes the corresponding part of topic assocations and topic-covariate associations. HDP-PF can be seen as a combination of HDP and PF. DILN-PF and HDSP-PF correspond to a Poisson factorization extension from [Paisley et al., 2012] and [Kim and Oh, 2014], respectively.
4.2 Performances onMedical Risk Predictions
The joint modeling of BN-CTPF can evaluate the validity of phenotypes by calculating MAE and RMSE, while extracting phenotypes simultaneously. We calculate MAE and RMSE on two target medical risks: comorbidity and polypharmacy. Following [Asuncion et al., 2009], we randomly partition each patient from the heldout data into two halves; and we evaluate the conditional distribution of the second half given the first half and the training data. The first half data is used to estimate the local variational parameters for each patient. Given global variational parameters learned in a training procedure, the predicted risk is given by the conditional expectation in Eq. (1).
From the Figure 3, we show that BN-CTPF outperforms other models on MAE and RMSE, except for MAE in the CMB risk score. It should be noted that BN-CTPF ourperformes every other model in RMSE. The result illustrates the following statements: 1) reflecting the heteregeneous characteristics of EHR is useful in predicting medical risks and 2) utilizing learned various associations can potentially boost the performance of EHR phenotyping. Additionally, a nonparametric model might provide the capability for adapting a model complexity which leads to better performances.
4.3 Quantitative Evaluation of Phenotypes
We utilize PPX to evaluate the phenotyping quality. Although PPX is widely used to evalute topic models and matrix factorization, most previous work on unsupervised EHR phenotyping did not utilize the metric to evaluate a quality of phenotypes. We compute PPX with the same manner as in Section 4.2. More formally, we denote the training data D and a heldout data X. Formally, we divide the heldout data into two havles X 0 and X 00 . The per-word perplexity on the second half of the heldout data is given by exp¶-log p(X 00 ♣X 0 )◁N♦, where N is the number of observations constituting X 00 . Since it is intractble to compute the exact value of the marginal probability p (X 00 ♣X 0 ), we approximate the marginal probability by the variational inference algorithm that we described in Section 3.2. The lower perplexity indicates the better generalization performance, and it does not rely on the KL divergence between a variational distribution and a true posterior which is relevant to our objective function.
Figure 4 provides the PPX of several baseline models. Since each phenotype consists of diagnoses and medications, two PPX values can be calculated from diagnoses and medications, respectively. BN-CTPF achieved the best performance in diagnosis phenotype modeling, but it was less generalizable in the medication phenotype modeling. We conjecture that there might exist the distributional difference between the medication and the diagnoses, and the Poisson distribution is more proper in modeling the medication phenotypes, rather than the multinomial distribution used in BNCTPF. We note that the PPX value of a three-way Poisson tensor factorization which is similar to early studies [Ho et al., 2014] is about 4,000. While the value of PPX is greatly larger than other models, it should not be compared at the same level since the Poisson tensor factorization has to consider the combinatorial space of diagnoses and medications, which is larger than other models.
4.4 Phenotypes and Demographics
Analyzing the relationship between phenotypes and patient demograhpics reveals a deeper understanding on the demographic-specfic diseases and medications, and this enables setting a better healthcare policy and medical risk management. Figure 5(a) illustrates the phenotype-age and - gender associations by enumerating the expected top ten phenotype probabilities conditioned upon the demographics, where the topics are sorted by their posterior word counts. We found a strong relationship between the comorbidity status with hypertension and type-II diabetes (T2DM) (phenotype 6) and the aged 65-75 elderly. An older group with age ≥ 85 is strongly related to the respiratory diseases (phenotype 2). It should be noted that there exists different medication patterns of similar diagnosis phenotypes. For example, phenotype 1, 6, 7, and 9 indicate the complications of hypertension and T2DM, but their medication patterns are different. The correlations between topics, or phenotypes, in Figure 5(b) state which phenotypes are similar when jointly considering medications and diagnoses. The correlation coefficients are calculated by taking the dot product of the topic locations, lT k lk0 .
Hypertension
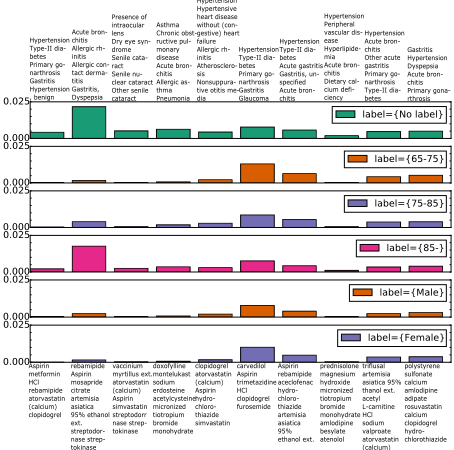
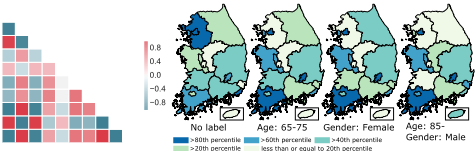
Figure 5: Phenotype representations and correlations.
Lastly, we explore the regional difference of phenotype probabilities. Figure 5(c) illustrates the clear difference among regions in exhibiting phenotypes with or without demographics.
5 Conclusion
This paper introduces BN-CTPF to extract phenotypes from EHR and to predict medical risks. BN-CTPF outperforms models that are either general-purposes or pipelined by analytic steps. BN-CTPF analyzes EHR with over three million prescriptions, and the result provides more accurate medical risks per demographics and why.
Acknowledgments
This research was supported by the Korean ICT R&D program of MSIP/IITP (R7117-16-0219, Development of Predictive Analysis Technology on Socio-Economics using SelfEvolving Agent-Based Simulation embedded with Incremental Machine Learning). The data used for this study are obtained from HIRA-NIS-2011-0058 provided by Health Insurance Review & Assessment Service. The results of this study are unrelated to the Ministry of Health and Welfare (MW) and HIRA. We thank the four anonymous reviewers for their valuable comments on our manuscript. We also thank Prof. Minki Kim for preprocessing the HIRA dataset.
@inproceedings{ijcai2016p362,
  title     = {Bayesian Nonparametric Collaborative Topic Poisson Factorization for Electronic Health Records-Based Phenotyping},
  author    = {Lee, Wonsung and Lee, Youngmin and Kim, Heeyoung and Moon, Il-Chul},
  booktitle = {Proceedings of the Twenty-Fifth International Joint Conference on
               Artificial Intelligence, {IJCAI-16}},
  publisher = {AAAI Press / International Joint Conferences on Artificial Intelligence},
  editor    = {Subbarao Kambhampati},
  pages     = {2544--2551},
  year      = {2016},
  month     = {7},
  url       = {https://ijcai.org/proceedings/2016/362},
}
TY - CPAPER TI - Bayesian Nonparametric Collaborative Topic Poisson Factorization for Electronic Health Records-Based Phenotyping AU - Lee, Wonsung AU - Lee, Youngmin AU - Kim, Heeyoung AU - Moon, Il-Chul T2 - Proceedings of the Twenty-Fifth International Joint Conference on Artificial Intelligence, IJCAI-16 PB - AAAI Press / International Joint Conferences on Artificial Intelligence PY - 2016 SP - 2544 EP - 2551 UR - https://ijcai.org/proceedings/2016/362 ER -Copied
Machine-readable versions of this paper, for tools and AI agents:





