
How to Build Your Network? A Structural Analysis
Proceedings of the Twenty-Fifth International Joint Conference on Artificial Intelligence. Pages 2597-2602.
Abstract
Creating new ties in a social network facilitates knowledge exchange and affects positional advantage. In this paper, we study the process, which we call network building, of establishing ties between two existing social networks in order to reach certain structural goals. We focus on the case when one of the two networks consists only of a single member and motivate this case from two perspectives. The first perspective is socialization: we ask how a newcomer can forge relationships with an existing network to place herself at the center. We prove that obtaining optimal solutions to this problem is NP-complete, and present several efficient algorithms to solve this problem and compare them with each other. The second perspective is network expansion: we investigate how a network may preserve or reduce its diameter through linking with a new node, hence ensuring small distance between its members. For both perspectives the experiment demonstrates that a small number of new links is usually sufficient to reach the respective goal.
- [Andrew, 2010] Simon A. Andrew. Adaptive versus restric- tive contracts: Can they resulve different risk problems? In R. Feiock and J. Scholz, editors, Self-Organizing Federal- ism: Collaborative Mechanisms to Mitigate Institutional Collective Action Dilemmas. Cambridge University Press, 2010.
- [Barbási and Albert, 1999] Albert-László Barbási and Réka Albert. Emergence of scaling in random networks. Science, 286(5439):509-512, Oct 1999.
- [Barthèlemy, 2004] Marc Barthèlemy. Betweenness central- ity in large complex networks. Eur. Phys. J. B, 38:163- 168, 2004.
- [Calude et al., 1997] Cristian Calude, Elena Calude, and Bakhadyr Khoussainov. Deterministic automata simula- tion, universality and minimality. Annals of Pure and Ap- plied Logic, 90:263-276, 1997.
- [Donetti et al., 2005] Luca Donetti, Pablo I. Hurtado, and Miguel A. Munoz. Entangled networks, synchroniza- tion and optimal network topology. Phys. Rev. Lett., 95(188701), 2005.
- [Duckworth and Mans, 2005] William Duckworth and Bernard Mans. Randomized greedy algorithms for finding small k-dominating sets of regular graphs. Random Structures and Algorithms, 27(3):401-412, 2005.
- [Garey and Johnson, 1979] Michael R. Garey and David S. Johnson. Computers and Intractability: A Guide to the Theory of NP-Completeness. W.H.Freeman, 1979.
- [Granovetter, 1973] Mark S. Granovetter. The strength of weak ties. The American Journal of Sociology, 78(6):1360-1380, 1973.
- [Jablin and Krone, 1987] Frederic M. Jablin and Kathleen J. Krone. Organizational assimilation. In C. Berger and S.H. Chaffee, editors, Handbook of communication sci- ence, pages 711-746. Sage, 1987.
- [Jackson, 2004] Matthew O. Jackson. A survey of models of network formation: Stability and efficiency. In G. De- mange and M. Wooders, editors, Group Formation in Eco- nomics; Networks, Clubs and Coalitions. Cambridge Uni- versity Press, 2004.
- [Jackson, 2006] Matthew O. Jackson. The economics of so- cial networks. In Richard Blundell, Whitney Newey, and Torsten Persson, editors, Proceedings of the 9th World Congress of the Econometric Society. Cambridge Univer- sity Press, 2006.
- [Kleinberg et al., 2008] Jon Kleinberg, Siddharth Suri, Eva Tardos, and Tom Wexler. Strategic network formation with structural holes. ACM SIGecom Exchanges, 7(3), Novem- ber 2008.
- [Leskovec et al., 2007] Jure Leskovec, Jon Kleinberg, and Christos Faloutsos. Graph evolution: Densification and shrinking diameters. ACM Transactions on Knowledge Discovery from Data (ACM TKDD), 1(1), 2007.
- [Leskovec et al., 2009] Jure Leskovec, Kevin J. Lang, Anir- ban Dasgupta, and Michael Mahoney. Community struc- ture in large networks: Natural cluster sizes and the ab- sence of large well-defined clusters. Internet Mathematics, 6(1):29-123, 2009.
- [Liu and Moskvina, 2015] Jiamou Liu and Anastasia Moskvina. Hierarchies, ties and power in organizational networks: Model and analysis. In ASONAM '15 Proceed- ings of the 2015 IEEE/ACM International Conference on Advances in Social Networks Analysis and Mining, pages 202-209, 2015.
- [Lokshtanov et al., 2013] Daniel Lokshtanov, Neeldhara Misra, Geevarghese Philip, M. S. Ramanujan, and Saket Saurabh. Hardness of r-dominating set on graphs of diameter (r 1). In Proceeds of the 8th International Symposium Parameterized and Exact Computation (IPEC 2013), pages 255-267, Sophia Antipolis, France, September 2013.
- [McAuley and Leskovec, 2012] Julian McAuley and Jure Leskovec. Learning to discover social circles in ego net- works. In The Twenty-sixth Annual Conference on Neural Information Processing Systems, 2012.
- [Morrison, 2002] Elizabeth W. Morrison. Newcomers' rela- tionships: The role of social network ties during socializa- tion. The Academy of Management Journal, 45(6):1149- 1160, 2002.
- [Newman et al., 2002] Mark E. Newman, Duncan J. Watts, and Steven H. Strogatz. Random graph models of so- cial networks. Proc. Nat. Acad. Sci. USA, 99:2566-2572, 2002.
- [Sherman et al., 1986] J.Daniel Sherman, Howard L. Smith, and Edward R. Mansfield. The impact of emergent net- work structure on organizational socialization. Journal of Applied Behavioral Science, 22:53-63, 1986.
- [Stein, 2012] William A. Stein. Sage -a computer system for algebra and geometry experimentation. Technical re- port, 2012. http://wstein.org/sage.html. Link
- [Stuart, 1998] Toby E. Stuart. Network positions and propensities to collaborate: An investigation of strategic alliance formation in a high-technology industry. Admin- istrative science quarterly, 43(3):668-698, Sep. 1998.
- [Uzzi and Dunlap, 2005] Brian Uzzi and Shannon Dunlap. How to build your network. Harvard Business Review, 83(12):53-60, Dec 2005.
- [Wang and Chen, 2003] Xiaofan Wang and Guanrong Chen. Complex networks: Small-world, scale-free and beyond. IEEE circuits and systems magazine, pages 6-20, First Quarter 2003.
References were extracted automatically from the PDF and may contain errors.
Full text extracted automatically from the PDF; figures, tables and equations may differ. The PDF is the version of record.
1 Introduction
The creation of interpersonal ties has been a fundamental question in the structural analysis of social networks. While strong ties emerge between individuals with similar social circles, forming a basis of trust and hence community structure, weak ties link two members who share few common contacts. The influential work of Granovetter reveals the vital roles of weak ties: It is weak ties that enable information transfer between communities and provide individuals positional advantage and hence influence and power [Granovetter, 1973].
Natural questions arise regarding the establishment of weak ties between communities: How to merge two departments in an organization into one? How does a company establish trade with an existing market? We refer to such questions as network building. The basic setup involves two networks; the goal is to establish ties between them to achieve certain desirable properties in the combined network. A reallife example of network building is the inter-marriages between members of the Medici, the leading family of Renaissance Florence, and numerous other noble Florentine fami-
Jiamou Liu
University of Auckland Auckland, New Zealand jiamou.liu@auckland.ac.nz
lies, towards gaining power and control over the city[Jackson, 2006]. Another example is by Paul Revere,a prominent Patriot during the American Revolution, who strategically created social ties to raise a militia [Uzzi and Dunlap, 2005].
The examples of the Medici and Paul Revere pose a more restricted scenario of network building: Here one of the two networks involved is only a single node, and the goal is to establish this node in the other network. We motivate this setup from two directions: 1) This setup amounts to the problemof socialization: the situation when a newcomer joins a network as an organizational member. A natural question for the newcomer is the following: How should I forge new relationships in order to take an advantageous position in the organization? As indicated in [Morrison, 2002], socialization is greatly influenced by the social relations formed by the newcomer with "insiders" of the network. 2) This setup also amounts to the problem of network expansion. For example, an airline expands its existing route map with a new destination, while trying to ensure a small number of legs between any cities.
Distance is an important measure of the amount of influence one may exert to another in the network [Leskovec et al., 2007]. The radius of a network refers to the maximal distance from a central member to all others in a network. Hence when a newcomer joins an established network, it is in the interest of the newcomer to keep her distance to others bounded by the radius. The diameter of a network refers to the longest distance between any two members. It has long been argued from network science that small-world property - the property that any two members of a network are linked by short paths - improves network robustness and facilitates information flow [Wang and Chen, 2003]. Hence it is in the interest of the network to keep the diameter small as the network expands. Furthermore, each relation requires time and effort to establish and maintain; thus one is interested in minimizing the number of new ties while building a network.
Contribution. The novelty of this work is in proposing a formal, algorithmic study of organizational socialization. More specifically we investigate the following network building problems: Given a network G, add a new node u to G and create as few ties as possible for u such that:
- u is in the center of the resulting network; or
- the diameter of the resulting network is not larger than a specific value.
Intuitively, (1) asks how a newcomer u may optimally connect herself with members of G, so that she belongs to the center. We prove that this problem is in fact NP-complete (Theorem 1). Nevertheless, we give several efficient algorithms for this problem; in particular, we demonstrate a "simplification" process that significantly improves performance. Intuitively, (2) asks how a network may preserve or reduce its diameter by connecting with a new member u. We show that "preserving the diameter" is trivial for most real-life networks and give two algorithms for "reducing the diameter". We experimentally test and compare the performance of all our algorithms. Quite surprisingly, the experiments demonstrate that a very small number of new edges is usually sufficient for each problem even when the graph becomes large.
Related works. This work is predated by organizational behavioral studies [Sherman et al., 1986; Jablin and Krone, 1987; Morrison, 2002], which look at how social ties affect a newcomer's integration to the organization. Uzzi and Dunlap in [2005] argue brokers - those who bridge and connect to diverse groups of individuals - enable good network building; creating ties with brokers, and even becoming a broker oneself allows a person to access private information, wide skill set and hence gain power. Network building has also been applied to various other contexts such as economics (strategic alliance of companies) [Stuart, 1998] and governance (forming inter-government contracts) [Andrew, 2010]. Compared to these works, the novelty here is in proposing a formal framework of network building, which employs techniques from complexity theory and algorithmics.
This work is also related to two forms of network formation: dynamic models and agent-based models, both aim to capture the natural emergence of social structures [Jackson, 2006]. The former originates from random graphs, viewing the emergence of ties as a stochastic process which may or may not lead to an optimal structure [Donetti et al., 2005; Calude et al., 1997]. The latter comes from economics, treating a network as a multiagent system where utilitymaximizing nodes establish ties in a competitive setting [Kleinberg et al., 2008; Jackson, 2004]. Our work differs from network formation as the focus here is on calculated strategies that achieve desirable goals in the combined network.
2 Networks Building: The Problem Setup
We view a network as an undirected unweighted connected graph G = (V↪ E) where V is a set of nodes and E is a set of (undirected) edges on V . We denote an edge ¶u↪ v♦ as uv. If uv 2 E then v is said to be adjacent to u. A path (of length k) is a sequence of nodes u0↪ u1↪ ▷ ▷ ▷ ↪ uk where uiui+1 2 E for any 0 i < k. The distance between u and v, denoted by dist(u↪ v), is the length of a shortest path from u to v. The eccentricity of u is ecc(u) = maxv2V dist(u↪ v). The diameter of the network G is diam(G) = maxu2V ecc(u). The radius rad(G) of G is minu2V ecc(u). The center of G is the set C(G) = ¶u 2 V ♣ ecc(u) = rad(G)♦.
Definition 1. Let G = (V↪E) be a network and u be a node not in V . For S ✓ V , denote by ES the set of edges ¶uv ♣ v 2 S♦. Define G ⊕S u as the graph (V [ ¶u♦↪ E [ ES).
We require that S6=? and thus G⊕S u is a network built by incorporating u into G. By [Uzzi and Dunlap, 2005], for a newcomer u to establish herself in G it is essential to identify information brokers who connect to diverse parts of the network. Following this intuition, we define a broker set as any S ✓ V such that ecc(u) = rad(G⊕S u); namely, linking with S enables u to get in the center of the network.
Formally, given a network G = (V↪ E), the problem of network building for u means selecting a set S ✓V so that the combined network G⊕S u satisfies certain conditions. Moreover, the desired set S should contain as few nodes as possible. We focus on the following two key problems:
- BROKER: S is a broker set.
- DIAM∆: diam(G⊕Su)∆ for a given ∆ diam(G).
In the network G ⊕V u, ecc(u) = 1 = rad(G ⊕V u) and diam(G ⊕V u) = 2. Hence a desired S must exist for BROKER and DIAM∆ where ∆ ≥ 2. In the subsequent sections we systematically investigate these two problems.
3 How to Be in the Center? Complexity and Algorithms for BROKER
3.1 Complexity
We investigate complexity of the problem BROKER(G↪ k): Given G↪ k, does G have a broker set of size k?
The problem is trivial if G has radius 1, as then V is the only broker set. When rad(G) > 1, we recall the notion of dominating set, which refers to a set S of nodes where every node not in S is adjacent to at least one member of S. The domination number γ(G) is the size of a smallest dominating set for G. The DOM(G↪ k) problem concerns testing whether γ(G) k for a given graph G and input k; it is a classical NP-complete decision problem [Garey and Johnson, 1979].
Theorem 1. BROKER(G↪ k) is NP-complete.
Proof. BROKER(G↪ k) is clearly in NP. Therefore we only show NP-hardness. We present a reduction from DOM(G↪ k) to BROKER(G↪ k). Note that when rad(G) = 1, γ(G) = 1. Hence DOM(G↪ k) remains NP-complete if we assume rad(G) > 1. Given a graph G = (V↪ E) where rad(G) > 1, we construct a graph H. The set of nodes in H is ¶vi ♣ v 2 V↪ 1 i 3♦. The edges of H are as follows:
- ÷ Add an edge v1w1 for every v↪ w 2 V
- ÷ Add an edge vivi+1 for every v 2 V , 1 i < 3
- ÷ Add an edge v2w2 for every edge vw 2 E
Namely, for each node v 2 V we create three nodes v1↪ v2↪ v3 which form a path. We link the nodes in ¶v1 ♣ v 2 V ♦ to form a complete graph, and nodes in ¶v2 ♣ v 2 V ♦ to form a copy of G. Since rad(G) ≥ 2, for each node v 2 V there is w 2 V with dist(v↪w) ≥ 2. Hence in H, dist(v3↪w3) ≥ 4, and dist(v2↪ w3) ≥ 3. As the longest distance from any v1 to any other node is 3, we have rad(H) = 3.
Suppose S is a dominating set of G. If we add all edges uv where v 2 D = ¶v2 ♣ v 2 S♦, ecc(u) = 3 = rad(H ⊕D u). Hence D is a broker set for H. Thus the size of a minimal broker set of H is at most the size of a minimal dominating set of G. Conversely, for any set D of nodes in H, define the projection p(D) = ¶v ♣ vi 2 D for some 1 i 3♦.
Suppose p(D) is not a dominating set of G. Then there is some v 2 V such that for all w 2 p(D), dist(v2↪w2) ≥ 2. Thus if we add all edges in ¶ux ♣ x 2 D♦, dist(u↪ v3) ≥ 4. But then ecc(w1) = 3 for any w 2 p(D). So D is not a broker set. This shows that the size of a minimal dominating set of G is at most the size of a minimal broker set.
The above argument implies that the size of a minimal broker set for H coincides with the size of a minimal dominating set for G. This finishes the reduction and hence the proof.
3.2 Efficient Algorithms
Theorem 1 implies that computing optimal solution of BROKER is computationally hard. Nevertheless, we next present a number of efficient algorithms that take as input a network G = (V↪ E) with radius r and output a small broker set S for G. A set S ✓ V is called sub-radius dominating if for all v 2 V not in S, there exists some w 2 S with dist(v↪w) < r. Our algorithms are based on the following fact, which is clear from definition:
Fact 1. Any sub-radius dominating set is also a broker set.
(a) Three greedy algorithms. We first present three greedy algorithms; each algorithm applies a heuristic that iteratively adds new nodes to the broker set S. The starting configuration is S = ? and U = V . During its computation, the algorithm maintains a subgraph F = (U↪ E↾U), which is induced by the set U of all "uncovered" nodes, i.e., nodes that have distance > (r - 1) from any current nodes in S. It repeatedly performs the following operations until U = ?, at which point it outputs S:
- Select a node v 2 U based on the corresponding heuristic and add v to S.
- Compute all nodes at distance at most (r - 1) from v. Remove these nodes and all attached edges from F .
Algorithm 1: Max (Max-Degree). The first heuristic is based on the intuition that one should connect to the person with the highest number of social ties; at each iteration, it adds to S a node with maximum degree in the graph F .
Algorithm 2: Btw (Betweenness). The second heuristic is based on betweenness, an important centrality measure in networks [Barth`elemy, 2004]. More precisely, the betweenness of a node v is the number of shortest paths from all nodes to all others that pass through v. Hence high betweenness of v implies, in some sense, that v is more likely to have short distance with others. This heuristic works in the same manner as Max but picks nodes with maximum betweenness in F .
Algorithm 3: ML (Min-Leaf). The third heuristic is based on the following intuition: A node is called a leaf if it has minimum degree in the network; leaves correspond to least connected members in the network, and may become outliers once nodes with higher degrees are removed from the network. Hence this heuristic gives first priority to leaves. Namely, at each iteration, the heuristic adds to S a node that has distance at most r -1 from v. More precisely, the heuristic first picks a leaf v in F, then applies a sub-procedure to find the next node w to be added to S. The sub-procedure determines a path v = u1↪ u2↪ ▷ ▷ ▷ in F iteratively as follows:
- Suppose ui is picked. If i = r or ui has no adjacent node in F , set ui as w and terminate the process.
- Otherwise select a ui+1 (which is different from ui-1) among adjacent nodes of ui with maximum degree.
After the process above terminates, the algorithm adds w to S. Note that the distance between w and v is at most r - 1.
We mention that Algorithms 1,3 have been applied in [Duckworth and Mans, 2005] to regular graphs, i.e., graphs where all nodes have the same degree. In particular, ML has been shown to produce small k-dominating sets for a given k in the average case for regular graphs.
(b) Simplified greedy algorithms. One significant shortcoming of Algorithms 1-3 is that, by deleting nodes from the network G, the network may become disconnected, and nodes that could have been connected via short paths are no longer reachable from each other. This process may produce isolated nodes in F, i.e., nodes having degree 0, which are subsequently all added to the output set S. Moreover, maintaining the graph F at each iteration also makes implementations more complex. Therefore we next propose simplified versions of Algorithms 1-3.
Algorithms 4 S-Max, 5 S-Btw, 6 S-ML. The simplified algorithms act in a similar way as their "non-simplified" counterparts; the difference is that here the heuristic works over the original network G as opposed to the updated network F . Hence the graph F is no longer computed. Instead we only need to maintain a set U of "uncovered" nodes. The simplified algorithms have the following general structure: Start from S = ? and U = V , and repeatedly perform the following until U = ?, at which point output S:
- Select a node v from U based on the corresponding heuristic and add v to S.
- Compute all nodes with distance < rad(G) from v, and remove them from U.
We stress that here the same heuristics as described above in Algorithms 1-3 are applied, except that we replace any mention of "F" in the description with "U", while all notions of degrees, distances, and betweenness are calculated based on the original network G.
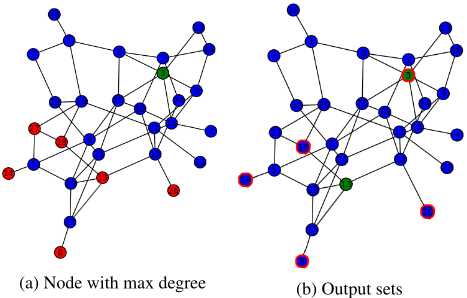
As an example, in Fig. 1 we run Max and S-Max on the same network and show how S-Max may output a smaller sub-radius dominating set. We further verify via experiments below that the simplified algorithms lead to much smaller output S in almost all cases.
(c) Center-based algorithms. The 6 algorithms presented above can all be applied to find k-dominating set for arbitrary k ≥ 1. Since our focus is in finding sub-radius dominating set to answer the BROKER problem, we describe two algorithms that are specifically designed for this task. When building the network for a newcomer, it is natural to consider nodes that are already in the center of the network G. Hence our two algorithms are based on utilizing the center of G.
Algorithm 7 Center. The algorithm finds a center v in G with minimum degree, then output all nodes that are adjacent to v. Since v belongs to the center, for all w 2 V , we have dist(v↪w) rad(G) and thus there is v0 adjacent to v such that dist(w↪ v0 ) = dist(w↪ v) - 1 < rad(G). Hence the algorithm returns a sub-radius dominating set. Despite its apparent simplicity, Center returns surprisingly good results in many cases, as shown in the experiments below.
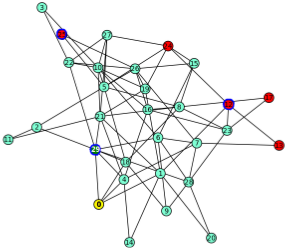
Algorithm 8 Imp-Center. We present a modified version of Center, which we call Imp-Center. The algorithm first picks a center with minimum degree, and then orders all its neighbors in decreasing degree. It adds the first neighbor to S and remove all nodes (r - 1)-steps from it. This may disconnect the graph into a few connected components. Take the largest component C. If C has a smaller radius than r, we add the center of this component to S; otherwise we add the next neighbor to S. We then remove from F all nodes at distance (r - 1) from the newly added node. This procedure is repeated until F is empty. See Procedure 1. Fig. 2 shows an example where Imp-Center out-performs Center.
Procedure 1 Imp-Center: Given G = (V↪ E) (with radius r)
Pick a center node v in G with minimum degree d Sort all adjacent nodes of v to a list u1↪ u2↪ ▷ ▷ ▷ ↪ ud in decreasing order of degrees
Set S ? and i 1 while U 6= ? do Set C as the largest connected component in F if rad(C) < rad(G) - 1 then Pick a center node w of C. Set S S [ ¶w♦ Set U U ∩ ¶w0 2 U ♣ dist(w↪w0 ) < r♦ else Set S S [ ¶ui♦ Set U U ∩ ¶w0 2 U ♣ dist(ui↪w0 ) < r♦ Set i i + 1 end if Set F as the subgraph induced by the current U end while return SThe next theorem follows from Fact 1.
Theorem 2. Any of Alg. 1-8 outputs a broker set S for G.
3.3 Experiments for BROKER
We implemented the algorithms using Sage [Stein, 2012]. We apply two models of random graphs: The first (BA) is Barabasi-Albert's preferential attachment model which generates scale-free graphs whose degree distribution of nodes follows a power law; this is an essential property of numerous real-world networks [Barb´asi and Albert, 1999]. The second (NWS) is Newman-Watts-Strogatz's small-world network [Newman et al., 2002], which produces graphs with small average path lengths and high clustering coefficient.
For each algorithm we are interested in two indicators of its performance: 1) Output size: The average size of the output broker set (for a specific class of random graphs). 2) Optimality rate: The probability that the algorithm gives optimal broker set for a random graph. To compute this we need to first compute the size of an optimal broker set (by brute force) and count the number of times the algorithm produces optimal solution for the generated graphs.
Experiment 1: Output sizes. We generate 300 graphs whose numbers of nodes vary between 100 and 1000 using each random graph model. We compute averaged output sizes of generated graphs by their number of nodes n and radius r. The results are shown in Fig. 3. From the result we see: a) The simplified algorithms produce significantly smaller broker sets compared to their unsimplified counterparts. This shows superiority of the simplified algorithms. b) BA graphs in general allow smaller output set than NWS graphs. This may be due to the scale-free property which results in high skewness of the degree distribution.
Experiment 2: Optimality rates. For the second goal, we compute the optimality rates of algorithms when applied to random graphs, which are shown in Fig. 4a. For BA graphs, the simplified algorithm S-ML has significantly higher optimality rate (≥ 85%) than other algorithms. On the contrary, its unsimplified counterpart ML has the worst optimality rate. This is somewhat contrary to Duckworth and Mans's work showing ML gives very small solution set for regular graphs [Duckworth and Mans, 2005]. For NWS graphs, several algorithms have almost equal optimality rate. The three best algorithms are S-Max, S-Btw and S-ML which have varying performance for graphs with different sizes (See Fig. 4b).
Experiment 3: Real-world datasets. We test the algorithms on several real-world datasets: The Facebook dataset, collected from survey participants of Facebook App, consists of friendship relation on Facebook [McAuley and Leskovec, 2012]. Enron is an email network of the company made public by the FERC [Leskovec et al., 2009]. Nodes of the network are email addresses and if an address i sent at least one email to address j, the graph contains an undirected edge from i to j. Col1 and Col2 are collaboration networks that represent scientific collaborations between authors papers submitted to General Relativity and Quantum Cosmology category (Col1), and to High Energy Physics Theory category (Col2) [Leskovec et al., 2007].
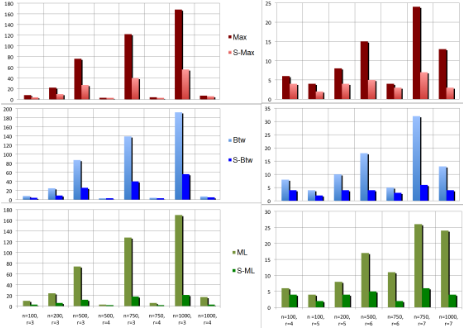
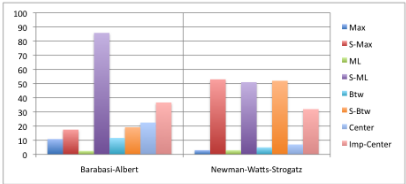
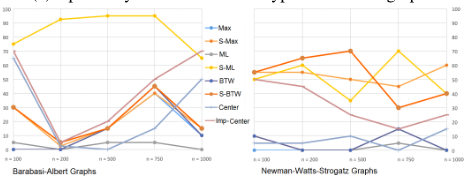
Figure 4: Optimality rates of algorithms
Results on the datasets are shown in Fig. 5. Btw and S-Btw become too inefficient as it requires computing shortest paths between all pairs in each iteration. Moreover, S-Max also did not terminate within reasonable time for the Enron dataset. Even though the datasets have many nodes, the output sizes are in fact very small (within 10). In some sense, it means that to become in the center even in a large social network, it is often enough to establish only very few connections.
| Enron | Col1 | Col2 | ||
|---|---|---|---|---|
| Number of nodes | 4,039 | 33,969 | 4,158 | 8,638 |
| Number of edges | 88,234 | 180,811 | 13,422 | 24,806 |
| diameter | 8 | 13 | 17 | 18 |
| radius | 4 | 7 | 9 | 10 |
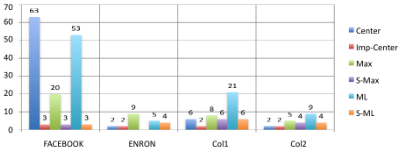
Among all algorithm Imp-Center has the best performance, producing the smallest output set for all networks. Moreover, for Enron, Col1 and Col2, Imp-Center returns the optimal broker set with cardinality 2. A rather surprising fact is, despite straightforward seemingly-naive logic, Center also produces small outputs in three networks. This reflects the fact that in order to become central it is often a good strategy to create ties with the friends of a central person.
4 How to Preserve or Improve the Diameter? Complexity and Algorithms for DIAM∆
Let G = (V↪E) be a network and u ◁2 V . The DIAM∆ problem asks for a set S ✓ V such that the network G⊕S u has diameter ∆; we refer to any such S as ∆-enabling. (a) Preserving the diameter. We first look at a special case when ∆ = diam(G), which has a natural motivation: How can an airline expand its existing route map with an additional destination while ensuring the maximum number of hops between any two destinations is not increased? We are interested in creating as few new connections as possible to reach this goal. Let δ(G) denote the size of the smallest diam(G)- enabling set for G. We say a graph is diametrically uniform if all nodes have the same eccentricity.
Theorem 3. (a) If G is not diametrically uniform,δ(G)=1. (b) If G is complete, then δ(G) = ♣V ♣.
- (c) If G is diametrically uniform and incomplete, then 1 < δ(G) d where d is the minimum degree of any node in G, and the upper bound d is sharp.
Proof. For (a), suppose G is not diametrically uniform. Take any v where ecc(v) < diam(G). Then in the expanded networkG⊕¶v♦u, we have ecc(u) = ecc(v)+1 diam(G). (b) is clear. For (c), Suppose G is diametrically uniform and incomplete. For the lower bound, suppose γdiam(G)-1(G) = 1. Then there is some v 2 V with the following property: In the network G ⊕¶v♦ u we have ecc(u) diam(G), which means that ecc(v) < diam(G). This contradicts the fact that G is diametrically uniform. For the upper bound, take a node v 2 V with the minimum degree d. Let N be the set of nodes adjacent to v. From any node w 6= v, there is a shortest path of length diam(G) to v. This path contains a node in N. Hence w is at distance diam(G)-1 from some node in N. Furthermore as G is not complete, diam(G) ≥ 2 and v is at distance 1 diam(G) - 1 from nodes in N.
In [Lokshtanov et al., 2013], calculating the exact value of δ(G) is shown to be complete for W[2], second level of the W-hierarchy. Hence DIAM∆ is unlikely to be in P. On the other hand, we argue that real-life networks are rarely diametrically uniform. Hence by Thm. 3(a), the smallest number of new connections needed to preserve the diameter is 1.
(b) Reducing the diameter. We now explore the question DIAM∆ where 2 ∆ < diam(G); this refers to the goal of placing a new member in the network and creating ties to allow a closer distance between all pairs of members. We suggest two heuristics to solve this problem.
Algorithm 9 Periphery. The periphery P (G) of G consists of all nodes v with ecc(v) = diam(G). Suppose diam(G) > 2. Then the combined network G⊕P(G) u has diameter smaller than diam(G). Hence we apply the following heuristic: Two nodes v↪w in G are said to form a peripheral pair if dist(v↪ w) = diam(G). The algorithm first adds the new node u to G and repeats the following procedure until the current graph has diameter ∆:
1) Randomly pick a peripheral pair v↪ w in the current graph 2) Adds the edges uv↪ uw if they have not been added already 3) Compute the diameter of the updated graph
Note that once v↪w are chosen as a peripheral pair and the corresponding edges uv↪ uw added, v and w will have distance 2 and they will not be chosen as a peripheral pair again. Hence the algorithm eventually terminates and produces a graph with diameter at most ∆.
Algorithm 10 CP (Center-Periphery). This algorithm applies a similar heuristic as Periphery, but instead of picking peripheral pairs at each iteration, it first picks a node v in the center and adds the edge uv; it then repeats the following procedure until the current graph has diameter ∆:
- Randomly pick a node w in the periphery of the graph
- Add the edge uw if it has not been added already
- Compute the diameter of the updated graph
Suppose at one iteration the algorithm picks w in the periphery. Then after this iteration the eccentricity of w is at most r + 2 where r is the radius of the graph.
(c) Experiments for DIAM∆ We implement and test the performance of Algorithms 9 and 10.Their performance are measured by the number of new ties created.
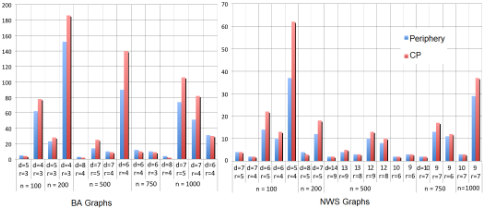
Experiment 4: Random graphs. We apply the two models of random graphs, BA and NWS, as described above. We generated 350 graphs and considered the case when ∆ = d(G) - 1, i.e. the aim was to improve the diameter by one. For both types of random graphs (fixing size and radius), the average number of new ties are shown in Fig. 6. The experiments show that Periphery performs better when the radius of the graph is close to the diameter (when radius is > 2◁3 of diameter), whilst CP is slightly better when the radius is significantly smaller than the diameter.
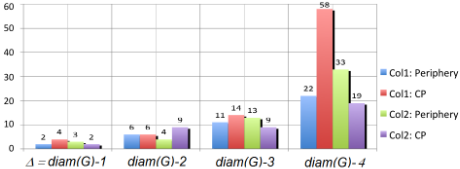
Experiment 5: Real-World Datasets. We run both Periphery and CP on the networks Col1 and Col2 introduced above, setting ∆ = diam(G) - i for 1 i 4. The numbers of new edges obtained by Periphery and CP are shown in Figure 7; naturally for increasing i, more ties need to be created. We point out that, despite the large total number of nodes, one needs less than 19 new edges to improve the diameter even by four. This reveals an interesting phenomenon: While a collaboration network may be large, a few more collaborations are sufficient to reduce the diameter of the network.
On the Facebook dataset, Periphery is significantly better than CP: To reduce the diameter of this network from 8 to 7, Periphery requires 2 edges while CP requires 47. When one wants to reach the diameter 6, the numbers of new edges increase to 6 for Periphery and 208 for CP.
5 Conclusion and Outlook
This work studies how ties are built between a newcomer and an established network to reach certain structural properties. Despite achieving optimality is often computationally hard, there are efficient heuristics that reach the desired goals using few new edges. We also observe that the number of new links required to achieve the specified properties remain small even for large networks. This work amounts to an effort towards an algorithmic study of network building. Along this effort, natural questions that have yet to be explored include: (1) Investigating the creation of ties between two arbitrary networks, namely, how ties are created between two established networks to maintain or reduce diameter. (2) Investigating network building in the context of organizational networks by incorporating both formal and information relations [Liu and Moskvina, 2015].
@inproceedings{ijcai2016p369,
  title     = {How to Build Your Network? A Structural Analysis},
  author    = {Moskvina, Anastasia and Liu, Jiamou},
  booktitle = {Proceedings of the Twenty-Fifth International Joint Conference on
               Artificial Intelligence, {IJCAI-16}},
  publisher = {AAAI Press / International Joint Conferences on Artificial Intelligence},
  editor    = {Subbarao Kambhampati},
  pages     = {2597--2602},
  year      = {2016},
  month     = {7},
  url       = {https://ijcai.org/proceedings/2016/369},
}
TY - CPAPER TI - How to Build Your Network? A Structural Analysis AU - Moskvina, Anastasia AU - Liu, Jiamou T2 - Proceedings of the Twenty-Fifth International Joint Conference on Artificial Intelligence, IJCAI-16 PB - AAAI Press / International Joint Conferences on Artificial Intelligence PY - 2016 SP - 2597 EP - 2602 UR - https://ijcai.org/proceedings/2016/369 ER -Copied
Machine-readable versions of this paper, for tools and AI agents:





