
Rating-Boosted Latent Topics: Understanding Users and Items with Ratings and Reviews
Proceedings of the Twenty-Fifth International Joint Conference on Artificial Intelligence. Pages 2640-2645.
Abstract
The performance of a recommendation system relies heavily on the feedback of users. Most of the traditional recommendation algorithms based only on historical ratings will encounter several difficulties given the problem of data sparsity. Users' feedback usually contains rich textual reviews in addition to numerical ratings. In this paper, we exploit textual review information, as well as ratings, to model user preferences and item features in a shared topic space and subsequently introduce them into a matrix factorization model for recommendation. To this end, the data sparsity problem is alleviated and good interpretability of the recommendation results is gained. Another contribution of this work is that we model the item feature distributions with rating-boosted reviews which combine textual reviews with user sentiments. Experimental results on 26 real-world datasets from Amazon demonstrate that our approach significantly improves the rating prediction accuracy compared with various state-of-the-art models, such as LFM, HFT, CTR and RMR models. And much higher improvement is achieved for users who have few ratings, which verifies the effectiveness of the proposed approach for sparse data. Moreover, our method also benefits much from reviews on top-N recommendation tasks.
- [Bao and Zhang, 2014] Yang Bao and Hui Fang Jie Zhang. Topicmf: Simultaneously exploiting ratings and reviews for recommendation. AAAI, pages 2-8, 2014.
- [Bell and Koren, 2007] Robert M Bell and Yehuda Ko- ren. Improved neighborhood-based collaborative filtering. KDD Cup and Workshop at the 13th ACM SIGKDD Inter- national Conference on Knowledge Discovery and Data Mining, 2007.
- [Blei et al., 2003] David M Blei, Andrew Y Ng, and Michael I Jordan. Latent dirichlet allocation. the Journal of machine Learning research, 3:993-1022, 2003.
- [Cremonesi et al., 2010] Paolo Cremonesi, Yehuda Koren, and Roberto Turrin. Performance of recommender algo- rithms on top-n recommendation tasks. Proceedings of the fourth ACM conference on Recommender systems, pages 39-46, 2010.
- [Ganu et al., 2009] Gayatree Ganu, Noemie Elhadad, and Amelie Marian. Beyond the stars: Improving rating pre- dictions using review text content. WebDB, 2009.
- [Jakob et al., 2009] Niklas Jakob, Stefan Hagen Weber, Mark Christoph Müller, and Iryna Gurevych. Beyond the stars: exploiting free-text user reviews to improve the ac- curacy of movie recommendations. Proceedings of the 1st international CIKM workshop on Topic-sentiment analysis for mass opinion, pages 57-64, 2009.
- [Koren et al., 2009] Yehuda Koren, Robert Bell, and Chris Volinsky. Matrix factorization techniques for recom- mender systems. Computer, 42(8):30-37, 2009.
- [Leung et al., 2006] Cane WK Leung, Stephen CF Chan, and Fu-lai Chung. Integrating collaborative filtering and sentiment analysis: A rating inference approach. Proceed- ings of The ECAI 2006 Workshop on Recommender Sys- tems, pages 62-66, 2006.
- [Ling et al., 2014] Guang Ling, Michael R Lyu, and Irwin King. Ratings meet reviews, a combined approach to rec- ommend. pages 105-112. ACM, 2014.
- [Lops et al., 2011] Pasquale Lops, Marco De Gemmis, and Giovanni Semeraro. Content-based recommender sys- tems: State of the art and trends. Recommender systems handbook, pages 73-105, 2011.
- [McAuley and Leskovec, 2013] Julian McAuley and Jure Leskovec. Hidden factors and hidden topics: understand- ing rating dimensions with review text. Proceedings of the 7th ACM conference on Recommender systems, pages 165-172, 2013.
- [Noh et al., 2004] Hyunju Noh, Minjung Kwak, and Ingoo Han. Improving the prediction performance of customer behavior through multiple imputation. Intelligent Data Analysis, 8(6):563-577, 2004.
- [Pazzani and Billsus, 2007] Michael J Pazzani and Daniel Billsus. Content-based recommendation systems. The adaptive web, pages 325-341, 2007.
- [Sarwar et al., 2001] Badrul Sarwar, George Karypis, Joseph Konstan, and John Riedl. Item-based collaborative filter- ing recommendation algorithms. Proceedings of the 10th international conference on World Wide Web, pages 285- 295, 2001.
- [Su and Khoshgoftaar, 2009] Xiaoyuan Su and Taghi M Khoshgoftaar. A survey of collaborative filtering tech- niques. Advances in artificial intelligence, 2009:4, 2009.
- [Wang and Blei, 2011] Chong Wang and David M Blei. Col- laborative topic modeling for recommending scientific ar- ticles. Proceedings of the 17th ACM SIGKDD interna- tional conference on Knowledge discovery and data min- ing, pages 448-456, 2011.
- [Xu et al., 2012] Jingnan Xu, Xiaolin Zheng, and Weifeng Ding. Personalized recommendation based on reviews and ratings alleviating the sparsity problem of collaborative fil- tering. e-Business Engineering (ICEBE), 2012 IEEE Ninth International Conference on, pages 9-16, 2012.
- [Zhang et al., 2014a] Yongfeng Zhang, M Zhang, Y Zhang, Y Liu, and S Ma. Explicit factor models for explainable recommendation based on phrase-level sentiment analysis. Proc. of SIGIR, 14, 2014.
- [Zhang et al., 2014b] Yongfeng Zhang, Min Zhang, Yi Zhang, Yiqun Liu, and Shaoping Ma. Under- standing the sparsity: Augmented matrix factorization with sampled constraints on unobservables. Proceedings of the 23rd ACM International Conference on Conference on Information and Knowledge Management, pages 1189-1198, 2014.
- [Zhang et al., 2015] Yongfeng Zhang, Min Zhang, Yi Zhang, Guokun Lai, Yiqun Liu, Honghui Zhang, and Shaoping Ma. Daily-aware personalized recommendation based on feature-level time series analysis. In Proceedings of the 24th International Conference on World Wide Web, pages 1373-1383, 2015.
- [Zhang, 2004] Tong Zhang. Solving large scale linear pre- diction problems using stochastic gradient descent algo- rithms. Proceedings of the twenty-first international con- ference on Machine learning, page 116, 2004.
- [Zhang, 2015] Yongfeng Zhang. Incorporating phrase-level sentiment analysis on textual reviews for personalized rec- ommendation. Proceedings of the Eighth ACM Interna- tional Conference on Web Search and Data Mining, pages 435-440, 2015.
- [Zheng et al., 2014] Xiaolin Zheng, Weifeng Ding, Jingnan Xu, and Deren Chen. Personalized recommendation based on review topics. Service Oriented Computing and Appli- cations, 8(1):15-31, 2014.
References were extracted automatically from the PDF and may contain errors.
Full text extracted automatically from the PDF; figures, tables and equations may differ. The PDF is the version of record.
1 Introduction
The core of a recommendation system is a personalized algorithm for identifying the preference of users based on their feedback towards items [Bao and Zhang, 2014]. Such feedback often consists of a numerical rating score (e.g., from 1 to 5 stars) attached to a textual review.
There has been significant work focusing on the proper modelling of user preferences and item features for recommendations based on ratings. Despite their success, there are still two key challenges affecting the recommendation performance of them. First, these preferences and features are difficult to be interpreted because of the neglect of textual reviews, whose very purpose is for users to explain why they rated an item the way they did [McAuley and Leskovec, 2013]. Second, these algorithms fail to make recommendations for users or items with few ratings because their preferences or features determined from limited information (e.g., two or three ratings) could be unreliable.
⇤Corresponding author
Generally, a numeric rating tells us whether a user likes or dislikes an item, the review associated with the rating, however, is capable of explaining the underlying reason. We ought to rely on reviews to understand better how users rate items. What's more, we can also get an idea of the user's concerns and the item's features from even a single review.
Differing from traditional algorithms based on ratings alone, we make recommendations by linking the ratings with the rich information obtained from textual reviews. Specifically, we propose a rating-boosted method to combine features discussed in the review with the sentiment orientation of the user who posted it. Based on the rating-boosted reviews, we determine item recommendability distributions and user preference distributions in topic dimensions. We then introduce these distributions into a matrix factorization model for recommendation. It is noteworthy that we learn the recommendability distributions of items and preference distributions of users both in the same topic space, where each dimension is a set of real features of items, which brings good interpretability to the parameters.
Our work primarily consists of the following parts: 1) we propose a rating-boosted method for combining textual reviews with users' sentiment orientations; 2) we learn the recommendability distributions of items, preference distributions of users, and latent rating factors in a shared topic space, which yields us good interpretability; 3) we propose a rating prediction framework that exploits ratings and reviews simultaneously. Experimental results show that our approach can improve prediction accuracy greatly compared with various state-of-the-art methods (e.g., LFM, RMR and HFT). It is especially effective for users or items with few ratings; and 4) by linking ratings and reviews we achieve great success on top-N recommendation task, which verifies the effectiveness of our model for user preferences and item features again.
The rest of the paper is organised as follows. We first review various related work in Section 2. Then, in Section 3, we detail our rating-boosted approach for identifying user preference and item recommenability distributions by linking ratings with reviews; and our model for rating prediction is also introduced in this section. Section 4 shows our experimental results on 26 Amazon datasets and some further discussions. Finally, we present our conclusions and outline a number of future research directions in Section 5.
2 RelatedWork
There has been significant amount of work focused on providing accurate recommendations based on the historical ratings [Pazzani and Billsus, 2007; Sarwar et al., 2001; Bell and Koren, 2007; Noh et al., 2004; Koren et al., 2009; Lops et al., 2011]. In recent years, however, with the continuous increase of product reviews published, more and more attention has been paid to how to use reviews to improve the performance of recommendation systems. Among these methods, the simultaneous use of ratings and reviews is a popular approach, which is referred to as semantic enhanced recommendation algorithms.
Ganu et al. attempt to extract aspect information (e.g., price) manually depending on abundant domain knowledge [Ganu et al., 2009]. The shortcomings of these types of approaches are that they require abundant domain knowledge and have high human cost; moreover, it is difficult to obtain a mass of feature information. Some work uses sentiment analysis methods to boost the performance of rating prediction automatically [Jakob et al., 2009; Leung et al., 2006; Zhang et al., 2014a; Zhang, 2015; Zhang et al., 2015]. However, these methods usually rely on the performance of natural language processing techniques and only two sentiment orientations (i.e., like and dislike) are taken into account. Some other work measures users/items similarities based on topic allocations extracted from reviews [Wang and Blei, 2011; Xu et al., 2012; Zheng et al., 2014]. However, they ignore user sentiment orientation in each review and are of high computation cost because of similarity calculation.
The latest models on simultaneous exploitation of ratings and reviews are proposed in [McAuley and Leskovec, 2013; Bao and Zhang, 2014; Ling et al., 2014]. McAuley et al. and Bao et al. exploit matrix factorization methods and topic models; and transform functions are adopted to align latent rating factors uncovered by matrix factorization methods with latent review topics uncovered by topic models. However, latent topics are only related with users (or items) in [McAuley and Leskovec, 2013], which does not conform to the real scenarios. Although Bao et al. extract latent topics that correlate with user and item factors simultaneously using Non-negative Matrix Factorization (NMF) on review-word matrices. It suffers from the high computational cost of NMF, which makes it difficult to operate on large-scale data. Ling et al. use mixture of Gaussian instead of matrix factorization, avoiding any transformation of the factors and thus retaining the interpretability of latent topics in [Ling et al., 2014]. For all of these three models, the features discussed in reviews are not combined with users' sentiment orientations, which may lead to biased recommendations.
In this work, we combine users' comments (textual reviews) and evaluations (numerical ratings) towards items with a rating-boosted method, and learn item recommendability and user preference distributions in one shared topic space. These differ greatly from most of previous models which learn item topic and user preference distributions separately. By mapping item recommendability and user preference distributions in the same space, these two distributions become comparable and hence operations on them (e.g., dot product, cosine similarity) are meaningful.
3 Model with Ratings and Reviews
3.1 Preliminaries
Before introducing our model, we begin by briefly describing one of the most popular Latent Factor Models (LFM) [Koren et al., 2009] for rating prediction. LFM is a category of algorithms mostly based on matrix factorization techniques. One of the most popular algorithms of LFM predicts the rating ˆ ru↪i of item i by user u as follows:
Here the prediction rating is broken down into four components: global average rating θ, user bias bu, item bias bi and interaction of the user and item qupTi [Koren et al., 2009]. Further, qu and pi are K-dimensional factors that represent user preferences and item features, respectively.
3.2 RBLT Framework
In this work, we propose a framework, which is titled "understanding users and items based on Rating-Boosted Latent Topics" (RBLT), to integrate numerical ratings and textual reviews to model user preferences and item features better. The RBLT framework is demonstrated in Figure 1.
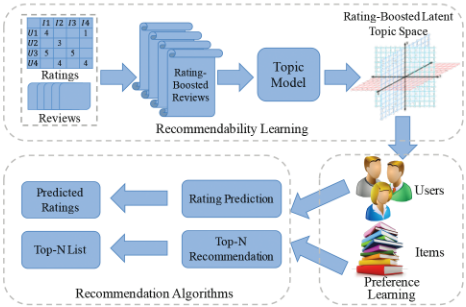
There are three main components in our framework, which are: 1) Recommendability learning for extracting recommendability distributions of items in the rating-boosted latent topic space; 2) Preference learning for identifying user preference distributions in the same topic space as that of recommendability distributions; and 3) Recommendation algorithms for rating prediction or top-N recommendation. All of the three components are detailed in the following sections.
3.3 Recommendability Learning
By linking features discussed in reviews with users' sentiment orientations, we intent to construct a recommendability distribution for each item i. In this distribution, strong signals are placed on topics that users have expressed positive orientations towards and item i has outstanding performance in. For this purpose, we use a rating-boosted method where the importance of good features will be enhanced. Specifically, the rating-boosted review of an original review is constructed by repeating this review (after removing stop words) r times, where r is the rating score associated with it. For example, if a review is associated with a 5-star rating, the features discussed in it will be enhanced 5 times, and therefore the topics containing these features exhibit stronger signals.
The intuition behind our rating-boosted reviews is that features discussed in a higher-rating review are more likely to be recommendable features. By repeating reviews r times, the features in higher-rating reviews will play more important roles in topic model. In other words, an item with high rate shows it is more worthy of being recommended in the feature topics mentioned by the review.
To extract topics from reviews, Latent Dirichlet Allocation (LDA) [Blei et al., 2003] model is adopted. In the context of text modelling, LDA can generate topic probabilities that provide an explicit representation of a document. In this work, we consider the set of all rating-boosted reviews of a particular item i as a document di. We conduct topic extraction based on all the documents with LDA model, by which we achieve a topic distribution fi for each document di, which is treated as recommendability distribution of item i. The dimensions with strong signals in fi indicate that item i has outstanding performance on them.
3.4 Preference Learning
We infer user preference distributions based on items' recommendability distributions and users' historical responses to items in the same topic space as those of recommendability distributions. We first define the degree of preference of user u to item i as gu↪i = ru↪i - ~, where ~ is the bound of like and dislike. A positive value of gu↪i means user u likes the features mentioned in reviews of item i, and a negative value of gu↪i means a dislike. Larger value of gu↪i indicates that user u likes the features of item i with a higher degree. Because the ratings range from 1 to 5 stars, we simply fix the bound ~ to the median of 3. Other reasonable settings of ~ are also acceptable, such as the mean rating of user u. Then let Iu be the set of items rated by user u, Gu be a row vector in which each dimension is the preference degree to one item in Iu, and Hu be a matrix where each row is a recommendability distribution of an item in Iu. Assuming that the size of Iu is t, we can formalize Gu and Hu as follows:
where the sizes of Gu and Hu are 1⇥t and t⇥K, respectively.
Another rating-boosted method is used to model the preference distribution of user u. Here, our assumption is that the more u likes/dislikes an item, the more crucial features of the item will be. As a result, we adopt the weighted average of the recommendability distributions of the items rated by u to model the preference distribution of u as below:
where ♣♣ · ♣♣1 denotes the l1-norm. By this, user preference distributions are modelled in the same space as item features.
3.5 Rating Prediction with RBLT
For rating prediction, we extend user preference distribution and item feature distribution in LFM model to two components: one modelled based on ratings and the other based on reviews. As a result, we extend Equation (1) to Equation (4) as follows:
where vu is the preference distribution of user u and fi is the recommendability distribution of item i. They are both extracted from reviews. qu and pi are user preference distribution and item feature distribution as before. By introducing the latent preference distributions of users and latent recommendability distributions of items, the interaction between user u and item i is modelled with (qu + vu)(pi + fi)T .
We learn the parameters of bu, bi, qu and pi by minimizing the following objective function with the stochastic gradient descent (SGD) [Zhang, 2004] method.
Here, ♣♣·♣♣F denotes the l2-norm. The component ⌦ is used for regularization to avoid over-fitting, which is equal to λ1(b2u + b2i )+λ2(♣♣qu♣♣2F +♣♣pi♣♣2F ) here. To pick the best values of λ1 and λ2, the grid search method is used.
4 Experiments and Discussion
4.1 Datasets and Experimental Settings
To evaluate the performance of our model, we conducted our experiments on 26 Amazon datasets 1 provided by McAuley et al. in [McAuley and Leskovec, 2013]. Each dataset is a collection of feedback of the same category of products on Amazon, where each piece of feedback contains a "UserID", an "ItemID", a rating score (ranging from 1 to 5 stars), and a textual review. We extracted the textual reviews as well as the numerical ratings to conduct experiments.
The statistical information of our datasets is summarized in Table 1. Through the last column, which shows the percentage of users with no more than 3 historical ratings, we know that the real-world datasets are extremely sparse.
To avoid data biases, we randomly selected 80% of each dataset for training, 10% of each dataset for validation and the remaining 10% for testing, which is the same dataset breakdown as [McAuley and Leskovec, 2013]. Note that we only used the review information in the training set, because the reviews in the validation set or testing set are unavailable during validation or the prediction process in real scenarios.
1 http://snap.stanford.edu/data/web-Amazon.html
| Datasets | #users | #items | #ratings | % of silent users |
|---|---|---|---|---|
| Arts | 24071 | 4211 | 27980 | 98.62% |
| Automotive | 133256 | 47577 | 188728 | 96.71% |
| Baby | 13930 | 1660 | 17332 | 98.55% |
| Beauty | 167725 | 29004 | 252056 | 95.66% |
| Cell Phones & Accessories | 68041 | 7438 | 78930 | 99.27% |
| Clothing & Accessories | 128794 | 66370 | 581933 | 83.98% |
| Electronics | 811034 | 82067 | 1241778 | 95.43% |
| Gourmet Foods | 112544 | 23476 | 154635 | 96.50% |
| Health | 311636 | 39539 | 428781 | 96.97% |
| Home & Kitchen | 644509 | 79006 | 991794 | 95.44% |
| Industrial & Scientific | 29590 | 22622 | 137042 | 95.91% |
| Jewelry | 40594 | 18794 | 58621 | 95.74% |
| Kindle Store | 116191 | 4372 | 160793 | 97.36% |
| Movies | 827806 | 241599 | 6330033 | 60.65% |
| Music | 1024451 | 514934 | 5116267 | 78.48% |
| Musical Instruments | 67007 | 14182 | 85405 | 97.64% |
| Office Products | 110472 | 14224 | 138084 | 98.34% |
| Patio | 166832 | 19531 | 206250 | 98.38% |
| Pet Supplies | 160496 | 17523 | 217170 | 96.72% |
| Shoes | 73590 | 48410 | 389877 | 76.97% |
| Software | 68464 | 11234 | 95084 | 98.29% |
| Sports & Outdoors | 329232 | 68293 | 510991 | 95.71% |
| Tools & Home Impro. | 283514 | 51004 | 409499 | 96.11% |
| Toys & Games | 290713 | 53600 | 435996 | 96.95% |
| Video Games | 228570 | 21025 | 463669 | 94.72% |
| Watches | 62041 | 10318 | 68356 | 99.42% |
| Total | 6295103 | 1512013 | 18787084 | 88.22% |
4.2 Baseline and Evaluation Procedures
Four state-of-the-art rating prediction approaches are adopted for comparison, which are LFM [Koren et al., 2009], HFT [McAuley and Leskovec, 2013], CTR [Wang and Blei, 2011] and RMR [Ling et al., 2014]. LFM model estimates unknown ratings based on ratings alone, while HFT, CTR and RMR models exploit ratings and reviews simultaneously. Moreover, we also conduct experiments by adding ratingboosted method into HFT model (denoted as "HFT+RB") and by removing rating-boosted method from RBLT model (denoted as "no-RBLT") to evaluate the performance of ratingboosted procedure. Specifically, for "HFT+RB" we use rating-boosted reviews instead of the original reviews. For "no-RBLT" we exploit the original reviews, instead of the rating-boosted reviews, to extract item recommendability distributions, and adopt the arithmetic mean, instead of weighted mean, of item recommendability distributions to identify user preference distributions.
We compared these six baseline methods with our RBLT model as described in Section 3.
To evaluate the prediction performance, we adopted the commonly used metric mean squared error (MSE, see Equation (6)), which is defined as the mean squared error between the predicted ratings and the true ratings. The smaller the MSE is, the better the rating prediction performance is.
4.3 Performance of Rating Prediction
To conduct fair comparisons, we adopt the open source implementation in MyMediaLite 2 to obtain the predictions of LFM
2 http://www.mymedialite.net/
model; for HFT we take the results reported by McAuley et al. in their paper (by item topics with K = 5); and for CTR and RMR models we use the results reported by Ling et al. in [Ling et al., 2014]. The HFT model did not report the results on datasets of Cell Phones & Accessories, Kindle Store and Patio. And the size of the Baby dataset we obtained is inconsistent with that reported by HFT. As a result, we used the source code 3 , which is the implementation of HFT released by the authors, to obtain the results on these four datasets. And we do not make comparison with CTR and RMR models on Baby dataset for the authors did not report their results on it in [Ling et al., 2014], and no source codes are available.
We show the performance comparisons of our RBLT with all the baseline methods in Table 2, where the best prediction result on each dataset is in bold. On most of the datasets, the RBLT model achieves the best results, and on the rest of them the performance of our method is comparable (if not the best) to the best one. Compared with rating-based model LFM, we achieve much better prediction performance on 23/26 datasets by introducing information from reviews. What's more, our RBLT model outperforms HFT model on 22/26 datasets, outperforms CTR model on 24/25 datasets, and outperforms RMR model on 18/25 datasets. On average, our RBLT model improves the prediction accuracy by up to 2.22%, 4.82%, 6.32% and 3.21% compared with LFM, HFT, CTR and RMR, respectively, which are generally significant improvements in rating prediction tasks.
Compared with no-RBLT method, our RBLT model achieves clearly better performance on most of the datasets; moreover, the "HFT+RB" method outperforms the HFT model on 18/26 datasets. It implies that we achieve better understanding of users and items by combining reviews with users' sentiment orientations using rating-boosted method.
4.4 Prediction for Silent Users or Items
As demonstrated in Table 1, there are usually a large amount of "silent users" in practical systems. However, it is inherently difficult to provide such users with satisfactory recommendations based only on the limited ratings. In the LFM model for example, each user or item is associated with a Kdimensional latent factor and a bias term. Ratings serve as constraints to learn them [Zhang et al., 2014b]. Given only a few ratings, the penalty function tends to push qu and pi towards zero (see Equation (1)), which means that such users and items are modelled only with the biased terms. By linking ratings with the reviews, however, our RBLT model is able to alleviate the problem of silent users or items to a great deal, because even a single review contains rich information about the user preferences and item features.
For clearer understandings, we analyze our prediction performance for silent users on two large-scala datasets (Movies and Shoes) and on the 26 datasets as a whole. In Figure 2, we show the reduction of MSE (y-axis) grouped by the number of historical ratings (x-axis) of users in the testing set, which is equal to the average MSE of LFM or HFT minus that of our RBLT model grouped by the number of ratings of users. A positive value indicates that our model has better prediction accuracy. Note that we obtain the HFT results using the source code released by the authors of HFT.
3 http://cseweb.ucsd.edu/⇠jmcauley/
| Dataset | LFM | HFT | CTR | RMR | HFT+RB | no-RBLT | RBLT | improvement | |||||
|---|---|---|---|---|---|---|---|---|---|---|---|---|---|
| (a) | (b) | (c) | (d) | (e) | (f) | (g) | g v.s. a | g v.s. b | g v.s. c | g v.s. d | g v.s. e | g v.s. f | |
| Arts | 1.363 | 1.388 | 1.471 | 1.371 | 1.362 | 1.375 | 1.352 | 0.84%** | 2.60%** | 8.09% | 1.39% | 0.74%** | 1.69%** |
| Automotive | 1.431 | 1.428 | 1.492 | 1.403 | 1.419 | 1.430 | 1.406 | 1.77%** | 1.56%** | 5.78% | -0.20% | 0.95%* | 1.70%** |
| Baby | 1.596 | 1.631 | N/A | N/A | 1.619 | 1.618 | 1.583 | 0.83% | 2.96%* | N/A | N/A | 2.23%** | 2.15%* |
| Beauty | 1.375 | 1.347 | 1.361 | 1.334 | 1.369 | 1.361 | 1.308 | 4.88%** | 2.93%** | 3.93% | 1.99% | 4.51%** | 3.94%** |
| Cell Phones &Accessories | 2.124 | 2.129 | 2.177 | 2.085 | 2.135 | 2.125 | 2.101 | 1.06%** | 1.29%* | 3.48% | -0.78% | 1.60%** | 1.12%** |
| Clothing &Accessories | 0.398 | 0.327 | 0.355 | 0.336 | 0.358 | 0.378 | 0.328 | 17.73%** | -0.25% | 7.65% | 2.43% | 8.33%** | 13.30%** |
| Electronics | 1.670 | 1.724 | 1.764 | 1.722 | 1.695 | 1.665 | 1.665 | 0.27% | 3.40%** | 5.59% | 3.29% | 1.73%* | -0.04% |
| Gourmet Foods | 1.439 | 1.431 | 1.482 | 1.465 | 1.446 | 1.441 | 1.428 | 0.78% | 0.19% | 3.62% | 2.50% | 1.23% | 0.86% |
| Health | 1.503 | 1.528 | 1.552 | 1.512 | 1.494 | 1.513 | 1.479 | 1.66%** | 3.24%** | 4.73% | 2.21% | 1.00%** | 2.30%** |
| Home & Kitchen | 1.521 | 1.527 | 1.577 | 1.501 | 1.544 | 1.548 | 1.533 | -0.79%** | -0.38% | 2.81% | -2.12% | 0.71%** | 1.00%** |
| Industrial & Scientific | 0.387 | 0.357 | 0.382 | 0.362 | 0.377 | 0.370 | 0.353 | 8.96%** | 1.21% | 7.67% | 2.57% | 6.42%** | 4.78%* |
| Jewelry | 1.209 | 1.178 | 1.206 | 1.160 | 1.171 | 1.198 | 1.146 | 5.24%** | 2.74%** | 4.99% | 1.23% | 2.12%* | 4.38%** |
| Kindle Store | 1.390 | 1.421 | 1.457 | 1.412 | 1.419 | 1.393 | 1.394 | -0.34% | 1.90% | 4.30% | 1.26% | 1.72% | -0.11% |
| Movies | 0.456 | 1.119 | 1.114 | 1.120 | 0.710 | 0.382 | 0.359 | 21.36%** | 67.94%** | 67.80% | 67.97% | 49.48%** | 6.18%** |
| Music | 0.707 | 0.969 | 0.959 | 0.959 | 0.856 | 0.729 | 0.625 | 11.64%** | 35.51%** | 34.84% | 34.84% | 27.01%** | 14.33%** |
| Musical Instruments | 1.430 | 1.396 | 1.422 | 1.374 | 1.411 | 1.438 | 1.444 | -0.98%** | -3.41%** | -1.52% | -5.06% | -2.32%** | -0.37%* |
| Office Products | 1.613 | 1.680 | 1.733 | 1.638 | 1.603 | 1.620 | 1.579 | 2.10%** | 6.00%** | 8.88% | 3.59% | 1.46%* | 2.53%** |
| Patio | 1.686 | 1.708 | 1.720 | 1.669 | 1.707 | 1.684 | 1.680 | 0.34% | 1.63%* | 2.31% | -0.67% | 1.55%* | 0.20% |
| Pet Supplies | 1.544 | 1.582 | 1.613 | 1.562 | 1.569 | 1.548 | 1.556 | -0.79% | 1.63% | 3.52% | 0.37% | 0.82% | -0.53% |
| Shoes | 0.293 | 0.226 | 0.271 | 0.251 | 0.224 | 0.262 | 0.209 | 28.54%** | 7.37%** | 22.75% | 16.60% | 6.42%** | 20.01%** |
| Software | 2.218 | 2.197 | 2.254 | 2.173 | 2.197 | 2.248 | 2.151 | 3.01%** | 2.09%** | 4.56% | 1.00% | 2.09%** | 4.32%** |
| Sports & Outdoors | 1.153 | 1.136 | 1.150 | 1.129 | 1.169 | 1.142 | 1.132 | 1.79%** | 0.36% | 1.58% | -0.26% | 3.18%** | 0.89% |
| Tools & Home Impro. | 1.489 | 1.499 | 1.513 | 1.491 | 1.495 | 1.470 | 1.465 | 1.61%** | 2.26%** | 3.16% | 1.74% | 2.01%** | 0.34% |
| Toys & Games | 1.372 | 1.366 | 1.389 | 1.372 | 1.362 | 1.369 | 1.365 | 0.47%* | 0.06% | 1.71% | 0.50% | -0.23% | 0.26% |
| Video Games | 1.487 | 1.511 | 1.462 | 3.25%** | 1.33%** | 2.78%** | |||||||
| Watches | 1.497 | 1.486 | 1.572 1.491 | 1.510 1.458 | 1.482 1.485 | 1.504 1.493 | 1.487 | 1.67%** 0.66%** | -0.08% | 7.00% 0.26% | 3.18% -2.00% | -0.14% | 0.38%* |
| Average | 1.321 | 1.357 | 1.379 | 1.335 | 1.334 | 1.319 | 1.292 | 2.22%** | 4.82%** | 6.32% | 3.21% | 3.16%** | 2.08%** |
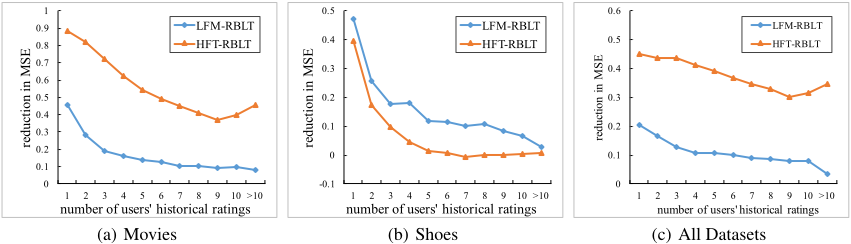
As we can see, our RBLT model greatly improves the prediction accuracy compared with the LFM model by linking ratings with reviews, and it also performs better than the HFT model which exploits ratings and reviews simultaneously. The improvement is even higher for users with fewer ratings. What's more, the rating prediction results of the "silent items" are similar to those of the "silent users".
4.5 Interpretability of RBLT
In our RBLT model, each user or item is represented with a latent rating factor distribution (i.e., qu or pi) and a latent topic distribution (i.e., vu or fi). These two sets of factors are both learnt in the same space, where each dimension is a topic extracted from the rating-boosted reviews. The topics (K = 5) discovered by our model from Cell Phones & Accessories dataset are shown in Table 3. To gain a better visualization of each topic, we remove the "background" words that belong to more than 3 topics.
As shown in Table 3, each of the extracted latent topics can be easily interpreted as an aspect that affects a user's assessment of an item, which differs greatly from the latent factors discovered by LFM models. What's more, the rating scores of users can be consistently mapped to the topics because the topics consist of the real-world features that are positively commented on by the users.
4.6 Top-NRecommendation
Top-N recommendation is aimed to recommend a set of N top-ranked items that will be of interest to a certain user [Su and Khoshgoftaar, 2009]. Compared with rating prediction, it is more practical in a real commercial system because the system usually expects to draw purchase by suggesting products to customers that are likely to be very appealing to them [Cremonesi et al., 2010]. As a result, determining user preferences and item features is of key importance for this task.
| sound | device | battery | surface | camera |
|---|---|---|---|---|
| headset | music | battery | case clip belt nice color | camera phone |
| ear | bluetooth | charge | ||
| headphone | device | price | screen | |
| sound | treo | new | screen | nokia |
| volume | ipod | cable | cover | picture |
| comf. | keyboard | cell | feature | |
| easy | software | days | leather | cell |
| noise | player | original | reception | |
| motorola | cable | item | plastic | motorola |
| unit | palm | service | price | easy |
For LFM, the user preference distribution (qu) and item feature distribution (pi) are modelled based on ratings alone, and HFT models them (i.e., γu and γi) by simultaneously optimizing the parameters associated with ratings and the parameters associated with topics [McAuley and Leskovec, 2013]. However, our no-RBLT and RBLT models identify them (i.e., vu and fi) in a shared topic space, thus operations on them (e.g., dot product, cosine similarity) are meaningful. Besides, user sentiment orientations are taken into account in the RBLT model using rating-boosted method. Here, we compare the effectiveness of user preference and item feature distributions modelled by LFM, HFT, no-RBLT and RBLT with the top-N recommendation task, respectively.
Our experiments are conducted on two large-scale datasets, Movies and Music. As the widely used settings on this task, for each dataset, we only choose users having no less than 20 ratings and items rated by these users. Then, for each user u, we randomly hide 10 items rated by u for testing and the remaining items rated by u are used for training.
We adopt an approach similar to that of [Cremonesi et al., 2010] for evaluation. We randomly select 1000 items unrated by u and then calculate the (i) dot product or (ii) cosine similarity of the preference distribution of u and the feature distributions of the 10 hidden test items and 1000 randomly selected items. After that, we form a top-N recommendation list by picking N top-ranked items of all 1010 items according to their products or similarities with u. Let hitsu be the number of items examined by u in the top-N list, we adopt the commonly used metrics recall and precision for evaluation:
where U represents the user set for testing and h denotes the number of hidden items for each user. The experimental results of LFM, HFT no-RBLT and RBLT models on the top-N recommendation task are shown in Table 4. Because prec@N◁recall@N = h◁N, we only show the prec@N.
As we can see, no-RBLT and RBLT models perform much better than LFM and HFT models on the top-N recommendation task with p-value < 0▷01. Actually, for the latent factors discovered by LFM, there are no real item aspects corresponding to them. Though ratings and reviews are exploited simultaneously in the HFT model, γu and γi are not learned in the same space and it fails to combine reviews with user sentiment orientations. However, vu and fi of our no-RBLT and RBLT models are modelled in a shared latent topic space where each dimension is a set of real aspects discussed in reviews. Recommending items to users based on similarities of such distributions conforms better with the real procedure where people assess products. What's more, users' sentiment orientations are also taken into account in RBLT model, which further enhances the accuracy of the model. As a result, the best performance is achieved by the RBLT model.
| Music | Movies | ||||
|---|---|---|---|---|---|
| (i) | (ii) | (i) | (ii) | ||
| LFM HFT no-RBLT | 10.87% 2.16% 12.20% | 2.10% 3.22% | 15.38% 6.46% 13.10% | 6.79% | |
| prec@10 | 5.10% | ||||
| 13.71% | 17.98% | ||||
| RBLT | 13.86% | 15.08% | 14.91% | 20.30% | |
| prec@20 | LFM | 7.18% | 1.83% | 10.34% | 4.86% |
| HFT | 5.01% | 2.46% | 7.62% | 4.26% | |
| no-RBLT | 10.14% | 11.65% | 11.09% | 12.26% | |
| RBLT | 11.37% | 12.67% | 12.32% | 13.89% | |
5 Conclusions and FutureWork
In this paper, we proposed conducting "understanding users and items based on Rating-Boosted Latent Topics" (RBLT). By bridging the advantages of latent factor models and topic models, we link the ratings and the textual reviews for recommendation. Our main contributions are: 1) we propose a rating-boosted approach to combine the features discussed in reviews with the sentiment orientations of users towards them; 2) we identify item recommendability distributions and user preference distributions in a shared topic space, which facilitates good recommendation performance and interpretability; 3) we propose a rating prediction model that exploits both ratings and textual reviews for recommendation. Experimental results on 26 real-world datasets show that our model greatly improves the rating prediction accuracy compared with some state-of-the-art methods. This is especially true for the "silent users" and "silent items"; and 4) by linking the ratings and the reviews, we also gain great improvements on practical top-N recommendation task.
In the future, we intend to exploit supervised topic models and incorporate content sentiment analysis to help model users and items. What's more, we also notice that users sometimes give a good rating to show kindness, while mentioning some flaws in certain features in reviews. Capturing this inconsistency can help us adjust our understanding of users and items, and thus achieve better recommendations.
Acknowledgement
We thank Prof. Jian-Yun Nie of UdeM for the valuable discussions with us. This work was supported by National Key Basic Research Program (2015CB358700), Natural Science Foundation (61532011, 61472206) of China and TsinghuaSamsung Joint Laboratory for Intelligent Media Computing.
@inproceedings{ijcai2016p375,
  title     = {Rating-Boosted Latent Topics: Understanding Users and Items with Ratings and Reviews},
  author    = {Tan, Yunzhi and Zhang, Min and Liu, Yiqun and Ma, Shaoping},
  booktitle = {Proceedings of the Twenty-Fifth International Joint Conference on
               Artificial Intelligence, {IJCAI-16}},
  publisher = {AAAI Press / International Joint Conferences on Artificial Intelligence},
  editor    = {Subbarao Kambhampati},
  pages     = {2640--2645},
  year      = {2016},
  month     = {7},
  url       = {https://ijcai.org/proceedings/2016/375},
}
TY - CPAPER TI - Rating-Boosted Latent Topics: Understanding Users and Items with Ratings and Reviews AU - Tan, Yunzhi AU - Zhang, Min AU - Liu, Yiqun AU - Ma, Shaoping T2 - Proceedings of the Twenty-Fifth International Joint Conference on Artificial Intelligence, IJCAI-16 PB - AAAI Press / International Joint Conferences on Artificial Intelligence PY - 2016 SP - 2640 EP - 2645 UR - https://ijcai.org/proceedings/2016/375 ER -Copied
Machine-readable versions of this paper, for tools and AI agents:





