
Demand Prediction and Placement Optimization for Electric Vehicle Charging Stations
Proceedings of the Twenty-Fifth International Joint Conference on Artificial Intelligence. Pages 3117-3122.
Abstract
Effective placement of charging stations plays a key role in Electric Vehicle (EV) adoption. In the placement problem, given a set of candidate sites, an optimal subset needs to be selected with respect to the concerns of both (a) the charging station service provider, such as the demand at the candidate sites and the budget for deployment, and (b) the EV user, such as charging station reachability and short waiting times at the station. This work addresses these concerns, making the following three novel contributions: (i) a supervised multi-view learning framework using Canonical Correlation Analysis (CCA) for demand prediction at candidate sites, using multiple datasets such as points of interest information, traffic density, and the historical usage at existing charging stations; (ii) a mixed-packing-and-covering optimization framework that models competing concerns of the service provider and EV users; (iii) an iterative heuristic to solve these problems by alternately invoking knapsack and setcover algorithms. The performance of the demand prediction model and the placement optimization heuristic are evaluated using real world data.
- [114th Congress, 2015] 114th Congress.
- H.R.22 -Surface Trans- portation Reauthorization and Reform Act, 2015. http://www. congress.gov/bill/114th-congress/house-bill/22. Link
- [Azar et al., 2013] Yossi Azar, Umang Bhaskar, Lisa Fleischer, and Debmalya Panigrahi. Online mixed packing and covering. In ACM-SIAM SODA, pages 85-100, 2013.
- [Borga, 2001] Magnus Borga. Canonical Correlation: A Tutorial, 2001. http://people.imt.liu.se/magnus/cca. Link
- [Chakaravarthy et al., 2013] Venkatesan T. Chakaravarthy, Anami- tra R. Choudhury, Sivaramakrishnan R. Natarajan, and Sambud- dha Roy. Knapsack cover subject to a matroid constraint. In IARCS FSTTCS, pages 275-286, 2013.
- [Chang et al., 2012] Daniel Chang, Daniel Erstad, Ellen Lin, Ali- cia Falken Rice, Chia Tzun Goh, An-An (Angel) Tsao, and Ja- son Snyder. Financial viability of non-residential electric vehicle charging stations, 2012. http://luskin.ucla.edu/sites/default/files/ Non-Residential%20Charging%20Stations.pdf. Link
- [Chen et al., 2013] T. Donna Chen, Kara M. Kockelman, and Moby Khan. Locating electric vehicle charging stations: Parking- based assignment method for Seattle, Washington. Journal of the Transportation Research Board, 2385:28-36, 2013.
- [Chung and Kwon, 2015] Sung Hoon Chung and Changhyun Kwon. Multi-period planning for electric car charging station locations: A case of korean expressways. European Journal of Operational Research, 242(2):677-687, 2015.
- [Cobb, 2014] Jeff Cobb. December 2014 Dashboard, 2014. http: //www.hybridcars.com/december-2014-dashboard. Link
- [CPLEX, 2009] IBM ILOG CPLEX. V12. 1: Users manual for CPLEX. International Business Machines Corporation, 2009.
- [Csirik et al., 1991] J. Csirik, J. B. G. Frenk, M. Labbé, and S. Zhang. Heuristics for the 0-1 Min-knapsack Problem. Acta Cybernetica, 10(1-2):15-20, 1991.
- [Dai et al., 2013] Jing D. Dai, Ajay A. Deshpande, Younghun Kim, Ming Li, Pavankumar Murali, and Sambit Sahu. Electric vehicle (ev) charging infrastructure with charging stations optimumally sited, 2013. US Patent Publication No. US20130222158 A1.
- [Drezner, 1995] Zvi Drezner, editor. Facility Location: A Survey of Applications and Methods. Springer, 1995. [European Union, 2014] European Union. Directive 2014/94/EU of the European Parliament and of the Council, 2014. http://eur-lex. europa.eu/legal-content/EN/TXT/?uri=CELEX:32014L0094. Link
- [Funke et al., 2015] Stefan Funke, André Nusser, and Sabine Storandt. Placement of Loading Stations for Electric Vehicles: No Detours Necessary! Journal of Artificial Intelligence Re- search, 53:633-658, 2015.
- [Gopalakrishnan et al., 2016] Ragavendran Gopalakrishnan, Arpita Biswas, Alefiya Lightwala, Skanda Vasudevan, Partha Dutta, and Abhishek Tripathi. Demand prediction and placement optimiza- tion for electric vehicle charging stations, 2016. arXiv preprint arXiv:1604.05472.
- [Haklay and Weber, 2008] Mordechai (Muki) Haklay and Patrick Weber. OpenStreetMap: User-Generated Street Maps. IEEE Per- vasive Computing, 7(4):12-18, 2008.
- [Hardoon et al., 2004] David R. Hardoon, Sandor Szedmak, and John Shawe-Taylor. Canonical Correlation Analysis: An Overview with Application to Learning Methods. Neural com- putation, 16(12):2639-2664, 2004.
- [Klabjan, 2012] Diego Klabjan. Information systems and methods for deployment of charging infrastructure in support of electric vehicles, 2012. US Patent Publication No. US20120203726 A1.
- [Klami et al., 2013] Arto Klami, Seppo Virtanen, and Samuel Kaski. Bayesian Canonical Correlation Analysis. Journal of Ma- chine Learning Research, 14(1):965-1003, 2013.
- [Kleinrock, 1975] Leonard Kleinrock, editor. Queueing Systems Volume 1: Theory. Wiley-Interscience, 1975.
- [Lam et al., 2013] Albert Y. S. Lam, Yiu-Wing Leung, and Xi- aowen Chu. Electric vehicle charging station placement. In IEEE Smart Grid Communications, pages 510-515, 2013.
- [Mukherjee et al., 2015] Koyel Mukherjee, Partha Dutta, Gu- rulingesh Raravi, Thangaraj Balasubramaniam, Koustuv Das- gupta, and Atul Singh. Fair resource allocation for heterogeneous tasks. In IEEE IPDPS, pages 1087-1096, 2015.
- [Office for Low Emission Vehicles, 2012] Office for Low Emission Vehicles. National Charge Point Registry, 2012. http://data.gov. uk/dataset/national-charge-point-registry. [Office for Low Emission Vehicles, 2013] Office for Low Emis- sion Vehicles. Plugged-in Places, 2013. http://www.gov.uk/ government/publications/plugged-in-places. [Press Release, 2014] Press Release. Clean fuels for transport: Member States now obliged to ensure minimum coverage of refu- elling points for EU-wide mobility, 2014. http://europa.eu/rapid/ press-release IP-14-1053 en.htm. Link
- [Rai and Daume, 2009] Piyush Rai and Hal Daume. Multi-Label Prediction via Sparse Infinite CCA. In NIPS, 2009.
- [Storandt and Funke, 2013] Sabine Storandt and Stefan Funke. En- abling E-Mobility: Facility Location for Battery Loading Sta- tions. In AAAI, 2013.
- [Sun et al., 2011] Liang Sun, Shuiwang Ji, and Jieping Ye. Canon- ical Correlation Analysis for Multilabel Classification: A Least- Squares Formulation, Extensions, and Analysis. IEEE Transac- tions on Pattern Analysis and Machine Intelligence, 2011.
- U. S. Department of Energy. EV Everywhere Grand Challenge: DOE's 10-Year Vision for Plug-In Electric Vehicles, 2012.
- [Valuation Office Agency, 2011] Valuation Office Agency. Prop- erty market report, 2011. http://www.gov.uk/government/ uploads/system/uploads/attachment data/file/371470/pmr 2011. pdf. Link
- [Vazirani, 2001] Vijay V. Vazirani. Approximation Algorithms. Springer, 2001.
- [Virtanen et al., 2012] Seppo Virtanen, Arto Klami, Suleiman A. Khan, and Samuel Kaski. Bayesian Group Factor Analysis. In AISTATS, pages 1269-1277, 2012.
- [Wagner et al., 2014] Sebastian Wagner, Tobias Brandt, and Dirk Neumann. Smart City Planning -Developing an Urban Charging Infrastructure for Electric Vehicles. In ECIS, 2014.
- [Young, 2001] Neal E. Young. Sequential and parallel algorithms for mixed packing and covering. In IEEE FOCS, 2001.
References were extracted automatically from the PDF and may contain errors.
Full text extracted automatically from the PDF; figures, tables and equations may differ. The PDF is the version of record.
1 Introduction
The environmental impact of fossil fuels and the high variability in their prices have led to rising adoption of Electric Vehicles (EVs), which is supported by ambitious government policies for promoting EVs [U. S. Department of Energy, 2012; European Union, 2014]. Despite the technological advances in vehicle efficiency and battery capacity, a key hurdle in EV adoption is that, barring a few pockets of densely populated areas, the distribution of EV charging stations is sparse in most regions. 1 Because of this, EV owners and potential buyers frequently worry about whether the vehicle will have sufficient charge to travel to their trip destinations or an intermediate charging station. On the other hand, given the high cost of building a charging station and currently low 2 number of EVs, charging station operators would only want to place stations where demands for charging are high. This results in a situation where the charging station density is concentrated near city centres, rapidly decreasing while moving outward.
1 Recent government mandates [Press Release, 2014; 114th Congress, 2015] focus specifically on the expansion of refueling infrastructure to cover entire geographical regions.
This work is an attempt to break this deadlock by improving the distribution of new charging stations so as to mitigate the range anxiety of EV users. To be effective, such a solution must simultaneously address the concerns of both EV users and charging station operators. Charging station operators are concerned about (a) demand: charging stations must serve as much demand as possible, and (b) budget: there is a limited budget available for setting up charging stations. EV users are concerned about (c) reachability: there must be a charging station within a short driving distance from most locations, and (d) waiting time: the waiting time to begin charging at charging stations should not be prohibitively large, given that the charging event itself is time-consuming. 3
This paper models the above placement problem within a framework that is inspired from the facility location literature [Drezner, 1995]. Given a set of candidate sites for charging stations, e.g., parking lots in a city, the objective is to select an optimal subset of these locations that maximizes the total demand satisfied, subject to the total cost not exceeding the available budget (packing constraint), and given a set of locations of interest, there is at least one charging station within a specified driving range of every location in this set (covering constraint). This mixed-packing-and-covering formulation (Section 3.1) covers concerns (a)-(c). For (d), a queueing model is used to translate the requirement on waiting time to a constraint on the minimum number of charging slots needed at any given location, which is then factored into the setup costs in a pre-processing step.
Before tackling the optimization problem itself, it is necessary to predict the demand for charging at candidate sites. Although demand prediction has been extensively studied for planning transportation infrastructure, the EV charging station demand prediction problem is difficult because of sparse deployment of such stations, and lack of sufficient and reliable historic data. Thus, in addition to the limited historical demand data for existing charging stations in other locations, we consider two other types of location features which may strongly impact the usage: (i) nearby points of interest (PoI), e.g., shopping malls, institutions, restaurants, hospitals etc., indicating the frequency of visits that could be made by travelers, and (ii) traffic density at nearby road junctions. Using these features, in Section 2, we propose a supervised multiview learning framework using Canonical Correlation Analysis (CCA) for EV charging station demand prediction.
2 Nevertheless, this number is rapidly growing, e.g., in the U. S., EV market share has risen [Cobb, 2014] from 0.14% in 2011 to 0.72% in 2014.
3 There may be several other concerns for charging station operators and EV users, including alternate interpretations of reachability, e.g., [Funke et al., 2015], but in this work, we restrict our attention to modeling just these four.
After estimating the demands, the next step is to solve the mixed packing and covering problem. We propose a family of heuristics 4 in Section 3.2 that seeks to iteratively find the optimal allocation of the available budget between satisfying the packing and the covering constraints, by alternately invoking algorithms that solve reduced knapsack and set-cover subproblems. For example, choosing the well known greedy algorithms for the knapsack and set-cover problems [Vazirani, 2001] yields one instance in this family. 5 In Section 3.3, we present results from an experimental evaluation of this instance for the EV charging station placement problem using charging data from the UK. In most cases, and especially when budget is scarce, our heuristic achieves an improvement of 10-15% over a "naive" heuristic (that just solves a set-cover subproblem first and then uses the remaining budget, if any, to solve a residual knapsack subproblem), both in terms of finding feasible solutions and maximizing demand.
The modeling and heuristic frameworks above can be extended to the following alternate scenarios: (i) incremental placement of charging stations when the budget is progressively released over a period of time, and (ii) when there are multiple charging station operators, each with their respective budgets, and a government agency (subject to its own budget) seeks to optimally allocate grants to incentivize these providers to set up charging stations at selected locations (e.g., where the demand is low). We discuss these extensions in the full version [Gopalakrishnan et al., 2016].
1.1 RelatedWork
With the recent increase in the adoption of EVs, the charging station placement problem has received significant attention. One of the prerequisites of an effective charging station placement is the availability of estimated charging demand at candidate sites. In this context, prior literature has studied the impact of external information on charging station demand. For example, parking demand is combined with facility location problem in [Chen et al., 2013], and the effect of demographic features is studied using regression models in [Wagner et al., 2014]. However, these approaches lack a principled multi-view learning framework to integrate heterogeneous data sets to predict EV charging demand. In the machine learning literature, CCA-based models have been used for multi-variate regression [Rai and Daume, 2009; Sun et al., 2011; Klami et al., 2013]; in this paper, we propose a novel variant of CCA-based multivariate regression.
4 As we report later in Section 3.3, solving the integer linear program (ILP) exactly using [CPLEX, 2009] takes more than a day on average, which may be prohibitive even for a planning problem, since a designer would likely want to solve numerous instances of the ILP with different parameters during the planning process.
5 Since the primary mixed packing and covering problem, and the associated knapsack and set-cover problems are NP-hard, it is unlikely that any polynomial-time solution, including this instance, would be optimal.
A useful charging station placement solution needs to take into account the charging demand, budget, coverage, and waiting time at the stations. Existing work has not considered all of these factors simultaneously. For example, placement of charging stations based on predicted demand has been studied in [Dai et al., 2013; Klabjan, 2012; Wagner et al., 2014; Chen et al., 2013; Lam et al., 2013; Chung and Kwon, 2015], but they do not simultaneously consider constraints on budget, coverage, and waiting times. Coverage requirements in charging station placement has been modeled as path cover in [Funke et al., 2015], and reachability cover in [Storandt and Funke, 2013] over the city road network, but they do not consider the demand satisfied by the deployment and the waiting time faced by the users.
The optimization problem considered in this work contains both packing and covering constraints, with integer decision variables. Mixed packing and covering problems have been studied for fractional decision variables [Young, 2001; Azar et al., 2013], as well as for integer decision variables [Chakaravarthy et al., 2013; Mukherjee et al., 2015]. However, this work introduces an optimization problem with a knapsack packing constraint and a set covering constraint, which has not been studied earlier.
2 Demand Prediction at Candidate Sites
Understanding the EV charging demand is key to optimal placement of charging stations. Since the distribution of charging stations is typically sparse, there is insufficient data to efficiently model the demand. Thus, it becomes important to model the relationship of EV charging demand with auxiliary data such as Points of Interest (PoI) and traffic density. Such relationships help in better understanding not only the charging demand, but also the factors behind it. Additionally, the expected demand at a candidate site where no historical demand is known, can be predicted based on external factors. A multi-view learning framework based on Canonical Correlation Analysis (CCA) is used to jointly model the charging demand data and other external data sources, and to predict the demand at new candidate sites given the external factors.
CCA is a classical method to find a linear relationship between two sets of random variables. Let X and Y be data matrices of size n ⇥ dx and n ⇥ dy respectively, where each row corresponds to a realization of the random variables. CCA finds linear projections ux 2 Rdx and uy 2 Rdy such that their correlation, corr(Xux↪ Y uy), is maximized. It can be shown that maximizing correlation is equivalent to minimizing kXux - Y uyk2 subject to kXuxk2 = 1 and kY uyk2 = 1. A set of k min(rank(X)↪ rank(Y )) linear projections can be computed by solving a generalized eigenvalue problem; [Hardoon et al., 2004] provides a detailed review of classical CCA.
Multi-View Regression Using CCA: We present a multiview learning based regression framework for the charging demand prediction, which uses CCA in a supervised setting as a multivariate regression tool. CCA is, in fact, closely related to multivariate linear regression; [Borga, 2001; Sun et al., 2011] present least-square formulations. CCAbased approaches model the statistical dependence between two or more data sets and assume a single latent factor to describe information shared between all datasets. In a supervised setting such as multivariate regression task, the output variable is considered as one of the random variables and CCA models the statistical dependence between the output variable (dependent) and a covariate (independent variable). However, when there are more than two datasets (output variable and multiple covariates), modeling shared information may not always be a good choice, since it would discard dataset-specific information which may be crucial to predicting the output variable.
To address this deficiency, a multi-view learning regression framework is proposed when there are n > 2 covariates, all of which can be used to predict the output variable. The idea is to model the statistical dependence of the output variable with each of the covariates separately and then learn a weighted combination for each such model that maximizes the prediction performance. We call this model Multiple Dependent Regression (MDR), which can be formulated as the ensemble regression function f = Pi wifi, where Pi wi = 1. Here, fi is a regression function learned from covariate Xi to the output variable Y , and wi are the weights denoting the importance of covariate Xi in the regression task. The regression function fi for covariate Xi can be learnt according to a CCAbased regression, given by argminU ix ↪U iy kXiU ix - Y U iy k2 , where U ix and U iy are k-dimensional linear projections for each (covariate, output variable) pair (Xi↪ Y ). Hence, MDR is a two step framework of multiple regression:
- For each covariate Xi, apply CCA for Xi and Y , and compute the prediction error ei.
The values of parameters Ux↪ Uy↪ wi are learnt from the training data as described in the steps above. The model thus trained can be used to predict the output variable given the input covariates. In our case, the task is to predict the demand of EV charging at a new candidate location given the covariates as explained earlier.
MDR is analogous to ensemble learning approaches where multiple learning models are trained to solve a given problem. In our case, we train multiple CCA-based regression models in the first step and learn a weighted combination of models based on training error in the second step. The weights wi explain the importance of each covariate in the prediction task. This procedure is flexible-any CCA-based solution can be used in Step (1). In this work, we use a Bayesian solution with group-wise sparsity proposed in [Klami et al., 2013].
Experimental Results for Demand Prediction: MDR is evaluated on EV charging data obtained from 252 public charging points in North East England through UK's Plugged-In-Places program [Office for Low Emission Vehicles, 2013]. The location of charging points was obtained from UK's National Charge Point Registry data [Office for Low Emission Vehicles, 2012]. PoI information is extracted from OpenStreetMap [Haklay and Weber, 2008] API for 11 categories: sustenance, education, transportation, financial, healthcare, entertainment, sports, gardens, places of worship, shops and public buildings. Finally, we use traffic data for each junction-to-junction link on major road networks, provided by [Department for Transport, 2013].
The following data matrices are created: (i) Y 2 R252⇥24 represents hour-wise charging demand for each of 252 charging points, where Y [i↪ j] is the average energy consumed at charging point i in hour j; (ii) X1 2 R252⇥11 represents PoIs, where X1[i↪ j] is the frequency of PoI category j within a radius of 500 meters around charging point i; (iii) X2 2 R252⇥5 represents traffic densities at 5 nearest traffic junctions to each charging point; and (iv) X3 2 R252⇥5 represents charging demands at 5 nearest charging points to each charging point. Since charging data is sparse during early mornings and late nights, only data from 07:00 hrs. till 23:00 hrs. is used.
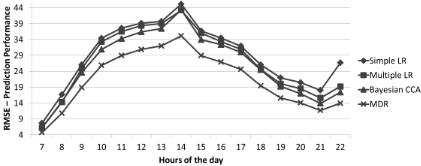
MDR is evaluated in a leave-one-out cross-validation manner by training on all but one instance (charging point) and testing on the left-out instance. Prediction performance is measured as the average Root Mean Square Error (RMSE) over all test instances. MDR is compared against (i) Linear Regression(LR) - all covariates are concatenated featurewise similar to [Wagner et al., 2014], (ii) Multiple Linear Regression (MLR) - weighted sum of multiple LR analogous to MDR, and (iii) Bayesian CCA (bCCA) - group factor analysis [Virtanen et al., 2012]. Figure 1 shows the average error for each hour of the day over all charging stations; MDR clearly outperforms the other three baselines giving an overall reduction in error by 27% compared to simple LR, 21% compared to multiple LR and 18% compared to bCCA.
3 Optimizing Placement of Charging Stations
In this section, we model the charging station placement problem as a mixed packing and covering optimization problem, and present a family of heuristics to solve it.
3.1 Preliminaries
Let L = ¶1↪ ▷ ▷ ▷ ↪ ♣L♣♦ denote the set of all candidate sites for placing a charging station. Let r 2 R+ denote the desired reachability radius, that is, the maximum distance to be travelled in order to reach a charging station. Let I denote the set
Figure 2: Optimization Problems
of all locations of interest that are desired to be covered, that is, lie within the reachability radius from at least one charging station. Let B denote the total budget available.
For each candidate site i 2 L: xi 2 ¶0↪ 1♦, di 2 R+, and ci 2 R+ denote, respectively, whether a charging station is placed, the demand for service, and the cost of setting up a charging station at i. Sr i ✓ I is the cover set of i, that is, the set of locations of interest that would be covered (within a driving distance of r) if a charging station is placed at i.
Optimizing for Demand: For a given reachability radius r, set of candidate sites L, and set of locations of interest I, the cover sets ¶Sr i ♦i2L can be precomputed. Given predicted demand and charging duration, a queueing model [Kleinrock, 1975] can estimate the number of charging slots required at each candidate site to meet a given constraint on waiting times, which is then used to precompute the costs ¶ci♦i2L. Then, the optimization problem to be solved is the Mixed Pack & Cover (MPC) problem shown in Figure 2a. 6
Approximation Algorithm for a Transformed Problem: MPC (Figure 2a) is NP-hard as it contains as a special case, the set-cover problem [Vazirani, 2001]. For a closely related pure covering problem called Demand & Set-Cover (DSC, Figure 2e), an approximation algorithm is described next.
DSC has as subproblems, two well-known NP-hard problems, Set-Cover (SC) [Vazirani, 2001] and Minimization Knapsack (MinKP) [Csirik et al., 1991], which are given in Figures 2c and 2d, respectively. Consider, an fsc factor approximation algorithmAsc for set cover and an fkp factor approximation algorithm Akp for minimization knapsack. Let Lsc and Lkp (subsets of L) be the solutions returned by Asc and Akp, respectively. Consider algorithm Adsc for DSC that uses Asc and Akp as subroutines, and returns the union of the solutions returned by the two subroutines, that is, Lsc [Lkp, as a solution for DSC. Lemma 1 (proof deferred to the full version [Gopalakrishnan et al., 2016]) establishes that Adsc is an (fsc + fkp) factor approximation algorithm for DSC.
Lemma 1 Adsc returns a feasible solution for DSC whose cost is at most (fsc + fkp) times the optimal cost.
The heuristic framework for MPC presented next is inspired by Adsc and the observation that, similar to DSC, a solution for MPC can be obtained by combining set cover and knapsack algorithms.
6 The total demand satisfied by installing charging stations at a subset of candidate sites may be less than the sum of the predicted demands at those sites due to overlapping reachability regions. We ignore this in order to keep the optimization problem simple.
3.2 Solving the Mixed Pack &Cover Problem
Our goal is to introduce a general methodology for algorithms to solve MPC, which is NP-hard, by breaking it down into the well-known Knapsack (KP) and the Set-Cover (SC) problems (see Figure 2). Let, KP(L↪ ¶di♦i2L↪ ¶ci♦i2L↪B) and SC(L↪ I↪ ¶ci♦i2L↪ ¶Si♦i2L) be any pair of algorithms that solve KP and SC, respectively. KP() (respectively, SC()) need not be optimal, but it must be nontrivial in the sense that its solution must be maximal (respectively, minimal). That is, it should not be possible to add (remove) an item and still satisfy the packing (covering) constraint(s).
The Iterative Pack And Cover (IPAC) Framework: The available budget could be used very differently if the problem had been a pure packing problem (where maximizing the demand is the only concern) or a pure covering problem (where satisfying the covering constraints is the only concern). Thus, a good solution to the mixed packing and covering problem should achieve an appropriate balance by dividing the available budget between these two concerns. The core idea behind the Iterative Pack And Cover (IPAC) framework is to iteratively search for such an optimal split.
In each iteration, the budget B can be thought of as comprising three parts: Bc , Bp , and some excess (due to the integrality constraint). Here, Bc is the portion of the budget used by a solution to a covering problem, and Bp is the portion of the budget used by a solution to a packing problem when constrained by a reduced budget of B - Bc . Starting with Bc = 0 (pure packing) and the corresponding solution from KP(), during each iteration, Bc is increased until a "covering check" (performed using SC() to determine whether the remaining budget B-Bp is sufficient to satisfy the covering constraints left unsatisfied) passes, at which point the solutions of the packing and covering problems obtained in the last iteration are merged. 7 The resulting solution is guaranteed to be a feasible solution to the MPC problem (Figure 2a). Optionally, KP() can be invoked one final time to use up any remaining portion of the budget. In the worst case, the iterations continue until Bc = B, at which point it becomes a pure covering problem, and if the covering check still fails, then IPAC fails to find a feasible solution to MPC. (But if this happens, it cannot necessarily be concluded that MPC is
7 As an extension, note that Bc need not necessarily increase in each iteration, as long as it can be shown that the procedure will terminate in finite time.
Algorithm 1 IPAC
- 1: Input: L, I, ¶di♦i2L, ¶ci♦i2L, B, ¶Sr i ♦i2L↪ KP()↪ SC()↪ RANK() 2: Output: ¶xi♦i2L 3: ¶xi♦i2L KP(L↪ ¶di♦i2L↪ ¶ci♦i2L↪B); 4: Lp ¶i 2 L : xi = 1♦; Bp Pi2L cixi; 5: I p Si2Lp Sr i ; 6: // I p elements of I covered by Lp . 7: ¶xci ♦i2L∩Lp SC(L∩Lp , I∩I p , ¶ci♦i2L∩Lp , ¶Sr i ♦i2L∩Lp ); 8: Bc Pi2L∩Lp cixci ; Bfree B -Bp ; 9: while (Bc > Bfree and Bc B) do 10: // ⇢ is Lp in increasing order of importance. 11: ⇢ RANK(Lp , ¶di♦i2Lp , ¶ci♦i2Lp , ¶Sr i ♦i2Lp ); 12: // Remove least important items. 13: j 0; 14: while Bfree < Bc do 15: j j + 1; x⇢[j] 0; Bfree Bfree + c⇢[j]; 16: // Recompute quantities. 17: Lp ¶i 2 L : xi = 1♦; I p Si2Lp Sr i ; 18: ¶xci ♦i2L∩Lp SC(L∩Lp , I∩I p , ¶ci♦i2L∩Lp , ¶Sr i ♦i2L∩Lp ); 19: Bc Pi2L∩Lp cixci ; 20: if Bc > B then EXIT; 21: // Add required items to knapsack. 22: for i in L∩Lp do xi xi +xci ; 23: // Add more items if possible. 24: Lp ¶i 2 L : xi = 1♦; Bp Pi2L cixi; 25: ¶xi♦i2L∩Lp KP(L∩Lp , ¶di♦i2L∩Lp , ¶ci♦i2L∩Lp , B -Bp );
infeasible, unless SC() is optimal, which is unlikely in polynomial time since the set-cover problem is NP-hard.) See the full version [Gopalakrishnan et al., 2016] for an expanded description of IPAC with an illustration.
The above framework is quite generic and encompasses a large class of algorithms. A particular instantiation of the framework is described in Algorithm 1.
The RANK() Function: The effectiveness of IPAC depends on the choice of methods for KP(), SC(), and RANK(). There are several choices in the literature for the first two [Vazirani, 2001], so we briefly discuss one possible choice for the third. A general observation is that an item i 2 L is more important or desirable if its demand di is high, and/or its cost ci is low, and/or if the number of elements it covers ♣Si♣ is high. Based on this, a viable candidate for RANK(L↪ ¶di♦i2L↪ ¶ci♦i2L↪ ¶Si♦i2L) would be a method that ranks items in increasing order according to the value vi = ⇣ di Pj2L dj + ♣Si♣ ♣I♣ ⌘ ◁ci, where I = Si2L Si denotes the set of all elements covered by items in L.
Computing Charging Station Costs: We estimate the setup costs ci, based on (i) the number of charging slots necessary at i to satisfy any desired service level agreement (SLA) on waiting times, and (ii) per-slot setup cost, including infrastructure as well as land/licensing costs. Data on the per-unit costs are generally available; so we focus on (i), for which we model candidate charging stations as a multi-server queue.
One possible way to model each candidate charging station at location i in order to estimate its size (and hence cost) is using a multi-server queue that follows an M/M/Ni discipline, where Ni 2 Z+ is the number of charging slots to be set up. Customers arrive into the queue according to a Poisson process with rate λi per time unit. The service time for each customer is exponentially distributed with mean
1◁θi time units. λi can be derived from the demand di, whereas θi can be derived from existing data on the average customer service time in nearby existing charging stations. The average time a customer waits before service is then given by E[W] = ErlC⇣Ni↪ λi θi ⌘ Niθi-λi , where ErlC(N↪ ⇢) = ⇣ ⇢N N! N N-⇢ ⌘ ◁ ⇣PN-1 j=0 ⇢j j! + ⇢N N! N N-⇢ ⌘ [Kleinrock, 1975]. Suppose the SLA to be met is given by E[W] ti. Then, because it is well-known [Kleinrock, 1975] that E[W] is a decreasing function of Ni, we simply choose the smallest Ni (e.g., using binary search) such that the SLA is satisfied.
3.3 Experimental Results
We conduct experiments to evaluate the performance of IPAC using data from North East England. We use parking locations in North East England for both the candidate sites for placing charging stations, as well as the locations of interest that need to be covered. Accordingly, the cover set Sr i for each candidate site i consists of the candidate sites that are within a distance of r from i. The charging demands at candidate sites are predicted using the MDR model trained in Section 2. The costs are computed as ci = Ni(Li + Fi); we estimate each of these components as follows:
- Ni, the number of charging spots: We assumed a Level 2 charging rate of 6▷4kW and set, for each candidate site, Ni to be the minimum number of Level 2 charging spots necessary (using a queueing model) to ensure that the average peak-demand waiting time (taken as the estimated maximum hourly demand at the candidate site over two years) is less than 5 minutes.
- Li, per-spot land cost: We consider realistic land cost, based on the PoI types within 1 km of the candidate site and the minimum per-unit land cost in the region (computed using data obtained from [Valuation Office Agency, 2011]).
- Fi, the per-spot infrastructure cost: For Level 2 charging, we set Fi = $1852 from Table 6 of [Chang et al., 2012].
The predicted demands and estimated costs of the candidate sites are then used to find the optimal locations using IPAC (Algorithm 1), where, for both KP() and SC(), we choose the well-known greedy approximation algorithms introduced in [Vazirani, 2001], and for RANK(), we use the function proposed in Section 3.2.
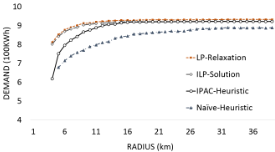
Performance: To evaluate the performance of IPAC, we compare it with (i) a naive heuristic that first solves the covering problem using SC(), and then invokes KP() on the remaining budget to add unselected candidate sites, (ii) the optimal ILP solution of the MPC problem (Figure 2a), and (iii) a solution to the LP relaxation of MPC problem, which gives an upper bound on the actual ILP optimization problem. We use a budget of B = $6M. The number of pairwise distances between candidate sites is prohibitively large for our experiment; so, we used values of r (in units of km), from the set ¶1↪ ▷ ▷ ▷ ↪ 40♦. The results are plotted in Figures 3a-3b.
As we increase the reachability radius r, the set of allocations that satisfy the covering constraints steadily gets larger, until, for a large enough radius, any allocation would satisfy the covering constraints, reducing the optimization to a pure
(e) Feasibility gap between IPAC-Heuristic and Naive-
Heuristic
Figure 3: Experimental Results for North East England
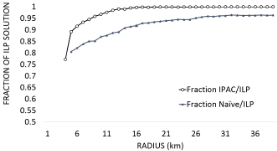
packing problem. Since the feasibility set only gets larger with r, the demand covered should also increase accordingly. The graphs validate this expected behavior. In addition, we observe that the demand captured by IPAC is far closer to that of the ILP solution than that captured by the naive heuristic. In particular, from Figure 3b, we can see that when r = 6km, the IPAC heuristic already captures almost 90% of the LP relaxation demand and its performance is always better than the naive heuristic. Also, the time taken to obtain the ILP solution for a given radius using [CPLEX, 2009], 8 ranges from 23 - 30 hours for most instances, whereas IPAC finished in less than 0.5 seconds.
Feasibility: Since IPAC is a heuristic, it may falsely deem an instance of the MPC problem (Figure 2a) infeasible, when in fact, feasible solutions exist. An instance of MPC is feasible if and only if the available budget B is greater than or equal to the minimum required budget determined by solving the corresponding instance of the set-cover subproblem (Figure 2c). In the case of IPAC, it reduces to whether the available budget B is greater than or equal to the minimum required budget as determined by SC().
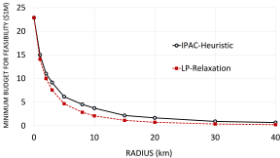
Therefore, given an instance of MPC, we look at the corresponding set-cover subproblem and compare its solutions (the minimum required budgets) as obtained by (i) using the greedy approximation algorithm in [Vazirani, 2001], and (ii) directly solving its relaxed LP. 9 We use different values of r (in units of km) to generate instances. The results are plotted in Figure 3c. (Since the LP relaxation allows for fractional allocations, the corresponding solution is only a lower bound on the minimum budget required for feasibility.)
8 Intel(R) Xeon (R) CPU @ 2.2 GHz (16 cores), 32GB RAM, 64-bit Windows.
9 Computing ILP solutions for feasibility analysis exactly is prohibitively time-consuming, since it must be computed for various r and B values.
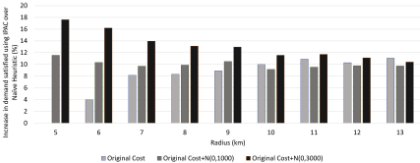
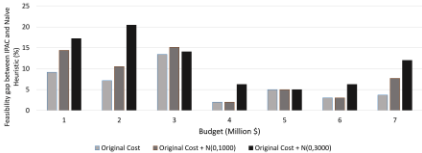
Accounting for Noisy Costs: Since our model for estimating the costs may not be accurate, we perform experiments for two additional scenarios, where we add zero-mean gaussian noise to the costs - one with a standard deviation of $1000 and another with a standard deviation of $3000. In each case, we compare IPAC and the naive heuristic:
Performance: Using a budget of $6M, we calculate the difference in the demands satisfied by the solution obtained using IPAC and the naive heuristic. Figure 3d shows this difference as a percentage, for several values of the reachability radius. IPAC's advantage is significant (8-18% in most cases).
Feasibility: We calculate the minimum reachability radius for which IPAC and the naive heuristic are able to find a feasible solution to MPC. IPAC is always able to find feasible solutions for smaller radii. Figure 3e shows this difference as a percentage, for several values of the available budget. IPAC's advantage over the naive heuristic is particularly remarkable (10-15% in most cases) when the budget is scarce.
Summary: Experimental results show that IPAC's feasibility gap as compared to the LP-Relaxation is not significant, and IPAC's performance quickly approaches that of the optimal demand. Further, in terms of both feasibility and performance, it can be seen that the advantage of IPAC over the naive heuristic is significant (10-15% in most cases) and this advantage is fairly robust to noise in the estimated costs.
Further analysis of the family of IPAC algorithms would be of interest, in particular, exploring provable performance guarantees of an IPAC algorithm, e.g., Algorithm 1, in terms of those of its constituent knapsack and set-cover algorithms. Another interesting direction would be to integrate the demand prediction model into the placement optimization framework, since the placement of a charging station at one site would likely affect demands at nearby sites.
@inproceedings{ijcai2016p442,
  title     = {Demand Prediction and Placement Optimization for Electric Vehicle Charging Stations},
  author    = {Gopalakrishnan, Ragavendran and Biswas, Arpita and Lightwala, Alefiya and Vasudevan, Skanda and Dutta, Partha and Tripathi, Abhishek},
  booktitle = {Proceedings of the Twenty-Fifth International Joint Conference on
               Artificial Intelligence, {IJCAI-16}},
  publisher = {AAAI Press / International Joint Conferences on Artificial Intelligence},
  editor    = {Subbarao Kambhampati},
  pages     = {3117--3122},
  year      = {2016},
  month     = {7},
  url       = {https://ijcai.org/proceedings/2016/442},
}
TY - CPAPER TI - Demand Prediction and Placement Optimization for Electric Vehicle Charging Stations AU - Gopalakrishnan, Ragavendran AU - Biswas, Arpita AU - Lightwala, Alefiya AU - Vasudevan, Skanda AU - Dutta, Partha AU - Tripathi, Abhishek T2 - Proceedings of the Twenty-Fifth International Joint Conference on Artificial Intelligence, IJCAI-16 PB - AAAI Press / International Joint Conferences on Artificial Intelligence PY - 2016 SP - 3117 EP - 3122 UR - https://ijcai.org/proceedings/2016/442 ER -Copied
Machine-readable versions of this paper, for tools and AI agents:





