
Sequential Planning for Steering Immune System Adaptation
Proceedings of the Twenty-Fifth International Joint Conference on Artificial Intelligence. Pages 3177-3183.
Abstract
Biological adaptation is a powerful mechanism that makes many disorders hard to combat. In this paper we study steering such adaptation through sequential planning. We propose a general approach where we leverage Monte Carlo tree search to compute a treatment plan, and the biological entity is modeled by a black-box simulator that the planner calls during planning. We show that the framework can be used to steer a biological entity modeled via a complex signaling pathway network that has numerous feedback loops that operate at different rates and have hard-to-understand aggregate behavior. We apply the framework to steering the adaptation of a patient's immune system. In particular, we apply it to a leading T cell simulator (available in the biological modeling package BioNetGen). We run experiments with two alternate goals: developing regulatory T cells or developing effector T cells. The former is important for preventing autoimmune diseases while the latter is associated with better survival rates in cancer patients. We are especially interested in the effect of sequential plans, an approach that has not been explored extensively in the biological literature. We show that for the development of regulatory cells, sequential plans yield significantly higher utility than the best static therapy. In contrast, for developing effector cells, we find that (at least for the given simulator, objective function, action possibilities, and measurement possibilities) single-step plans suffice for optimal treatment.
- [Adams et al., 2004] B Adams, H Banks, H-D Kwon, and H Tran. Dynamic multidrug therapies for HIV: Optimal and STI control approaches. Mathematical Biosciences and Engineering, 1:223-241, 2004.
- [Auer et al., 2002] Peter Auer, Nicolo Cesa-Bianchi, and Paul Fischer. Finite-time analysis of the multiarmed bandit problem. Machine learning, 47(2-3):235-256, 2002.
- [Basanta et al., 2012] David Basanta, Robert Gatenby, and Alexander Anderson. Exploiting evolution to treat drug resistance: Combination therapy and the double bind. Molecular Pharmaceutics, pages 914-921, 2012.
- [Browne et al., 2012] Cameron B Browne, Edward Pow- ley, Daniel Whitehouse, Simon M Lucas, Peter Cowl- ing, Philipp Rohlfshagen, Stephen Tavener, Diego Perez, Spyridon Samothrakis, Simon Colton, et al. A survey of Monte Carlo tree search methods. Computational Intelli- gence and AI in Games, IEEE Transactions on, 4(1):1-43, 2012.
- [Chen and Bowling, 2012] Katherine Chen and Michael Bowling. Tractable objectives for robust policy optimiza- tion. In Proceedings of the Annual Conference on Neural Information Processing Systems (NIPS), 2012.
- [Faeder et al., 2009] James R Faeder, Michael L Blinov, and William S Hlavacek. Rule-based modeling of biochemical systems with BioNetGen. In Systems biology, pages 113- 167. Springer, 2009.
- [Fontenot et al., 2003] Jason D Fontenot, Marc A Gavin, and Alexander Y Rudensky. Foxp3 programs the development and function of CD4+ CD25+ regulatory T cells. Nature immunology, 4(4):330-336, 2003.
- [Gillespie, 1976] Daniel T Gillespie. A general method for numerically simulating the stochastic time evolution of coupled chemical reactions. Journal of computational physics, 22(4):403-434, 1976.
- [Harris et al., 2015] Leonard A Harris, Justin S Hogg, Jose- Juan Tapia, John AP Sekar, Ilya Korsunsky, Arshi Arora, Dipak Barua, Robert P Sheehan, and James R Faeder. BioNetGen 2.2: advances in rule-based modeling. arXiv preprint arXiv:1507.03572, 2015.
- [Hawse et al., 2015] W F Hawse, R P Sheehan, Natasa Miskov-Zivanov, A V Menk, L P Kane, James R Faeder, and Penelope A Morel. Cutting edge: Differential regula- tion of PTEN by TCR, Akt, and FoxO1 controls CD4+ T cell fate decisions. J Immunol, 194:4615-4619, 2015.
- [Höfer et al., 2012] Thomas Höfer, Oleg Krichevsky, and Grégoire Altan-Bonnet. Competition for IL-2 between regulatory and effector T cells to chisel immune responses. Frontiers in immunology, 3, 2012.
- [Kocsis and Szepesvári, 2006] Levente Kocsis and Csaba Szepesvári. Bandit based Monte-Carlo planning. In Eu- ropean Conference on Maching Learning (ECML), pages 282-293. Springer, 2006.
- [Kroer and Sandholm, 2015] Christian Kroer and Tuomas Sandholm. Limited lookahead in incomplete-information games. In Proceedings of the International Joint Confer- ence on Artificial Intelligence (IJCAI), 2015.
- [Ma et al., 2012] Jian Ma, Yan Ding, Xianfeng Fang, Ruiqing Wang, and Zuoming Sun. Protein kinase C-✓ inhibits inducible regulatory T cell differentiation via an AKT-Foxo1/3a-dependent pathway. The Journal of Im- munology, 188(11):5337-5347, 2012.
- [Miskov-Zivanov et al., 2013] Natasa Miskov-Zivanov, Michael S Turner, Lawrence P Kane, Penelope A Morel, and James R Faeder. Duration of T cell stimulation as a critical determinant of cell fate and plasticity. Science signaling, 6(300):ra97, 2013.
- [Nichol et al., 2015] Daniel Nichol, Peter Jeavons, Alexan- der G Fletcher, Robert A Bonomo, Philip K Maini, Jerome L Paul, Robert A Gatenby, Alexander RA Ander- son, and Jacob G Scott. Steering evolution with sequential therapy to prevent the emergence of bacterial antibiotic re- sistance. PLoS Comput Biol, 11(9):e1004493, 2015.
- [Orlando et al., 2012] Paul Orlando, Robert Gatenby, and Joel Brown. Cancer treatment as a game: integrat- ing evolutionary game theory into the optimal control of chemotherapy. Physical Biology, 9, 2012.
- [Pandiyan et al., 2007] Pushpa Pandiyan, Lixin Zheng, Satoru Ishihara, Jennifer Reed, and Michael J Lenardo. CD4+ CD25+ Foxp3+ regulatory T cells induce cytokine deprivation-mediated apoptosis of effector CD4+ T cells. Nature immunology, 8(12):1353-1362, 2007.
- [Pazis and Parr, 2013] Jason Pazis and Ronald Parr. PAC optimal exploration in continuous space Markov decision processes. In AAAI Conference on Artificial Intelligence (AAAI), 2013.
- [Pearl, 1981] Judea Pearl. Heuristic search theory: Survey of recent results. In IJCAI, volume 1, pages 554-562, 1981.
- [Ramanujan and Selman, 2011] Raghuram Ramanujan and Bart Selman. Trade-offs in sampling-based adversarial planning. In ICAPS, pages 202-209, 2011.
- [Saadatpour et al., 2010] Assieh Saadatpour, István Albert, and Réka Albert. Attractor analysis of asynchronous boolean models of signal transduction networks. Journal of theoretical biology, 266(4):641-656, 2010.
- [Sandholm, 2012] Tuomas Sandholm. Medical treatment planning via sequential games. U.S. Provisional Patent Application, 2012.
- [Sandholm, 2015] Tuomas Sandholm. Steering evolution strategically: Computational game theory and opponent exploitation for treatment planning, drug design, and syn- thetic biology. In AAAI Conference on Artificial Intelli- gence (AAAI), 2015. Senior Member Track.
- [Silver and Veness, 2010] David Silver and Joel Veness. Monte-carlo planning in large pomdps. In Advances in neural information processing systems, pages 2164-2172, 2010.
- [Somani et al., 2013] Adhiraj Somani, Nan Ye, David Hsu, and Wee Sun Lee. Despot: Online pomdp planning with regularization. In Advances in neural information process- ing systems, pages 1772-1780, 2013.
References were extracted automatically from the PDF and may contain errors.
Full text extracted automatically from the PDF; figures, tables and equations may differ. The PDF is the version of record.
1 Introduction
Biological adaptation is a powerful mechanism that makes many disorders hard to combat. Recently Sandholm [2015; 2012] proposed the idea of steering biological evolution and/or adaptation strategically by modeling the problem as a two-player zero-sum multi-step (potentially incompleteinformation) game between the biological entity and a treater. He proposed that treatment plans be computed by algorithms that find game-theoretic solutions or by opponentexploitation algorithms.
We present, to our knowledge, the first implemented system and first experimental results on steering biological adaptation using sequential plans. We show that the framework can be used to steer a biological entity modeled, for example, via a complex signaling pathway network that has numerous feedback loops that operate at different rates and have hardto-understand aggregate behavior. We apply the framework to steering the adaptation of a patient's immune systemspecifically to steering T cell differentiation via sequential planning. The end goal is to customize the patient's immune system to better battle the disease at hand (e.g., cancer) or to reorient the immune system when it has gone astray (e.g., in autoimmune diseases).
We do not use the overly conservative game-theoretic worst-case assumption about the opponent. Instead, we present an opponent-exploitation approach that leverages the extensive work that has been done-and is being done to an increasing extent-in constructing and calibrating biological models. Specifically, we introduce a general approach where we use Monte Carlo tree search (MCTS) to compute a treatment plan, and the biological entity that is to be steered is modeled by a black-box simulator that the planner calls during planning.
In this paper we apply our framework to a leading T cell model [Miskov-Zivanov et al., 2013; Hawse et al., 2015] that is available in the modeling package BioNetGen. We conduct experiments with two alternate goals: developing regulatory T cells or developing effector T cells. The former is important for preventing autoimmune diseases while the latter is associated with better survival rates in cancer patients.
We are especially interested in the effect of sequential plans, an approach that has not been explored extensively in biology-with some notable exceptions in simpler models such as analytical game-theoretic solutions to cancer treatment with a cocktail of two drugs [Basanta et al., 2012; Orlando et al., 2012], risk-averse planning in a test domain inspired by diabetes treatment [Chen and Bowling, 2012], computer experiments in a simplified HIV treatment testbed [Adams et al., 2004; Pazis and Parr, 2013], and very recent computer models of antibiotic resistance [Nichol et al., 2015]. We show that for the development of regulatory T cells, sequential plans yield significantly higher utility than the best static therapy. In contrast, for developing effector T cells, we find that (at least for the given simulator, objective function, action possibilities, and measurement variables) 1step plans suffice to yield maximum utility.
There has been interesting work on exploiting the opponent's limited lookahead both in games of complete (e.g., [Pearl, 1981; Ramanujan and Selman, 2011]) and incomplete information [Kroer and Sandholm, 2015]. It has been suggested that such techniques can be used to exploit biological opponents [Sandholm, 2015; 2012], but that has not been done to date. The approach in this paper is also different in that it does not require the opponent to be myopic.
Our results serve as a proof of concept that existing signaling pathway network models are already sufficient for supporting the generation of sophisticated steering (treatment) plans that perform significantly better than the best static therapies. With the ability to do such experiments first in silico, significant time and cost savings can be obtained by reducing the needed in vitro and in vivo experimentation.
In the rest of the paper we first present the biological problem, then the planning technique, then the biological simulation setup, and then the experimental results. Finally, we present conclusions and future research directions.
2 Immune system basics and T cell model
The problem we are considering is that of steering a patient's immune system to more appropriately battle the disease that the patient has. In particular, we study steering of T cell differentiation.
T cells are a central component of the immune system. T cells can differentiate into various effector T cells that can effectively fight specific pathogens. Conversely, they can differentiate into regulatory T cells that can suppress these effector functions. This is important since effector cells, while effective at fighting pathogens, can also have adverse effects. Thus, differentiation to either effector or regulatory cells is desirable under different conditions. For example, in cancer, more effector cells would be desirable while in autoimmune diabetes more regulatory cells would be desirable. We will present experiments on both problems: steering T cell differentiation towards regulatory T cells or effector T cells.
The mechanism through which we consider this steering is by activating or inhibiting cytokines, stimulating the T cell receptor (TCR), and manipulating protein expression. We present the exact action sets available to our steering strategy in detail in the experimental section.
We show that one can take an existing models of a biological entity as a black box and use it to support sequential planning. In particular, we show that one can use a complex signaling pathway network model-that has numerous feedback loops that operate at different rates and have hardto-understand aggregate behavior-as-is to support effective sequential planning.
To model the T cell-and its responses to the steering stimuli-we use a recent T cell model from the biology literature as is. We thank Penelope Morel, professor of immunology, for providing significant immunology expertise regarding the goals of the steering, what steering actions can realistically be taken, etc.
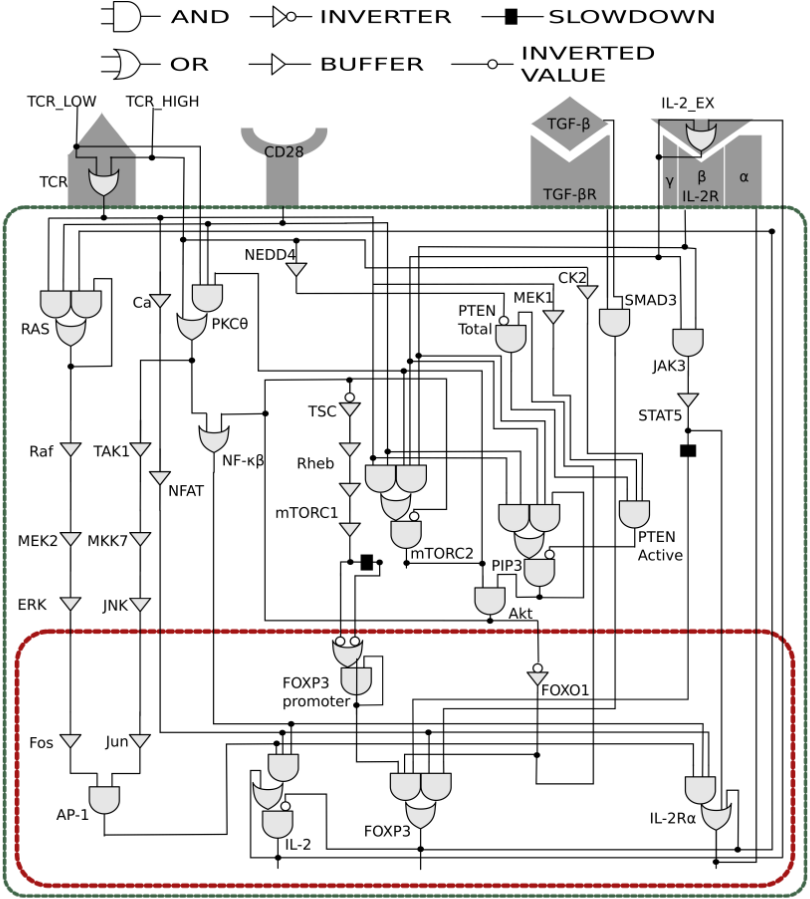
An early version of the model was developed by MiskovZivanov et al. [2013] and it was extended to become the model used here by Hawse et al. [2015]. The model is a Boolean logical network, where stochastic application of logic update rules simulate the temporal response of the T cell. Figure 1 shows the model. The green rectangle shows the boundary of the cell wall. The elements that we stimulate are shown on the outside of the cell wall. The cell nucleus is denoted by the red rectangle. As can be seen, the cell is represented by a Boolean logical circuit, which models the response propagation throughout the cell. Each biological variable in the signaling network is converted to one or more logic gates, as shown in the figure. How gates update during simulation varies depending on the type. Gates between biological variables update between iterations, whereas gates within a single biological variable immediately update their values as a single unit. As an example, consider PTEN Total in Figure 1. PTEN Total is turned on if NEDD4 is off and FOXO1 is on. A textual representation of the model be found online 1 .
In this model, the state of the system is always a vector of Boolean values. This corresponds to the state of a single cell. To get concentrations of a cell population, many simulations are run to see what a population would look like. However, in most of our experiments, the cells converge to steady state, where they all reach the same configuration.
2.1 T cell simulator
In order to simulate the process of T cell adaptation, we use the biological modeling and simulation package BioNetGen [Faeder et al., 2009; Harris et al., 2015]. BioNetGen is a popular 2 software package for modeling and simulating biological networks.
In order to simulate biological adaptation, a simulation algorithm must be applied to the Boolean model. Our simulation is performed according to the general asynchronous update scheme [Saadatpour et al., 2010] for Boolean models, using Gillespie's direct stochastic simulation algorithm [Gillespie, 1976]. This is in line with the experiments performed in the original development of this Boolean T cell model, where the same algorithms were used and the model was calibrated with wet lab experiments [Miskov-Zivanov et al., 2013; Hawse et al., 2015]. Asynchronous updating means that, at each simulation time step, a single rule is chosen at random, and the "output" variables of that rule are chosen for updating. This has been shown to better approximate the varied time scale of different biological processes than updating all rules at once [Saadatpour et al., 2010]. The T cell model by Hawse et al. is designed to leverage this update scheme, by introducing several chains of rules that mimic slower processes. All of this simulation functionality is provided in BioNetGen, and we use it as is, so that we do not introduce artifacts that were not present in the original biology work where the model was calibrated using wet lab experiments.
1 http://bionetgen.org/index.php/PTEN model. Both a reduced model and full model are presented at that URL. We use the full model.
2 It has the largest description on en.wikipedia.org/wiki/Rule-based modeling . Retrieved 2016-02-02.
3 Planning approach
Formally, our problem of guiding T cell differentiation can be described as a partially observable Markov decision process (POMDP). We have a set of states, where each state consists of the current assignment of values to all variables in the Boolean model. At each time step, we are able to observe the value of a subset of the variables. When we apply an action, the simulator stochastically moves to a new state. However, we do not know the transition probabilities associated with the state-action pairs. Terminal states are reached after a prespecified number of actions have been taken, referred to as the depth of the plan. The utility at a terminal state is a function from the values of observable variables to a real number. In this paper we consider linear functions, but any easily computable function can be used. A sequential plan is a mapping from the sequence of observed states and actions to an action. So, note that the plan is not Markovian.
To solve the planning problem, we use Monte Carlo tree search (MCTS). MCTS is a conceptually simple algorithm for finding decisions in a sequential decision space. It works by repeatedly sampling decisions, thereby iteratively constructing the search tree for the decision problem at hand. We apply the UCT algorithm [Kocsis and Szepesv´ari, 2006], which is an instantiation of MCTS that uses the UCB1 criterion [Auer et al., 2002] for choosing actions at a decision node v:
Here A(v) is the set of actions available at the node, wa is the sum of values received from taking action a at v in previous iterations, na is the number of times action a has been taken, and nv is the number of visits to node v. The value lnnv na is usually taken to be 1 for na = 0, so that every action is taken once before exploitation starts. The parameter c is chosen so as to balance exploration and exploitation.
UCB1 balances exploration and exploitation by favoring actions with high expected value (the term wi ni ), but also favoring actions that have been taken few times (the term cq ln nv na ). These two terms ensure that promising actions are explored more thoroughly, while guaranteeing that we will eventually find any undiscovered high-utility actions. Intuitively, UCB1 treats each decision node as a multi-armed bandit problem, where the reward of an action is determined by the sampled rewards from simulation in the tree below.
The pseudo-code for UCT for our setting is given in Algorithm 1. The procedure UCT runs for as many iterations as desired, here denoted by N. At each iteration, the recursive method UCT-REC traverses the tree according to UCB1, interleaving decision choices and sampling updates from the black-box simulator of biological phenomena which we will describe in detail in the next section. After N iterations, the
Algorithm 1 UCT that leverages a (biology) simulator
| 1: | UCT that leverages a (biology) procedure UCT-REC(v) |
| 2: | a0 = argmaxa2A(v) wa na + cq lnnv na |
| 3: | v0 = SAMPLECHILD(v↪ a0 ) |
| 4: | res = UCT-REC(v0 ) |
| 5: | wa0 = wa0 + res |
| 6: | na0 = na0 +1 |
| 7: | return res |
| 8: | procedure UCT |
| 9: | for i = 1↪ ▷ ▷ ▷ ↪N do |
| 10: | UCT-REC(root) |
| 11: | return GREEDYPOLICY(w) |
function GREEDYPOLICY returns the best greedy policy: For each node v, the action that has the highest expected utility from past play is chosen. (For any unvisited node, a uniform strategy is applied.) This is therefore an anytime algorithm: it has a solution available at any time, and the algorithm keeps adjusting the solution as more run time (UCT iterations) is allowed. For an extensive survey of MCTS and UCT, see Browne et al. [2012].
The SAMPLECHILD procedure is where the simulator is incorporated into our approach. For a given state, once MCTS has chosen an action, that action is applied to the state representation in BioNetGen. BioNetGen then performs t simulation steps. Note that t is chosen ahead of time, and is not a parameter that the planner optimizes over. The state resulting from the t simulations is then the value returned by SAMPLECHILD.
4 Experimental setup
We conducted extensive computational experiments to test whether sequential planning can lead to better outcomes in the Boolean model of immune system adaptation, and to see what the generated plans are like. We will first describe the general setup, and then consider two particular cases: steering T cell differentiation toward regulatory cells or toward effector cells.
States and state abstraction (measured variables)
At any point, the state of the (simulated) biological system is an assignment of Boolean values to all the variables. The variables are the variables named in Figure 1, as well as additional variables (black unnamed rectangles in Figure 1) that represent slowdown in certain sequences of the model to make those paths take longer to pass activation through, as they take longer in the real biological system. These modeling choices had been made by immunologists and calibrated in in vivo and in vitro wet lab experiments [Miskov-Zivanov et al., 2013; Hawse et al., 2015]. They had been incorporated into the simulation model in BioNetGen, and we took it as a given.
The number of Boolean variables in the model (Figure 1) is 59. Thus, the size of the underlying state space is 259 . Some of the states are unreachable.
We use the same "neutral" start state as Hawse et al. [2015]. In that start state, the following variables are active (true): CD28, TSC, CD122, CD132, PTEN total, FOXP3 PROMOTER (where FOXP3 PROMOTER is a "slow-down variable" on one of the activation paths to FOXP3). All other variables are set to inactive (false). TCR is initially set to high, but the planner can immediately change this in its first action if it deems that to be desirable.
In order to limit the size of the state space for computational tractability-and for the practical medical reason that tests are costly-we include in the planner's observed state description the values of only two proteins: FOXP3 and IL-2. When it is time to choose an action, the planner can condition its action choice only on the values of those two variables, as well as which actions were taken in the past. We do not condition on past states in order to make plans smaller. Those variables were chosen because they are clearly relevant to both objective functions that we consider (described later in detail), one for steering toward regulatory T cells and one for steering toward effector T cells.
Actions
Based on the T cell model-Figure 1-and in consultation with immunologists, we decided to include the following candidate actions for consideration in the treatment plans because these concentrations are sensed at the cell surface, and thus do not require any manipulations inside the cell wall. This makes these actions relatively easy and inexpensive to apply in practice. (For example, these are used in vitro and in vivo [Hawse et al., 2015] wet lab experiments.) We consider the following set of base actions:
- ÷ TCR: high or low
- ÷ CD28: activate or inhibit
- ÷ TGFβ: activate or inhibit
- ÷ IL-2: activate or inhibit
At any given decision point, the planner can choose any subset of these four variables and any combination of values for the chosen variables. The total number of actions at each decision point is therefore P4i=0 (4i )2i = 81▷
For TCR, CD28, and TGFβ, any action applied is persistent: to turn off an activated entity, the planner must apply an inhibitor at a later stage, and vice versa. For IL-2, actions merely change the current state of the variable. This latter choice was made because we want IL-2 to be able to fluctuate, while still being manipulable. It is needed for turning on some important other variables such as FOXP3, but we also want it to be able to turn back off, as its levels are an indirect indicator of regulatory and effector cell development.
Simulation
We experimented with four different simulation times t: 36↪ 72↪ 360↪ and 1080 in order to vary how much time the T cells have to adjust after each treatment action. We considered treatment plans of depth 1↪ 2↪ and 3. For any simulation time length t and plan depth d, our experiments were conducted as follows. First, an action is chosen. Then td time steps of simulation are applied. This is repeated d - 1 times. Finally, the d'th action is applied, and t simulation steps are applied. This scheme, where we apply t simulation steps after the last action regardless of plan depth, was chosenconservatively against our multi-step planning approach-in order to minimize the chance that a longer plan depth would perform better simply because of the ability to set desirable unstable variables closer to the end of the simulation.
UCT setup
For each experiment, we ran UCT for 3000 iterations. At every 100th iteration, we took the current greedy policy and sampled an expected value by performing 100 rollouts of BioNetGen simulations with that strategy.
We repeated each experiment 7 times, and report the average expected values over the 7 experiments.
5 Experimental results
In this section we present results from our computational experiments. The first subsection covers experiments where the goal is to steer T cell adaptation toward regulatory cells. The second subsection will cover experiments where the goal is to steer T cell adaptation toward effector cells.
5.1 Steering toward regulatory cells
For regulatory cell development, we used a utility function consisting of the following sum over Boolean variables:
These are variables that are generally thought to be positively (the first three) or negatively (the last two) associated with regulatory T cell development [Fontenot et al., 2003; Ma et al., 2012; H¨ofer et al., 2012; Pandiyan et al., 2007; MiskovZivanov et al., 2013; Hawse et al., 2015]. 3
Figure 2 shows the results of running UCT on this utility function. The x-axis shows the number of UCT iterations performed. Note that the x-axis does not correspond to steps of the plan. The y-axis shows the expected value of the currently computed greedy policy, measured according to the utility function described above. The four figures show the expected value for four different allowed total simulation steps t. The upper left figure shows t = 36. The upper right shows t = 72. The lower left shows t = 360. The lower right shows t = 1080.
For each simulation time, we see an increase in expected value from longer plan depth. This shows that there is significant extra power from multi-step contingency plans compared to static immunotherapies.
The increase in expected utility is increasing in simulation time until t = 360. For t = 360 and t = 1080 the gains are comparable. This latter observation fits with the fact that, from manual inspection, it seemed that a simulation time of 360 was usually enough to reach a steady state in the simulation, and thus the remaining 720 simulation steps would not have much of an effect.
Table 1 shows the generated 1-step and 2-step plans. (The generated 3-step plans are fairly large so they cannot be presented here. All the plans are available online 4 .) For a plan depth of 1, we found that the single action of setting TCR concentration to high was preferred. For plan depth of 2, at time step lengths 360 and 1080, we get very similar plans: TGFβ is turned on early, TCR is set to high later, and IL-2 is turned off either initially or at the end. We also see that only a single state is ever reach after taking the initial action; already around a simulation time of 180, the simulation seems to reach a steady state. For simulation times of 36 and 72 we get more uncertainty in the plans. Three to four different states are potentially reached, and the action taken differs based on which state is reached.
5.2 Steering toward effector cells
For effector cell development, we used a utility function consisting of the following sum over Boolean variables:
These two variables are generally thought to be positively and negatively associated with effector T cell development, respectively [H¨ofer et al., 2012; Pandiyan et al., 2007; Miskov-Zivanov et al., 2013; Hawse et al., 2015].
3 We also reran the experiment with the objective without "- IL2". The results were similar except that maximum average utility was already achieved with 2-step plans, that is, there was no further benefit to using 3-step plans.
4 http://www.cs.cmu.edu/⇠ckroer/files/ ijcai16-strategies/
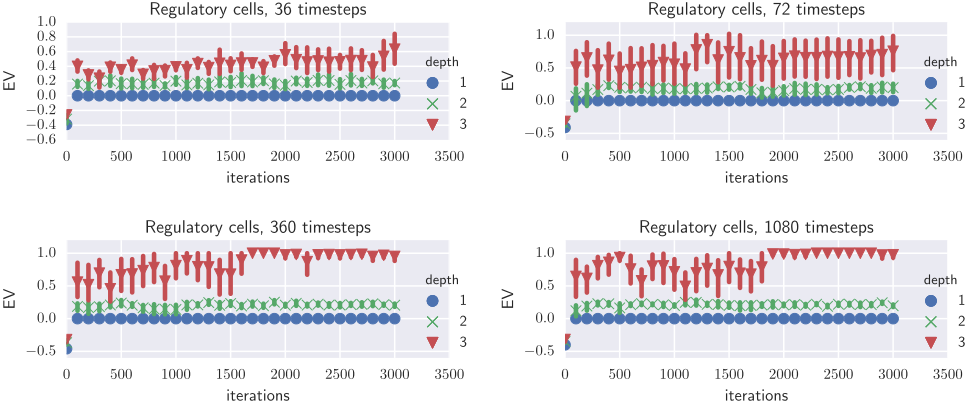
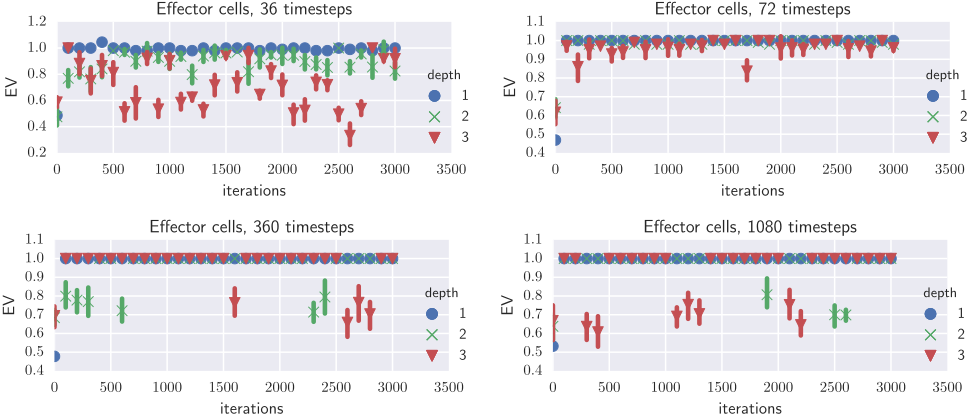
Figure 3 shows the results of running UCT on this utility function. The x-axis shows the number of UCT iterations. The y-axis shows the expected value of the currently computed greedy policy.
The results for steering toward effector cells are very different than those for regulatory cells. We found no benefit to increasing plan depth beyond 1. Optimized single-step plans reached utility 1▷0, which is the highest possible utility because the utility function is IL-2 - FOXP3 and both variables therein are Boolean. (For time steps of size 36, there was slight noise over utility so it was not always 1, probably due to the shorter time horizon leading to lower probability of reaching a stable Boolean configuration.) For all four time-step lengths, we found that increased plan depth hurts expected utility somewhat. This is because it takes longer to learn the very simple optimal plan when the plan space is larger.
6 Conclusions and future research
We presented, to our knowledge, the first built system and the first experimental results on guiding evolution or biological adaptation using sequential plans. In particular, we showed how T cell differentiation can be exploited via sequential planning for steering the adaptation of a patient's immune system. We introduced a general approach where we leverage Monte Carlo tree search to compute a treatment plan, and the biological entity that is to be steered is modeled by a black-box simulator that the planner calls during planning. We applied our framework to a leading T cell simulator that is available in the biological modeling package BioNetGen. We ran experiments with two alternate goals: developing regulatory T cells or developing effector T cells. The former is important for preventing autoimmune diseases while the latter is associated with better survival rates in cancer patients.
We were especially interested in the effect of sequential plans, an approach that has not been extensively explored in biology. We showed that for the development of regulatory cells, sequential plans yield significantly higher utility than the best static therapy. In contrast, for developing effector cells, we find that (at least for the given simulator, objective function, action possibilities, and measurement variables) 1step plans suffice to yield maximum utility.
We showed that one can use a complex signaling pathway network model-that has numerous feedback loops that operate at different rates and have hard-to-understand aggregate behavior-as-is to support effective sequential planning. These results serve as a proof of concept that existing signaling pathway models, which are typically qualitative (Boolean) and undoubtedly still incomplete, are already sufficient for supporting the generation of sophisticated treatment plans that perform significantly better than the best static therapies. To verify that the plans are effective in reality, future work involves evaluating them in vitro and in vivo as well.
In future work it would be interesting to also consider actions with longer durations, although that is partially captured in our experiments where the same action can be applied in multiple consecutive steps of our plans (the difference is that there is simulation in between actions). Future work also involves testing our approach on quantitative biological models, such as those where the activations of nodes are characterized by ordinary differential equations.
There is also ample opportunity to study which actions should be included in the action sets available for planning, and which state variables should be measured. Both of these choices involve a tradeoff between possible solution quality and computational effort, and the latter also affects testing costs. With the ability to do those and other experiments first in silico, significant time and cost savings can be obtained by reducing the needed in vitro and in vivo experimentation.
| Observed state | Action to apply |
|---|---|
| 1-step plans All four BioNetGen simulation steps Initial state (depth 0): | TCR=1 |
| 2-step plans 36 BioNetGen sim. steps Initial state (depth 0): Depth 1, FOXP3=0, IL-2=0: Depth 1, FOXP3=0, IL-2=1: Depth 1, FOXP3=1, IL-2=0: Depth 1, FOXP3=1, IL-2=1: | TCR=1, TGFβ=1, IL-2=0 nothing TCR=0 , CD28=0 CD28=0 TCR=0 , CD28=0 , IL-2=1 |
| 2-step plans 72 BioNetGen sim. steps Initial state (depth 0): Depth 1, FOXP3=0, IL-2=0: Depth 1, FOXP3=0, IL-2=1: Depth 1, FOXP3=1, IL-2=0: | TCR=1, TGFβ=0 , IL-2=0 nothing TCR=0, CD28=0, TGFβ=1 CD28=0, TGFβ=1, IL-2=1 |
| 2-step plans 360 BioNetGen sim. steps Initial state (depth 0): Depth 1, FOXP3=0, IL-2=1: | TGFβ=1, IL-2=0 TCR=1 |
| 2-step plans 1080 BioNetGen sim. steps Initial state (depth 0): Depth 1, FOXP3=0, IL-2=1: | TGFβ=1 TCR=1, IL-2=0 |
Future work also involves using our multi-step steering approach for steering other biological entities beyond T cells, such as steering the evolution of bacteria or viruses into states where they can be effectively tackled, steering cancer cell populations to states where they can be destroyed without leaving persistors, or, in synthetic biology, steering bacteria into states where they perform useful tasks (such as consuming oil spills) without introducing foreign genetic material into the bacteria, which is costly and risky.
Finally, there are opportunities for better performance by considering other, more sophisticated, planning algorithms. For example, algorithms such as POMCP [Silver and Veness, 2010] or DESPOT [Somani et al., 2013] could allow better scalability, and thereby enable analysis of larger models.
Acknowledgements This material is based on work supported by the National Science Foundation under grants IIS1320620 and IIS-1546752, and by the ARO under award W911NF-16-1-0061. We thank Penelope A. Morel, JoseJuan Tapia, James R. Faeder, and Natasa Miskov-Zivanov for providing immunology expertise, and for discussions about the biological model and simulation. We also thank the anynomous reviewers and SPC members for useful critiques and interesting new directions.
@inproceedings{ijcai2016p450,
  title     = {Sequential Planning for Steering Immune System Adaptation},
  author    = {Kroer, Christian and Sandholm, Tuomas},
  booktitle = {Proceedings of the Twenty-Fifth International Joint Conference on
               Artificial Intelligence, {IJCAI-16}},
  publisher = {AAAI Press / International Joint Conferences on Artificial Intelligence},
  editor    = {Subbarao Kambhampati},
  pages     = {3177--3183},
  year      = {2016},
  month     = {7},
  url       = {https://ijcai.org/proceedings/2016/450},
}
TY - CPAPER TI - Sequential Planning for Steering Immune System Adaptation AU - Kroer, Christian AU - Sandholm, Tuomas T2 - Proceedings of the Twenty-Fifth International Joint Conference on Artificial Intelligence, IJCAI-16 PB - AAAI Press / International Joint Conferences on Artificial Intelligence PY - 2016 SP - 3177 EP - 3183 UR - https://ijcai.org/proceedings/2016/450 ER -Copied
Machine-readable versions of this paper, for tools and AI agents:





