
An Intelligent System for Taxi Service Monitoring, Analytics and Visualization
Proceedings of the Twenty-Fifth International Joint Conference on Artificial Intelligence. Pages 4256-4256.
Abstract
The fast advancement in sensor data acquisition and communication technology greatly facilitates the collection of data from taxis, and thus enables analyzing the citywide taxi service system. In this paper, we present a novel and practical system for taxi service monitoring, analytics and visualization. By utilizing both of the buffered streaming and the large-size historical taxi data, the system focuses on wait time estimation (for both passengers and taxi drivers), citywide taxi pickup/dropoff hotspots, as well as the taxi trip distributions. The three-dimensional (3D) visualization is designed for users to access the analytics results and understand the characteristics of the taxi service.
- [Lu et al., 2015] Yu Lu, Shili Xiang, and Wei Wu. Taxi queue, passenger queue or no queue? -a queue detec- tion and analysis system using taxi state transition. In Proc. International Conference on Extending Database Tech. (EDBT), 2015.
- [Shao et al., 2015] Dongxu Shao, Wei Wu, Shili Xiang, and Yu Lu. Estimating taxi demand-supply level using taxi trajectory data stream. In Proc. IEEE International Con- ference on Data Mining (ICDM) Workshop, 2015.
References were extracted automatically from the PDF and may contain errors.
Full text extracted automatically from the PDF; figures, tables and equations may differ. The PDF is the version of record.
1 Introduction
In many other large cities, especially in Asia, taxis are pervasively used in people's daily lives, such as for individual travel between home and office, or family travel for shopping and dining. Such a pervasive taxi usage pattern easily results in complex traffic characteristics as well as the spatiotemporal imbalance of taxi demand and supply. It would be highly useful for the related government agencies and taxi operators to understand such citywide characteristics and estimate the existing imbalance, and accordingly to improve the service quality and productivity of the taxi system.
On the other hand, the abundance of taxi information, including taxi's real time GPS location and taxi operation status, can be collected through the in-vehicle telematics system in a timely way. For example, nearly all the taxis in Singapore periodically update their location, status (e.g., FREE and ONCALL) and other important information to the backend system. Utilizing the collected taxi data would directly help to monitor, analyze and extract the key information of the taxi system. Moreover, a well-designed visualization and user interface would enable users to grasp the key meanings of the analytics results and gain the hidden insights.
We present a novel intelligent system, utilizing both of the historical and streaming taxi data, to conduct the analytics on the key perspectives of the taxi service, including the wait time estimation, taxi hotspot detection and trip extraction. The novel statistical and operation related features are used to build the predictive models. Moreover, we design a 3D visualization and informative user interface for the system users. We also adopt the data analytics algorithms reported in [Lu et al., 2015].
2 SystemDesign
2.1 SystemOverview
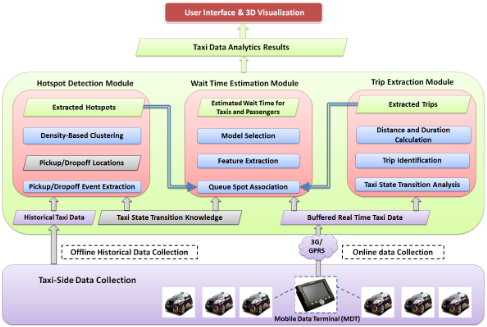
The system block diagram is shown in Fig. 1, and it mainly consists of three modules: (a) Wait Time Estimation Module; (b) Hotspot Detection Module; and (c) Trip Extraction Module. The inputs for the three modules are the collected data from individual taxis. The taxi data collection is mainly leveraging on a special device, called mobile data terminal (MDT), which has been installed on nearly all 26 thousand taxis. The MDT keeps collecting taxi's real time GPS locations, speed and taxi status, e.g., FREE (available for passenger), ONCALL (booked by passenger), POB (passenger on board), PAYMENT(passenger making payment), etc. The taxi data collection can be conducted both online and offline, and the online collection is mainly relying on the 3G or GPRS communication between MDT and the backend system. The Wait Time Estimation Module and Trip Extraction Module mainly utilize the online buffered streaming data, while the Hotspot Detection Module requires the large-size offline historical data.
2.2 Wait Time EstimationModule
This module mainly has two design objectives: estimation on passenger wait time and taxi wait time. For the passenger wait time, we build the predictive model based multiple features, including the FREE taxi taken (FTT) probability and taxi booking ratio. Briefly speaking, FTT probability captures how fast an available taxi is taken in a given region. It is motivated by the fact that FREE taxis have a higher probability to get passengers quickly where passengers have a longer waiting time. FTT probability shows strong positive correlation with the average passenger wait time, and similar results can be found in [Shao et al., 2015]. Taxi booking ratio is defined as the number of ONCALL taxis that successfully transit to HIRED to the total number of taxis that successfully transit to HIRED at the given region. It is motivated by that fact that in our city, passengers usually prefer hailing down a FREE taxi rather than booking one because of the a high booking fee. Thus, a high booking ratio is very likely caused by the long wait time of passengers in that region.
For the taxi wait time estimation, we mainly focus on the average wait time after taxis joining a taxi queue. Thus, we need to firstly decide the locations that taxi queues may occur. Taxi pickup hotspots are usually the taxi queue locations and can be captured by the hotspot detected module, which will be elaborated in the next subsection. Based on the detected taxi queue locations, we adopt queuing theory to infer the existence of taxi queues and then estimate the corresponding average taxi wait time, where pickup event sub-trajectories and status transition intervals are utilized.
The current output of wait time estimation module is not the exact wait time values, but the four predefined levels: severe (above 10 mins), large (5 to 10 Mins), reasonable (2 to 5 mins) and short (below 2 mins).
2.3 Hotspot DetectionModule
Briefly speaking, the module adopts two steps to detect the pickup hotspots from the taxi data. Firstly, it extracts all the taxi pickup locations using the taxi state transition. Secondly, it conducts the density based clustering, such as DBSCAN, on the extracted pickup locations, and the centroids of the found clusters are the detected pickup hotspots. Note that detecting hotspots normally required a relatively long period of taxi data and thus the module mainly uses the large-size historical taxi data collected offline.
2.4 Trip ExtractionModule
This module mainly extract the trip information, which is typically a sub-trajectory starting with a pickup event (e.g., FREE ! HIRED), then a number of continuous POB updates, and ending with a dropoff event (POB ! PAYMENT).
3 Visualization and Insights
To access and monitor the key information of the taxi system, we build the 3D visualization and user interface: Fig. 2a shows the average passenger wait time, and we see that four colors, representing the four wait time ranges, depict the different predefined regions. The three regions on the city west (the left side of the map) are all in red (more than 10 mins), which is probably due to the low taxi supply in that remote area. Most of other regions, where a better balance between the taxi supply and demand during the same time, are in other light colors. Each region can be defined, configured, and highlighted by the system users.
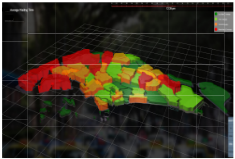
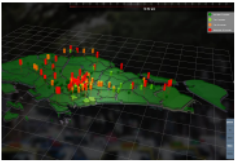
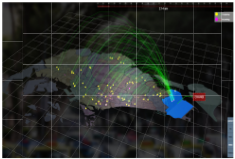
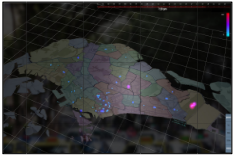
Figure 2: 3D Visualization and User Interface
Fig. 2b shows the average taxi wait time, where a number of small bars are used to depict taxi wait time at the hotspots. Fig. 2c shows the extracted trips at the selected region, where the green lines represent the outgoing trips and the pink lines represent the incoming trips. We see that currently most lines are in green and a few in pink. The users can freely select other regions and previous time slots to see the incoming/outgoing trip patterns. Fig. 2d shows the detected pickup hotspots, and we see that the central business area (bottom of the map) gathers most of the hotspots.
4 Conclusion
We demonstrate an intelligent system for taxi service monitoring, analytics and visualization. It contains the three analytics modules and a 3D user interface. Based on the historical and buffered taxi data, we derive different features, such as FTT probability and taxi booking ratio, to estimate wait time, detect hotspots and extract taxi trips. Moreover, we design the frontend 3D visualization and interactive user interface to access and monitor the key information. This demonstration does not need the special arrangement and device, but a large-size screen would be preferred.
@inproceedings{ijcai2016p648,
  title     = {An Intelligent System for Taxi Service Monitoring, Analytics and Visualization},
  author    = {Lu, Yu and Chua, Gim Guan and Wu, Huayu and Ong, Clement Shi Qi},
  booktitle = {Proceedings of the Twenty-Fifth International Joint Conference on
               Artificial Intelligence, {IJCAI-16}},
  publisher = {AAAI Press / International Joint Conferences on Artificial Intelligence},
  editor    = {Subbarao Kambhampati},
  pages     = {4256--4256},
  year      = {2016},
  month     = {7},
  url       = {https://ijcai.org/proceedings/2016/648},
}
TY - CPAPER TI - An Intelligent System for Taxi Service Monitoring, Analytics and Visualization AU - Lu, Yu AU - Chua, Gim Guan AU - Wu, Huayu AU - Ong, Clement Shi Qi T2 - Proceedings of the Twenty-Fifth International Joint Conference on Artificial Intelligence, IJCAI-16 PB - AAAI Press / International Joint Conferences on Artificial Intelligence PY - 2016 SP - 4256 EP - 4256 UR - https://ijcai.org/proceedings/2016/648 ER -Copied
Machine-readable versions of this paper, for tools and AI agents:





