
A Tool for Generating Interactive Euler Diagrams
Proceedings of the Twenty-Fifth International Joint Conference on Artificial Intelligence. Pages 4266-4266.
Abstract
We describe a tool for generating Euler diagrams from a set of region connection calculus formulas. The generation is based on a variant of local search capturing default reasoning for improving aesthetic appearance of Euler diagrams. We also describe an optimization for diagrams to be interactive: the user can modify the diagram with the mouse while formulas are still satisfied. We also discuss how such a tool may propose new relevant formulas to add to the specification using an approximation algorithm based on the satisfiability of Horn clauses.
- [Dechter et al., 1991] Rina Dechter, Itay Meiri, and Judea Pearl. Temporal constraint networks. Artif. Intell., 49(1- 3):61-95, 1991.
- [Dowling and Gallier, 1984] William F. Dowling and Jean H. Gallier. Linear-time algorithms for testing the satisfiability of propositional horn formulae. J. Log. Program., 1(3):267-284, 1984.
- [Micallef, 2012] Luana Micallef. Visualizations with Venn and Euler diagrams. In Proceedings of the Grace Hopper Celebration of Women in Computing, PhD Forum, 2012.
- [Randell et al., 1992] David A. Randell, Zhan Cui, and An- thony G. Cohn. A spatial logic based on regions and con- nection. KR, 92:165-176, 1992.
- [Rodgers, 2014] Peter Rodgers. A survey of Euler diagrams. J. Vis. Lang. Comput., 25(3):134-155, 2014.
- [Schwarzentruber, 2015] Franc ¸ois Schwarzentruber. Draw- ing interactive euler diagrams from region connection cal- culus specifications. Journal of Logic, Language and In- formation, 24(4):375-408, 2015.
References were extracted automatically from the PDF and may contain errors.
Full text extracted automatically from the PDF; figures, tables and equations may differ. The PDF is the version of record.
1 Introduction
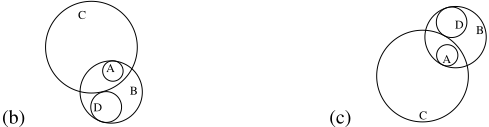
In biology, mathematics, etc. concepts and their relations are naturally represented by Euler diagrams [Rodgers, 2014]. The objective of this work is to render automatically Euler diagrams from a finite set of logical formulas. For instance, from the formulas given in Figure 1(a), the system should produce a drawing similar to the one presented in Figure 1(b) 1 .
Deciding the existence of a Euler diagram made up of circles that respects a given specification written in Region Connection Calculus is NP-hard ([Schwarzentruber, 2015]). As a consequence, it is relevant to consider search techniques such as local search, genetic algorithms, etc.
An important issue is subjective aesthetic aspects of the generated drawing and the user may not be delighted by the rendering of a given tool [Micallef, 2012]. We propose an implementation written in Javascript 2 where the aesthetic is taken into account by two aspects: default reasoning and interactive drawings.
2 Specification language
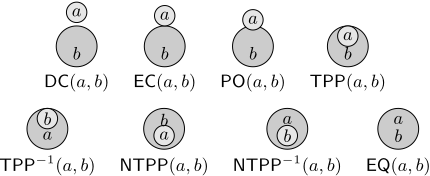
The specification language used to describe Euler diagrams is Region Connection Calculus [Randell et al., 1992] RCC-8 (see Figure 2) extended with radius constraints. Euler diagrams are collection of disks.
1 Note that the specification language is expressive enough to capture topological properties.
2 http://people.irisa.fr/Francois.Schwarzentruber/ constrainteddrawing/
four circles A, B, C, D
- A is a tangential proper part of B
- D is a tangential proper part of B
- (a) A is non-tangential proper part of C D and C are externally connected radius of A is 20 radius of B is 60 radius of C is 90 radius of D is 30
3 Default reasoning
In the state of the art, Schwarzentruber [Schwarzentruber, 2015] proposes an improvement of local search in order to speed up the generation of a drawing. It consists in calling local search and a randomized gradient method and the new obtained method is called hybrid method.
Our first contribution to improve aesthetic aspects is to provide constraints that are prioritized. For instance, a formula alone such as "A is non-tangential proper part of C" should generate
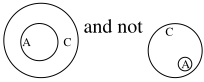
Thus, a formula "A is non-tangential proper part of C" produces a high priority constraint saying that A should indeed be a non-tangential proper part of C and a low priority constraint saying that A and B should be concentric and the radius of A should be half the radius of B. Constraints are represented by objective functions as for local search. The more the value of an objective function is close to 0, the more the constraint is satisfied.
4 Interactivity
Also for aesthetic reasons, Euler diagrams are interactive: the user can interact with the diagram by moving regions with the mouse and the diagram adjusts itself while keeping the formulas satisfied. For instance, starting from Figure 1(b), by moving circle D to the top, the system displays 1(c). Hybrid method [Schwarzentruber, 2015] was already considered as a natural algorithm that keeps improving the current drawing when the user interacts.
Our second contribution is a smoother interaction (it is measured by two factors: the constraint satisfaction and the fact that the new obtained diagram is close to the initial one). It uses randomized Breadth First Search in the constraint graph starting from the moved circle. For instance, if the user moves circle D:
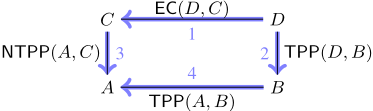
We then apply some corrections for each edge traversal. For instance, during a traversal a b EC(a↪ b) , if EC(a↪ b) not satisfied, then circle b is moved so that the distance of centers of a and b is b▷r + a▷r.
5 Avoiding irrelevant guessed new constraints
During interaction, the software detects new constraints to add in the knowledge base. For instance, if the user moves circle a so that a overlaps circle b, the software may propose to add formula PO(a↪ b) as a new candidate formula. The user then decides to effectively add PO(a↪ b) to the knowledge base or not.
The issue is that if we proceed naively the software will propose all candidate formulas ' (i.e. such that the value of the associated objective function is low), some candidates may be irrelevant. Indeed, the software would propose formulas that are already logical consequences of the knowledge base. For instance, if NTPP(a↪ b) and NTPP(b↪ c) are in the knowledge base, it is irrelevant to propose NTPP(a↪ c) since ¶NTPP(a↪ b)↪ NTPP(b↪ c)♦ ♣= NTPP(a↪ c).
As RCC-8 with circles is not tractable [Schwarzentruber, 2015], our third contribution is to propose a polynomial approximation algorithm in the spirit of [Dechter et al., 1991]. Our algorithm takes as an input the constraint graph (see Section 4). We then saturate the graph G with the following rules:
- if NTPP(a↪ b), NTPP(b↪ c) in G, add edge NTPP(a↪ c);
- if NTPP(a↪ b), EC(b↪ c) in G, add edge DC(a↪ c);
- if NTPP(a↪ b), DC(b↪ c) in G, add edge DC(a↪ c);
- if TPP(a↪ b), DC(b↪ c) in G, add edge DC(a↪ c);
- if NTPP(a↪ b), TPP(b↪ c) in G, add edge NTPP(a↪ c);
- if TPP(a↪ b), NTPP(b↪ c) in G, add edge NTPP(a↪ c).
The algorithm stops when no more edge is added. At the end, if there is an edge labeled by ', then it means that ' is logical consequence of the knowledge base. The six rules above can be seen as Horn clauses of classical proposition logic (item 1 corresponds to (NTPP(a↪ b) ^ NTPP(b↪ c)) ! NTPP(a↪ c), etc.). Also, initial edges in the constraint graph are Horn clauses made up of one single literal Saturation of a given set of Horn clauses can be implemented in linear time in the size of the input [Dowling and Gallier, 1984]. The number of such clauses is here in O(k3 ) where k is the number of circles: O(k3 ) Horn clauses for the six constraints above and O(k2 ) for the single literal clauses coming from the initial constraint graph). Therefore, our approximation algorithm runs in O(k3 ).
6 Demonstration
During the demonstration, the user can create new specifications either by typing them or by adding/moving circles and by letting the software guessing new constraints. The user can also move circles and the current drawing is updated in real-time.
7 Conclusion
Interestingly, algorithms based on formal methods (our approximation algorithm of subsection 5, SMT techniques, etc.) and local search are complementary: the first helps to improve the user interface features (guessing constraints, etc.) while the later concerns the generation and the interaction.
This work could lead to a new generation of intelligent drawing softwares that understand user intentions, guess constraints and produce consistent pictures.
@inproceedings{ijcai2016p653,
  title     = {A Tool for Generating Interactive Euler Diagrams},
  author    = {Schwarzentruber, François},
  booktitle = {Proceedings of the Twenty-Fifth International Joint Conference on
               Artificial Intelligence, {IJCAI-16}},
  publisher = {AAAI Press / International Joint Conferences on Artificial Intelligence},
  editor    = {Subbarao Kambhampati},
  pages     = {4266--4266},
  year      = {2016},
  month     = {7},
  url       = {https://ijcai.org/proceedings/2016/653},
}
TY - CPAPER TI - A Tool for Generating Interactive Euler Diagrams AU - Schwarzentruber, François T2 - Proceedings of the Twenty-Fifth International Joint Conference on Artificial Intelligence, IJCAI-16 PB - AAAI Press / International Joint Conferences on Artificial Intelligence PY - 2016 SP - 4266 EP - 4266 UR - https://ijcai.org/proceedings/2016/653 ER -Copied
Machine-readable versions of this paper, for tools and AI agents:





