
VIPR: An Interactive Tool for Meaningful Visualization of High-Dimensional Data
Proceedings of the Twenty-Fifth International Joint Conference on Artificial Intelligence. Pages 4274-4274.
Abstract
Analysis, pattern discovery, and decision support can all benefit greatly from informative and interpretable visualizations, especially of high-dimensional data. Informative Projection Ensemble (IPE) methodology has proven effective in finding interpretable renderings of high-dimensional data that reveal hidden low-dimensional structures in data if such structures exist. In this demonstration, we present a powerful analysis tool that uses IPE methodology in support of fundamental machine learning tasks: regression, classification, and clustering. Our tool is an interactive web application operating on 2D and 3D projections of data automatically selected by IPE algorithms as informative for the user-specified data and task.It also provides RESTful APIs enabling remote users to seamlessly integrate our service with other tools and to easily extend its functionality. We show in examples how it can discover hidden interpretable structures embedded in high-dimensional data.
- [Bach et al., 2012] F. Bach, R. Jenatton, J. Maira, and G. Obozin- ski. Optimization with sparsity-inducing penalties. Foundations and Trends in Machine Learning, 2012.
- [Fiterau and Dubrawski, 2013] M. Fiterau and A. Dubrawski. In- formative projection recovery for classification, clustering and regression. In ICMLA, 2013.
- [Shneiderman, 1996] B. Shneiderman. The eyes have it: A task by data type taxonomy for information visualizations. Visual Lan- guages, 1996.
- [Wang et al., 2015] D. Wang, M. Fiterau, A. Dubrawski, M. Hrav- nak, G. Clermont, and M.R. Pinsky. Interpretable active learning in support of clinical data annotation. SCCM, 2015.
References were extracted automatically from the PDF and may contain errors.
Full text extracted automatically from the PDF; figures, tables and equations may differ. The PDF is the version of record.
1 Importance of Informative Projections
Throughout the past decade, we have witnessed a rapid growth of extensive collections of data that appear sufficiently complex and intimidating to limit their utility to average audiences. The Machine Learning community has been answering this challenge by developing increasingly powerful and accurate, but predominantly also quite complex models. While trained data scientists have a keen understanding of such models, these models are rather inaccessible to other people. This inhibits a widespread consumption of "Big Data" and undermines the potential impact that Machine Learning might make in various areas of societal importance.
These issues manifest themselves in numerous domains including biology, healthcare, economics, finance, or astronomy. For instance, in applications to medical diagnostics it is typically required that the models should be understood by clinicians to effectively support their decision making. Consider a cardio-respiratory monitoring system, which measures vital signs such as blood pressure, respiratory rate and heart rate. Processing and aggregating all available data, including patient health records, is required for accurate diagnosis
⇧ Stanford University
Stanford, CA, USA
and successful treatment. However, clinicians are often overwhelmed by the complexity of the available data which may lead to suboptimal treatment decisions and detract from patient care. There is a clear and present need to leverage machine learning to build predictive models based on all information available at the bed-side, while presenting the results of analyses in a communicative and interpretable manner.
Various techniques have been introduced to identify sparse predictive structures [Bach et al., 2012], typically by extracting features that appear informative globally. Localized models that consider relevant features in the neighborhood of specific queries lie at the other end of the spectrum of alternative solutions. Our system achieves a tradeoff between these two extremes using Regression for Informative Projection Recovery (RIPR) [Fiterau and Dubrawski, 2013]. RIPR splits data into disjoint subsets each typically using only 2 or 3 features. RIPR projections were shown to capture the essence of high-dimensional data while aiding knowledge discovery and interpretatability. Studies in clinical settings [Wang et al., 2015] found that informative projection models confirm clinicians' intuition and help distinguish medically valid alerts from artifacts in bedside monitors.
Our system, Visual toolkit for Informative Projection Recovery (VIPR), places visualization at the forefront of model building, which has been one of the goals of the data science community for a while [Shneiderman, 1996]. VIPR quickly finds important aspects of data and makes them more accessible than it was possible before. By constructing compact, interpretable and easily visualizable models, VIPR puts data back in the hands of its users.
2 Overview of VIPR
VIPR brings the following benefits to the community: (1) Implementation of a web service for the retrieval of IPs in support of classification, regression, and clustering; (2) Interactive user interface for meaningful visualization and annotation of data; (3) Application Programming Interface (API) that exposes the core services for seamless integration with other tools. In short, VIPR empowers researchers and analysts in their research and business intelligence.
The RIPR algorithm can be applied to different types of learning tasks with only minor adjustments. Thus, the VIPR framework can recover low-dimensional models for classification, regression and clustering, even in active learning settings, making the tool very flexible.
The outermost layer of the VIPR system is the user interface for input gathering and visualization. The plotting module, built on top of an open source library 1 produces featurerich and engaging charts without impact on rendering performance. VIPR displays multiple views of projected data in 2D or 3D ordered by their importance. Users can zoom in and out, rotate, pan across regions, show individual data points in plots, and save plots to image files. The next layer implements client-server communication in the form of RESTful APIs. The server management layer coordinates user requests to computation engines and controls algorithm execution and data management. Other layers execute RIPR and other algorithms and control data management.
3 Demonstration Plan
We demonstrate how VIPR extracts communicative models and allows its users to visualize informative patterns in low-dimensional projections of highly-dimensional data. We showcase patterns extracted from our own data and from public benchmark datasets, as well as models learned from data received ad-hoc at the demonstration site. The users will see the extraction of Informative Projection models and their visualizations in real time, under multiple settings, of at least 20 different public and proprietary datasets with diverse characteristics. Aside from the prepared examples, we allow users to set their own preferences and extract models. The extraction will happen interactively, with users having an option to manually tweak and compare the learned models. For instance, users will be able to add/remove features or samples of data from the learned models to observe the change in behavior and performance. Among the user-selectable parameters are the number of submodels, the dimensionality of the subspaces, costs associated with features, and the types of base classifier or base regressor to be used. Users will also be able to see a decision support system in action, performing classification, regression or clustering on batches of test data. The process of handling test data is also transparent, with the system highlighting the submodel it selected, and how the queries were assigned their labels or values. In practice, this transparency allows users to gain intuition about the data, but it can also prevent labeling errors. In our demonstration, the users will be able to provide feedback to the system, correcting errors in the predicted output. The system will then incorporate these corrections and update the models as necessary.
4 Example Applications
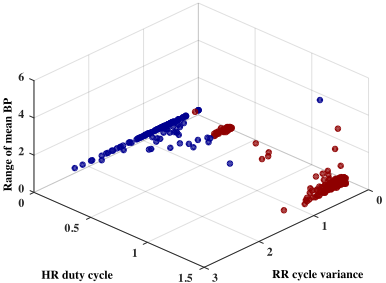
VIPR has been employed to detect artifactual alerts issued by a cardio-respiratory monitoring system. The input data consisted of 147 features extracted from patients' multiple vital sign measurements. The objective was to determine which of the alerts issued by the monitor were due to clinically meaningful circumstances (true alerts) versus malfunctions or inaccuracies of the sensing equipment (artifacts). Figure 1 depicts one of the learned informative projections which clearly separates the true alerts from the artifacts.
1 https://plot.ly/javascript/
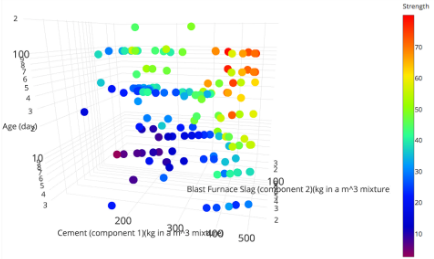
VIPR was also used for regression on UCI Concrete data, containing 8 input features for 1,030 observations. The goal was to find a model that predicts concrete strength from the input features. Figure 2 depicts RIPR regression on the first 3D projection selected to emphasize differences in the output values of test data using logarithmic scale for all axes. The color represents the strength from blue (low) to red (high).
Acknowledgements: This work was partially supported by NSF (1320347), DARPA (FA8750-12-2-0324) and NIH (U54 EB020405 and R01 NR013912).
@inproceedings{ijcai2016p657,
  title     = {VIPR: An Interactive Tool for Meaningful Visualization of High-Dimensional Data},
  author    = {Wang, Donghan and Fiterau, Madalina and Dubrawski, Artur},
  booktitle = {Proceedings of the Twenty-Fifth International Joint Conference on
               Artificial Intelligence, {IJCAI-16}},
  publisher = {AAAI Press / International Joint Conferences on Artificial Intelligence},
  editor    = {Subbarao Kambhampati},
  pages     = {4274--4274},
  year      = {2016},
  month     = {7},
  url       = {https://ijcai.org/proceedings/2016/657},
}
TY - CPAPER TI - VIPR: An Interactive Tool for Meaningful Visualization of High-Dimensional Data AU - Wang, Donghan AU - Fiterau, Madalina AU - Dubrawski, Artur T2 - Proceedings of the Twenty-Fifth International Joint Conference on Artificial Intelligence, IJCAI-16 PB - AAAI Press / International Joint Conferences on Artificial Intelligence PY - 2016 SP - 4274 EP - 4274 UR - https://ijcai.org/proceedings/2016/657 ER -Copied
Machine-readable versions of this paper, for tools and AI agents:





