
Hybrid Neural Networks for Learning the Trend in Time Series
Proceedings of the Twenty-Sixth International Joint Conference on Artificial Intelligence. Main track. Pages 2273-2279.
https://doi.org/10.24963/ijcai.2017/316
Keywords
- Machine Learning: Deep Learning
- Machine Learning: Time-series/Data Streams
Abstract
The trend of time series characterizes the intermediate upward and downward behaviour of time series. Learning and forecasting the trend in time series data play an important role in many real applications, ranging from resource allocation in data centers, load schedule in smart grid, and so on. Inspired by the recent successes of neural networks, in this paper we propose TreNet, a novel end-to-end hybrid neural network to learn local and global contextual features for predicting the trend of time series. TreNet leverages convolutional neural networks (CNNs) to extract salient features from local raw data of time series. Meanwhile, considering the long-range dependency existing in the sequence of historical trends of time series, TreNet uses a long-short term memory recurrent neural network (LSTM) to capture such dependency. Then, a feature fusion layer is to learn joint representation for predicting the trend. TreNet demonstrates its effectiveness by outperforming CNN, LSTM, the cascade of CNN and LSTM, Hidden Markov Model based method and various kernel based baselines on real datasets.
- [Atsalakis and Valavanis, 2009] George S Atsalakis and Ki- mon P Valavanis. Forecasting stock market short-term trends using a neuro-fuzzy based methodology. Ex- pert Systems with Applications, 36(7):10696-10707, July 2009.
- [Ballas et al., 2015] Nicolas Ballas, Li Yao, Chris Pal, and Aaron Courville. Delving deeper into convolutional net- works for learning video representations. arXiv preprint arXiv:1511.06432, 2015.
- [Bao et al., 2014] Yukun Bao, Tao Xiong, and Zhongyi Hu. Multi-step-ahead time series prediction using multiple- output support vector regression. Neurocomputing, 129:482-493, 2014.
- [Bashivan et al., 2015] Pouya Bashivan, Irina Rish, Mo- hammed Yeasin, and Noel Codella. Learning represen- tations from eeg with deep recurrent-convolutional neural networks. arXiv preprint arXiv:1511.06448, 2015.
- [Chang et al., 2012] Li-Chiu Chang, Pin-An Chen, and Fi- John Chang. Reinforced two-step-ahead weight adjust- ment technique for online training of recurrent neural net- works. IEEE transactions on neural networks and learn- ing systems, 23(8):1269-1278, 2012.
- [Chung et al., 2014] Junyoung Chung, Caglar Gulcehre, KyungHyun Cho, and Yoshua Bengio. Empirical evalua- tion of gated recurrent neural networks on sequence mod- eling. arXiv preprint arXiv:1412.3555, 2014.
- [Donahue et al., 2015] Jeffrey Donahue, Lisa Anne Hen- dricks, Sergio Guadarrama, Marcus Rohrbach, Subhashini Venugopalan, Kate Saenko, and Trevor Darrell. Long- term recurrent convolutional networks for visual recogni- tion and description. In IEEE CVPR, pages 2625-2634, 2015.
- [Guo et al., 2016] Tian Guo, Zhao Xu, Xin Yao, Haifeng Chen, Karl Aberer, and Koichi Funaya. Robust online time series prediction with recurrent neural networks. In 2016 IEEE DSAA, pages 816-825. IEEE, 2016.
- [Hammerla et al., 2016] Nils Y Hammerla, Shane Halloran, and Thomas Ploetz. Deep, convolutional, and recurrent models for human activity recognition using wearables. arXiv preprint arXiv:1604.08880, 2016. IJCAI
- [Hochreiter and Schmidhuber, 1997] Sepp Hochreiter and Jürgen Schmidhuber. Long short-term memory. Neural computation, 9(8):1735-1780, 1997.
- [Lipton et al., 2015] Zachary C Lipton, David C Kale, Charles Elkan, and Randall Wetzell. Learning to diag- nose with lstm recurrent neural networks. arXiv preprint arXiv:1511.03677, 2015.
- [Liu et al., 2015] Jiajun Liu, Kun Zhao, Brano Kusy, Ji-rong Wen, and Raja Jurdak. Temporal embedding in convolu- tional neural networks for robust learning of abstract snip- pets. arXiv preprint arXiv:1502.05113, 2015.
- [Malhotra et al., 2015] Pankaj Malhotra, Lovekesh Vig, Gautam Shroff, and Puneet Agarwal. Long short term memory networks for anomaly detection in time series. In European Symposium on Artificial Neural Networks, vol- ume 23, 2015.
- [Mao et al., 2014] Junhua Mao, Wei Xu, Yi Yang, Jiang Wang, Zhiheng Huang, and Alan Yuille. Deep captioning with multimodal recurrent neural networks (m-rnn). arXiv preprint arXiv:1412.6632, 2014.
- [Matsubara et al., 2014] Yasuko Matsubara, Yasushi Saku- rai, and Christos Faloutsos. Autoplait: Automatic mining of co-evolving time sequences. In ACM SIGMOD, pages 193-204. ACM, 2014.
- [Sutskever et al., 2014] Ilya Sutskever, Oriol Vinyals, and Quoc V Le. Sequence to sequence learning with neural networks. In Advances in neural information processing systems, pages 3104-3112, 2014.
- [Taieb and Atiya, 2016] Souhaib Ben Taieb and Amir F Atiya. A bias and variance analysis for multistep-ahead time series forecasting. IEEE transactions on neural net- works and learning systems, 27(1):62-76, 2016.
- [Venkatraman et al., 2015] Arun Venkatraman, Martial Hebert, and J Andrew Bagnell. Improving multi-step prediction of learned time series models. In AAAI, pages 3024-3030, 2015.
- [Vinyals et al., 2015] Oriol Vinyals, Alexander Toshev, Samy Bengio, and Dumitru Erhan. Show and tell: A neu- ral image caption generator. In IEEE CVPR, pages 3156- 3164, 2015.
- [Wang and Oates, 2015] Zhiguang Wang and Tim Oates. En- coding time series as images for visual inspection and clas- sification using tiled convolutional neural networks. In Workshops at AAAI, 2015.
- [Wang et al., 2011] Peng Wang, Haixun Wang, and Wei Wang. Finding semantics in time series. In ACM KDD, pages 385-396. ACM, 2011.
- [Wang et al., 2016a] Jiang Wang, Yi Yang, Junhua Mao, Zhiheng Huang, Chang Huang, and Wei Xu. Cnn-rnn: A unified framework for multi-label image classification. arXiv preprint arXiv:1604.04573, 2016.
- [Wang et al., 2016b] Linlin Wang, Zhu Cao, Yu Xia, and Gerard de Melo. Morphological segmentation with win- dow lstm neural networks. In AAAI, 2016.
- [Yang et al., 2015] Jian Bo Yang, Minh Nhut Nguyen, Phyo Phyo San, Xiao Li Li, and Shonali Krishnaswamy. Deep convolutional neural networks on multichannel time series for human activity recognition. In IJCAI, pages 25- 31, 2015. IJCAI
- [Yuan, 2015] Chao Yuan. Unsupervised machine condition monitoring using segmental hidden markov models. In AAAI, pages 4009-4016. AAAI Press, 2015. IJCAI
- [Zhao and Magoulès, 2012] Hai-xiang Zhao and Frédéric Magoulès. A review on the prediction of building en- ergy consumption. Renewable and Sustainable Energy Re- views, 16(6):3586-3592, 2012.
References were extracted automatically from the PDF and may contain errors.
Full text extracted automatically from the PDF; figures, tables and equations may differ. The PDF is the version of record.
1 Introduction
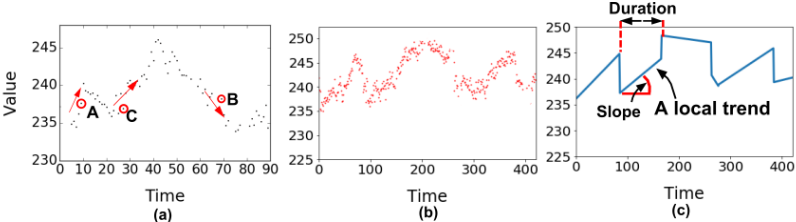
Time series, which is a sequence of data points in time order, is being generated in a wide spectrum of domains, such as medical and biological experimental observations, daily fluctuation of stock markets, power consumption records, performance monitoring of data centres, and so on. In many applications, users are interested in understanding the evolving trend in time series and forecasting the trend, since the conventional prediction on specific data points could deliver very little information about the semantics and dynamics of the underlying process generating the time series. For instance, time series in Figure 1 are from the power consumption dataset 1 . Figure 1(a) shows some raw data points of time series. Though point A and B have approximately the same value, the underlying system is likely to be in two different states when it outputs A and B, because A is in an upward trend while B is in a downward trend [Wang et al., 2011]. On the other hand, even when two points with the similar value are both in the upward trend, e.g, point A and C, the different slopes and durations of the trends where point A and C locate, could also indicate different states of the underlying process.
∗These two authors contributed equally.
1 https://archive.ics.uci.edu/ml/datasets/Individual+household
+electric+power+consumption
Particularly, in this paper we are interested in the trend of time series which measures the intermediate behaviour, i.e. upward or downward pattern of time series. It is characterized by the slope and duration [Wang et al., 2011]. For instance, Figure 1(b) and (c) show one time series and the associated trend evolution over the time series. Given such information, we aim to predict the duration and slope of the subsequent trend. Learning and forecasting trends are quite useful in a wide range of applications. For instance, in the smart energy domain, knowing the predictive trend of power consumption time series enables energy providers to schedule power supply and maximize energy utilization [Zhao and Magoul`es, 2012]. in the stock market, due to its high volatility and noisy environment. In reality predicting stock price trends is preferred over the prediction of the stock market absolute values [Atsalakis and Valavanis, 2009]. Predicting the trend of stock price time series provides the insight into the intermediate behaviours of economic actors [Atsalakis and Valavanis, 2009].
Meanwhile, in recent years neural networks have shown the dramatical power in a wide spectrum of domains, e.g., natural language processing, computer vision, speech recognition, time series analysis, etc [Wang et al., 2016b; Sutskever et al., 2014; Yang et al., 2015; Lipton et al., 2015; Guo et al., 2016]. For time series data, two mainstream architectures, convolutional neural network (CNN) and recurrent neural network (RNN), have been exploited in different tasks, e.g., RNN in time series classification [Lipton et al., 2015] and CNN in activity recognition and snippet learning [Liu et al., 2015; Yang et al., 2015]. RNN is powerful in discovering the dependency in sequence data [Chung et al., 2014] and particularly the Long Short-Term Memory (LSTM) RNN works well on sequence data with long-term dependencies [Chung et al., 2014; Hochreiter and Schmidhuber, 1997] due to the internal memory mechanism. CNN excels in extracting effective representation of local salience from raw data of time series by enforcing a local connectivity between neurons [Yang et al., 2015; Hammerla et al., 2016; Wang and Oates, 2015].
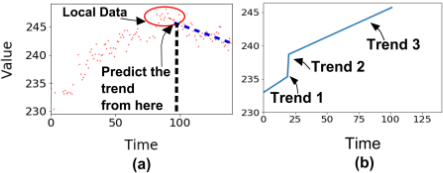
In this paper, we focus on learning and forecasting the trends in time series via neural networks. This involves learning different aspects of the data. On the one hand, the trend variation of time series is a sequence of historical trends carrying the long-term contextual information of time series and naturally affects the evolution of the following trend. On the other hand, the recent raw data points of time series [Wang et al., 2011], which represent the local behaviour of time series, affects the evolving of the following trend as well and have particular predictive power for abruptly changing trends. For instance, in Figure 2(b), trend 1, 2 and 3 present a continuous upward pattern corresponding to the time series before the prediction time instant. Then when we aim at predicting the subsequent trend of time series, the previous three successive upward trends outline a probable increasing trend afterwards. However, the local data points around the end of the third trend as is shown in Figure 2(a), e.g., data points in the red circle, indicate that time series could stabilize and even decrease. The true data after the third trend indeed present a decreasing trend indicated by the blue dotted segment. In this case, the subsequent trend has more dependency on the local data points. Therefore, it is highly desired to develop a systematic way to model such hidden and complementary dependencies in time series.
To this end, we propose an end-to-end hybrid neural network, referred to as TreNet. In particular, it consists of an LSTM recurrent neural network to capture the long dependency in historical trends, a convolutional neural network to extract local features from local raw data of time series, and a feature fusion layer to learn joint representation to take advantage of both features drawn from CNN and LSTM. Such joint representation is used for the trend forecasting. The experimental analysis on real datasets demonstrates that TreNet outperforms CNN, RNN, the cascade of CNN and RNN, and a variety of baselines in term of trend prediction accuracy.
The rest of the paper is organized as follows. Section 2 presents related work. In Section 3, we present the proposed TreNet. Section 4 reports experimental results and the paper is concluded in Section 5.
2 RelatedWork
Traditional learning approaches over trends of time series mainlymake use of HiddenMarkovModels (HMMs) [Wang et al., 2011; Matsubara et al., 2014]. HMMs maintain shortterm state dependences, i.e., the memoryless Markov property and predefined number of states, which requires significant task-specific knowledge. RNNs can capture long-term dependencies in sequence data. Previous time series segmentation approaches [Wang et al., 2011; Yuan, 2015] focus on achieving a meaningful segmentation, rather than modeling the relation in segments and therefore are not suitable for forecasting trends. Multi-step ahead prediction is another way to realize trend prediction by fitting the predicted values to estimate the trend [Chang et al., 2012]. However, multistep ahead prediction of time series is non-trivial [Venkatraman et al., 2015] and suffers from the accumulative prediction errors [Taieb and Atiya, 2016; Bao et al., 2014]. In this paper, we concentrate on directly learning trends through neural networks.
RNNs have recently shown promising results in a variety of applications, especially when there exist sequential dependencies in data [Chung et al., 2014; Sutskever et al., 2014]. Long short-term memory (LSTM) [Hochreiter and Schmidhuber, 1997; Chung et al., 2014], a class of recurrent neural networks with sophisticated recurrent hidden and gated units, are particularly successful and popular due to its ability to learn hidden long-term sequential dependencies. [Lipton et al., 2015] uses LSTMs to recognize patterns in multivariate time series, especially for multi-label classification of diagnoses. [Malhotra et al., 2015] evaluate the ability of LSTMs to detect anomalies in ECG time series.
CNNs are often used to learn effective representation of local salience from raw data [Vinyals et al., 2015; Donahue et al., 2015]. [Hammerla et al., 2016; Yang et al., 2015] make use of CNNs to extract features from raw time series data for activity/action recognition. [Liu et al., 2015] focuses on the prediction of periodical time series values by using CNN and embedding time series with neighbors in the temporal domain. Our proposed TreNet will combine the strengths of both LSTM and CNN and form a novel and unified neural network architecture for trend forecasting.
Hybrid neural networks, which combines the strengths of various neural networks, are receiving increasing interest in the computer vision domain, such as image captioning [Mao et al., 2014; Vinyals et al., 2015; Donahue et al., 2015], image classification [Wang et al., 2016a], action recognition [Ballas et al., 2015; Donahue et al., 2015] and so on. But efficient exploitation of such hybrid architectures has not been well studied for time series data, especially the trend forecasting problem. [Ballas et al., 2015] utilizes CNNs over images in a cascade of RNNs in order to capture the temporal features for classification. [Bashivan et al., 2015] transforms EEG data into a sequence of topology-preserving multi-spectral images and then trains a cascaded convolutional-recurrent network over such images for EEG classification. [Wang et al., 2016a; Mao et al., 2014] propose the CNN-RNN framework to learn a shared representation for image captioning and classification problems.
3 Hybrid neural networks for Learning the Trend
In this section, we provide the formal definition of the trend learning and forecasting problem. Then, we present the proposed TreNet.
3.1 ProblemFormulation
We define time series as a sequence of data points X = {x1, . . . , xT}, where each data point xt is real-valued and subscript t represents the time instant. The historical trend sequence of X is a series of historical trends over X , denoted by T = {〈ℓk, sk〉}. Each element of T , e.g., 〈ℓk, sk〉 describes a linear function over a certain subsequence (or segment) of X and corresponds to a trend in X. ℓk and sk respectively represent the duration and slope of trend k. ℓk is measured in terms of the time range covered by trend k. Both ℓk and sk are continuous values. Trends in T are time ordered and non-overlapping. The durations of all the trends in T address ∑k ℓk = T .
Meanwhile, as we discussed in Section 1, local raw data of time series affects the evolving of trend and thus we define the local data w.r.t. each historical trend in T as a set of data points of size w. Formally, it is denoted by L = {〈xtk-w, . . . , xtk 〉}, where tk is the ending time of trend k in T . w is empirically selected, which will be discussed in Section 4.
Then, we aim to propose a neural network based approach to learn a function f(T ,L) to predict the subsequent trend 〈ˆl, ˆ s〉. In this paper, we focus on univariate time series. The following proposed method can be naturally generalized to multivariate time series as well by augmenting the training data.
3.2 TreNet
In this part, we first present the overview of the proposed hybrid architecture TreNet for the trend forecasting. Then we will detail each component of TreNet.
Overview
The idea of TreNet is to combine CNN and LSTM to utilize their representation abilities on different aspects of data (i.e., L and T ) and to learn a joint feature used for the trend prediction.
Technically, TreNet is designed to learn a predictive function 〈ˆl, ˆ s〉 = f(R(T ),C(L)). R(T ) is derived by training the LSTM over the sequence T to capture the dependency in historical trend evolving, while C(L) corresponds to local features extracted by CNN from sets of local data in L. The long-term and local features respectively captured by LSTM and CNN, i.e., R(T ) and C(L) convey complementary information pertaining to the trend varying. Then, the feature fusion layer merges the features for forecasting the subsequent trend. Finally, the trend prediction is realized by the function f( , ), which corresponds to the feature fusion and output layers as is shown in Figure 3.
Learning the dependency in the historical trend sequence During the training phase the duration ℓk and slope sk of each trend k in sequence T are fed into the LSTM layer of TreNet. Each j-th neuron in the LSTM layer maintains a memory cjk at step k. The output hjk or the activation of this neuron is then expressed as: hjk = ojk tanh(cjk ), where ojk is an output gate of a LSTM neuron [Hochreiter and Schmidhuber, 1997; Chung et al., 2014]. At each step k, the hidden activation hk is the output to the feature fusion layer.
ojk is calculated by
where [ℓk sk] is the concatenation of the duration and slope of the trend k, hk-1 and ck are the vectorization of the activations of {hjk-1 } and {cjk }, and σ is a logistic sigmoid function. Then, the memory cell cjk is updated through partially forgetting the existing memory and adding a new memory content ˜ cjk :
The extent to which the existing memory is forgotten is modulated by a forget gate f j k , and the degree to which the new memory content is added to the memory cell is modulated by an input gate ijk . Then, such gates are computed by
Vf and Vi are diagonal matrices.
Learning local features from raw data of time series When the k-th trend in T is fed to LSTM, the corresponding local raw time series data points 〈xtk-w, . . . , xtk 〉 in L
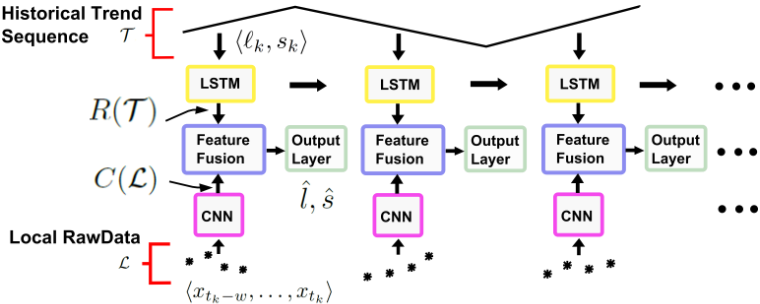
is input to the CNN part of TreNet. CNN consists of H stacked layers of 1-d convolutional, activation and pooling operations. Each layer has a specified number of filters of a specified filter size. Each filter on a layer sweeps through the entire set of data points to exact local features. The output of CNN in TreNet is the concatenation of max-pooling outputs on the last layer H [Donahue et al., 2015].
Feature fusion and output layers
The feature fusion layer combines the output representations from LSTM and CNN, i.e., R(T ) and C(L), to form a joint feature. Then, such a joint feature is fed to the output layer to provide the trend prediction. Particularly, we first map R(T ) and C(L) to the same feature space and then add them together to obtain the activation of the feature fusion layer [Mao et al., 2014]. The output layer is a fully-connect layer following the feature fusion layer. Mathematically, the prediction of TreNet is expressed as:
where φ(·) is element-wise leaky ReLU activation function and + here denotes the element-wise addition. W o and bo are the weights and bias of the output layer.
To train TreNet, we adopt the squared error function plus a regularization term as:
where W and b represent all the weight and bias parameters in TreNet, λ is a hyperparameter for the regularization term. The cost function is differentiable and the architecture of TreNet allows the gradient of loss function (6) to be backpropagated to both LSTM and CNN parts.
4 Experimental Analysis
In this section, we report experimental results to demonstrate the advantage of TreNet by comparing to a variety of baselines.
4.1 Experiment Setup
Dataset:
- Power Consumption (PC). This dataset 2 contains measurements of electric power consumption with a oneminute sampling rate over a period of almost 4 years. We use the voltage time series throughout the experiments.
- Gas Sensor (GasSensor). This dataset 3 contains the recordings of chemical sensors exposed to dynamic gas mixtures at varying concentrations. The measurement was constructed by the continuous acquisition of the sensor array signals for a duration of about 12 hours without interruption. We mainly use the gas mixture time series regarding Ethylene and Methane in air.
- Stock Transaction (Stock): This dataset is extracted from Yahoo Finance and contains the daily stock transaction information in New York Stock Exchange from 1950-10 to 2016-4.
For the ease of result interpretation, the slope of the trends is represented by the angle in a bounded value range [-90, 90]. The duration of trends is measured by the number of data points covered by the trend. Data instances are built by combining historical trend sequence, local raw data and the target trend w.r.t. each time series subsequence. We then do random shuffling over such data instances, where 10% of the data instances is held out as the testing dataset and the rest is used for cross-validation. Totally, there exist 42279 instances in the power consumption dataset, 4418 instances for the gas sensor dataset and 10014 instances for the stock dataset.
Baselines: We compare TreNet with the following six baselines:
- CNN. This baseline method predicts the trend by using CNN over the raw data of time series to learn features used for the trend forecasting.
- LSTM. This method uses LSTM to learn the trend sequence T and then predicts the trend.
2 https://archive.ics.uci.edu/ml/datasets/Individual+household +electric+power+consumption
3 https://archive.ics.uci.edu/ml/datasets/Gas+sensor+ array+under+dynamic+gas+mixtures
- ConvNet+LSTM(CLSTM). It is based on the cascade structure of ConvNet and LSTM proposed in [Bashivan et al., 2015] which feeds the features learnt by ConvNet over time series raw data to an LSTM and obtains the prediction from the LSTM.
- Support Vector Regression (SVR). A family of support vector regression based approaches with different kernel methods are used for the trend forecasting. We consider three commonly used kernels [Liu et al., 2015], i.e., Radial Basis kernel (SVRBF), Polynomial kernel (SVPOLY), Sigmoid kernel (SVSIG). The trend sequence and the corresponding set of local time series data are concatenated as the input features to such SVR approaches.
- Pattern-based Hidden Markov Model (pHMM). [Wang et al., 2011] proposed a pattern-based hidden Markov model (HMM), which segments the time series and models the dependency in segments via HMM. The derived HMMmodel is used to predict the state of time series and then to estimate the trend based on the state.
- Naive. This is the naive approach which takes the duration and slope of the last trend as the prediction for the next one.
Evaluation metric: We evaluate the predictive performance of TreNet and baselines in terms of Root Mean Square Error (RMSE). The lower the RMSE, the more accurate the predictions.
Training: In TreNet, CNN has two stacked convolutional layers, which have 32 filters of size 2 and 4. The number of memory cells in LSTM is 600. In addition to the learning rate, the number of neurons in the feature fusion layer is chosen from the range {300, 600, 900, 1200} to achieve the best performance.
We use dropout and L2 regularization to control the capacity of neural networks to prevent overfitting, and set the values to 0.5 and 5 × 10⁻⁴ respectively for all datasets [Mao et al., 2014]. Regarding the SVR based approaches, we carefully tune the parameters c (error penalty), d (degree of kernel function), and γ (kernel coefficient) for kernels. Each parameter is selected from the sets c ∈ {10-5 , 10-4 , . . . , 1, . . . , 104 , 105 }, d ∈ {1, 2, 3}, γ ∈ {10-5 , 10-4 , . . . , 1, . . . , 105 } respectively.
4.2 Experiment Results
Table 1 studies the prediction performances of TreNet and baselines on different datasets. For the approaches requiring local raw data in the training data (i.e., SVRBF, SVPOLY, SVSIG, and TreNet), the size of local data is chosen by cross validation.
In Table 1, we observe that TreNet consistently outperforms baselines on the duration and slope prediction by achieving around 30% less errors at the maximum. Compared with CNN and LSTM baselines, the results verify that the hybrid architecture of TreNet can improve the performance by utilizing the information captured by both CNN and LSTM. Specifically, pHMM method performs worse due to the limited representation capability of HMM. On the slope prediction, SVR based approaches can get comparable results as TreNet. Meanwhile, the results show that the trend in PC dataset is less predictive compared with that of Stock and GasSensor datasets.
In the following group of experiments, we investigate the effect of local data size (i.e., w) on the prediction performance. In particular, we tune the value of local data size for the approaches whose input data contains local time series data and observe the prediction errors. Such approaches include SVRBF, SVPOLY, SVSIG and TreNet. LSTM only consumes the trend sequence and thus is not included. Baseline Naive has no original time series data as input, while CLSTM works on the whole time series. Thus they are excluded from this set of experiments as well. We report the results on each dataset in Table 2 to Table 7.
| Dataset | Model | Duration | Slope |
|---|---|---|---|
| PC | CNN | 27.51 | 13.56 |
| LSTM | 27.27 | 13.27 | |
| CLSTM | 25.97 | 13.77 | |
| SVRBF | 31.81 | 12.94 | |
| SVPOLY | 31.81 | 12.93 | |
| SVSIG | 31.80 | 12.93 | |
| pHMM | 34.06 | 26.00 | |
| Naive | 39.68 | 21.17 | |
| TreNet | 25.62 | 12.89 | |
| CNN | 18.87 | 12.78 | |
| LSTM | 11.07 | 8.40 | |
| CLSTM | 9.26 | 7.31 | |
| Stock | SVRBF | 11.39 | 7.47 |
| SVPOLY | 11.44 | 7.41 | |
| SVSIG | 11.36 | 7.42 | |
| pHMM | 36.37 | 8.70 | |
| Naive | 11.36 | 8.58 | |
| TreNet | 8.51 | 6.58 | |
| CNN | 53.99 | 11.51 | |
| LSTM | 55.77 | 11.22 | |
| CLSTM | 54.20 | 14.86 | |
| GasSensor | SVRBF | 61.45 | 9.61 |
| SVPOLY | 63.83 | 10.37 | |
| SVSIG | 68.09 | 11.54 | |
| pHMM | 111.62 | 13.07 | |
| Naive | 53.76 | 10.57 | |
| TreNet | 51.25 | 9.46 |
| Window Size | SVRBF | SVPOLY | SVSIG | TreNet |
|---|---|---|---|---|
| 300 | 31.17 | 31.61 | 31.66 | 25.94 |
| 500 | 31.81 | 31.81 | 31.80 | 25.89 |
| 700 | 31.10 | 31.09 | 31.11 | 25.72 |
| 900 | 31.28 | 31.27 | 31.27 | 25.62 |
In Table 2, we observe that compared to baselines TreNet has the lowest errors on the duration prediction across different window sizes. As the window size increases and more local data points are fed to the training process, the prediction errors of TreNet decrease and then stabilize. This is because feature fusion and output layer of TreNet selectively focus on the features having strong predictive power and giving overwhelming local data only gives rise to marginal improvements. Such similar phenomenon is observed in the rest of tables. The observation in above experiments w.r.t. the varying window size provides inspiration for choosing the size of local data instead of expensive cross validation. Given the training dataset, we can find out the maximum duration of local trends and takes it as the local data size. This is because doing so can ensure that the range of local data in each training instance can cover the most recent local trend, whose raw data is believed to have strong predictive power for the subsequent trend.
| Window Size | SVRBF | SVPOLY | SVSIG | TreNet |
|---|---|---|---|---|
| 300 | 12.93 | 12.9346 | 12.9345 | 13.15 |
| 500 | 12.94 | 12.9342 | 12.9346 | 12.89 |
| 700 | 12.93 | 12.9345 | 12.9345 | 12.86 |
| 900 | 12.94 | 12.9350 | 12.9346 | 12.96 |
| Window Size | SVRBF | SVPOLY | SVSIG | TreNet |
|---|---|---|---|---|
| 300 | 11.41 | 11.44 | 11.42 | 8.85 |
| 500 | 11.39 | 11.44 | 11.36 | 8.51 |
| 700 | 11.45 | 11.59 | 11.58 | 8.58 |
| 900 | 11.32 | 11.47 | 11.59 | 8.78 |
| Window Size | SVRBF | SVPOLY | SVSIG | TreNet |
|---|---|---|---|---|
| 300 | 7.42 | 7.51 | 7.38 | 6.53 |
| 500 | 7.47 | 7.41 | 7.42 | 6.58 |
| 700 | 7.53 | 7.58 | 7.51 | 6.75 |
| 900 | 7.61 | 7.45 | 7.59 | 6.73 |
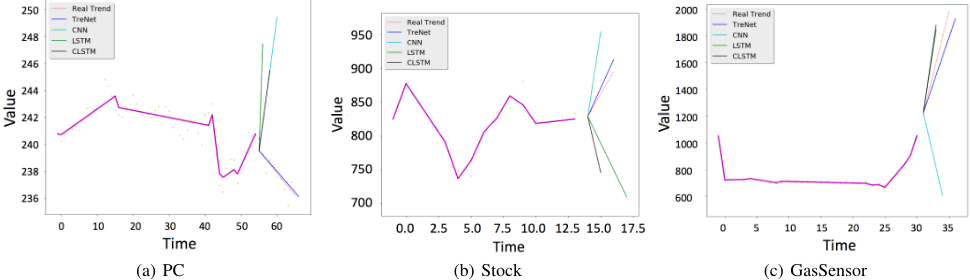
In the next group of experiments in Figure 4, we visualize the trend prediction using sample testing data instances from each dataset. The fusion layer of TreNet selectively uses complementary information from CNN and LSTM and therefore we can observe that in PC TreNet successfully predicts the changed trend, though there are successive upward trends before. However, for the cascade structure of CLSTM it fails to capture the effect of local and abrupt changing data on the trend evolution.
| Window Size | SVRBF | SVPOLY | SVSIG | TreNet |
|---|---|---|---|---|
| 300 | 62.81 | 70.91 | 85.69 | 52.28 |
| 500 | 61.86 | 64.33 | 91.51 | 51.77 |
| 700 | 61.20 | 63.89 | 78.20 | 51.15 |
| 900 | 61.45 | 63.83 | 68.09 | 51.25 |
| Window Size | SVRBF | SVPOLY | SVSIG | TreNet |
|---|---|---|---|---|
| 300 | 10.21 | 10.95 | 11.92 | 9.57 |
| 500 | 10.08 | 10.65 | 11.64 | 9.60 |
| 700 | 9.54 | 10.44 | 11.72 | 9.55 |
| 900 | 9.61 | 10.37 | 11.54 | 9.46 |
5 Conclusion
In this paper we propose TreNet, a novel hybrid neural network over time series and associated trend sequence to predict the trend evolution of time series. The experimental results demonstrate that such a hybrid network can indeed capture complementary information to enhance the prediction performance. Moreover, such architecture is generic and extendible in that additional exogenous time series can be fed to TreNet.
Acknowledgements
This work was partly supported by Nano-Tera.ch through the OpenSense2 project.
@inproceedings{ijcai2017p316,
  title     = {Hybrid Neural Networks for Learning the Trend in Time Series},
  author    = {Lin, Tao and Guo, Tian and Aberer, Karl},
  booktitle = {Proceedings of the Twenty-Sixth International Joint Conference on
               Artificial Intelligence, {IJCAI-17}},
  publisher = {International Joint Conferences on Artificial Intelligence Organization},
  editor    = {Carles Sierra},
  pages     = {2273--2279},
  year      = {2017},
  month     = {8},
  note      = {Main track},
  doi       = {10.24963/ijcai.2017/316},
  url       = {https://doi.org/10.24963/ijcai.2017/316},
}
TY - CPAPER TI - Hybrid Neural Networks for Learning the Trend in Time Series AU - Lin, Tao AU - Guo, Tian AU - Aberer, Karl T2 - Proceedings of the Twenty-Sixth International Joint Conference on Artificial Intelligence, IJCAI-17 PB - International Joint Conferences on Artificial Intelligence Organization PY - 2017 SP - 2273 EP - 2279 DO - 10.24963/ijcai.2017/316 UR - https://doi.org/10.24963/ijcai.2017/316 ER -Copied
Machine-readable versions of this paper, for tools and AI agents:





