
Enhanced-alignment Measure for Binary Foreground Map Evaluation
Proceedings of the Twenty-Seventh International Joint Conference on Artificial Intelligence. Main track. Pages 698-704.
https://doi.org/10.24963/ijcai.2018/97
Keywords
- Computer Vision: Computer Vision
- Computer Vision: 2D and 3D Computer Vision
Abstract
The existing binary foreground map (FM) measures address various types of errors in either pixel-wise or structural ways. These measures consider pixel-level match or image-level information independently, while cognitive vision studies have shown that human vision is highly sensitive to both global information and local details in scenes. In this paper, we take a detailed look at current binary FM evaluation measures and propose a novel and effective E-measure (Enhanced-alignment measure). Our measure combines local pixel values with the image-level mean value in one term, jointly capturing image-level statistics and local pixel matching information. We demonstrate the superiority of our measure over the available measures on 4 popular datasets via 5 meta-measures, including ranking models for applications, demoting generic, random Gaussian noise maps, ground-truth switch, as well as human judgments. We find large improvements in almost all the meta-measures. For instance, in terms of application ranking, we observe improvement ranging from 9.08% to 19.65% compared with other popular measures.
- [Achanta et al., 2009] R. Achanta, S. Hemami, F. Estrada, and S. Süsstrunk. Frequency-tuned salient region detec- tion. In CVPR. IEEE, 2009.
- [Arbelaez et al., 2011] Pablo Arbelaez, Michael Maire, Charless Fowlkes, and Jitendra Malik. Contour detec- tion and hierarchical image segmentation. IEEE TPAMI, 33(5):898-916, 2011.
- [Best and Roberts, 1975] DJ Best and DE Roberts. Algorith- m as 89: the upper tail probabilities of spearman's rho. Journal of the Royal Statistical Society. Series C (Applied Statistics), 24(3):377-379, 1975.
- [Blake et al., 2004] Andrew Blake, Carsten Rother, Matthew Brown, Patrick Perez, and Philip Torr. Interactive image segmentation using an adaptive GMMRF model. In EC- CV, pages 428-441. Springer, 2004.
- [Borji et al., 2015] Ali Borji, Ming-Ming Cheng, Huaizu Jiang, and Jia Li. Salient object detection: A benchmark. IEEE TIP, 24(12):5706-5722, 2015.
- [Chen et al., 2016] Tianshui Chen, Liang Lin, Lingbo Liu, Xiaonan Luo, and Xuelong Li. Disc: Deep image saliency computing via progressive representation learning. IEEE T Neur. Net. Lear., 27(6):1135-1149, 2016.
- [Cheng et al., 2015] Ming-Ming Cheng, Niloy J. Mitra, Xi- aolei Huang, Philip H. S. Torr, and Shi-Min Hu. Glob- al contrast based salient region detection. IEEE TPAMI, 37(3):569-582, 2015.
- [Csurka et al., 2013] Gabriela Csurka, Diane Larlus, Florent Perronnin, and France Meylan. What is a good evalua- tion measure for semantic segmentation? In BMVC, vol- ume 27, page 2013. Citeseer, 2013.
- [Everingham et al., 2010] Mark Everingham, Luc Van Gool, Christopher KI Williams, John Winn, and Andrew Zisser- man. The pascal visual object classes (voc) challenge. I- JCV, 88(2):303-338, 2010.
- [Fan et al., 2017] Deng-Ping Fan, Ming-Ming Cheng, Yun Liu, Tao Li, and Ali Borji. Structure-measure: A new way to evaluate foreground maps. In ICCV, pages 4550-4557. IEEE, 2017.
- [Hou et al., 2018] Qibin Hou, Ming-Ming Cheng, Xiaowei Hu, Ali Borji, Zhuowen Tu, and Philip Torr. Deeply su- pervised salient object detection with short connections. IEEE TPAMI, 2018.
- [Jaccard, 1901] Paul Jaccard. Étude comparative de la distri- bution florale dans une portion des alpes et des jura. Bull Soc Vaudoise Sci Nat, 37:547-579, 1901.
- [Kanan and Cottrell, 2010] Christopher Kanan and Garrison Cottrell. Robust classification of objects, faces, and flow- ers using natural image statistics. In CVPR, pages 2472- 2479. IEEE, 2010.
- [Lee et al., 2016] Gayoung Lee, Yu-Wing Tai, and Junmo Kim. Deep saliency with encoded low level distance map and high level features. In CVPR, pages 660-668. IEEE, 2016.
- [Lew et al., 2000] Michael S. Lew, Nicu Sebe, Chabane D- jeraba, and Ramesh Jain. Content-based multimedia infor- mation retrieval: State of the art and challenges. ACM T Multim. Comput., 2(1):1-19, 2000.
- [Li and Yu, 2015] Guanbin Li and Yizhou Yu. Visual salien- cy based on multiscale deep features. In CVPR, pages 5455-5463. IEEE, 2015.
- [Li and Yu, 2016] Guanbin Li and Yizhou Yu. Deep contrast learning for salient object detection. In CVPR, pages 478- 487. IEEE, 2016.
- [Li et al., 2013] Xiaohui Li, Huchuan Lu, Lihe Zhang, Xi- ang Ruan, and Ming-Hsuan Yang. Saliency detection via dense and sparse reconstruction. In ICCV, pages 2976- 2983. IEEE, 2013.
- [Li et al., 2014] Yin Li, Xiaodi Hou, Christof Koch, James M Rehg, and Alan L Yuille. The secrets of salien- t object segmentation. In CVPR, pages 280-287. IEEE, 2014.
- [Liu and Fan, 2013] Guanghai Liu and Dengping Fan. A model of visual attention for natural image retrieval. In Information Science and Cloud Computing Companion (ISCC-C), pages 728-733. IEEE, 2013.
- [Liu and Han, 2016] Nian Liu and Junwei Han. DHSNet: Deep hierarchical saliency network for salient object de- tection. In CVPR, pages 678-686. IEEE, 2016.
- [Liu et al., 2011] Tie Liu, Zejian Yuan, Jian Sun, Jingdong Wang, Nanning Zheng, Xiaoou Tang, and Heung-Yeung Shum. Learning to detect a salient object. IEEE TPAMI, 33(2):353-367, 2011.
- [Liu et al., 2014] Zhi Liu, Wenbin Zou, and Olivier Le Meur. Saliency tree: A novel saliency detection framework. IEEE TIP, 23(5):1937-1952, 2014.
- [Margolin et al., 2014] Ran Margolin, Lihi Zelnik-Manor, and Ayellet Tal. How to evaluate foreground maps? In CVPR, pages 248-255. IEEE, 2014.
- [Martin et al., 2001] David Martin, Charless Fowlkes, Doron Tal, and Jitendra Malik. A database of human segmented natural images and its application to evaluat- ing segmentation algorithms and measuring ecological statistics. In ICCV, pages 416-423. IEEE, 2001.
- [McGuinness and O'connor, 2010] Kevin McGuinness and Noel E O'connor. A comparative evaluation of interactive segmentation algorithms. Pattern Recognition, 43(2):434- 444, 2010.
- [Movahedi and Elder, 2010] Vida Movahedi and James H Elder. Design and perceptual validation of performance measures for salient object segmentation. In IEEE CVPRW, pages 49-56, 2010.
- [Pont-Tuset and Marques, 2016] Jordi Pont-Tuset and Fer- ran Marques. Supervised evaluation of image segmen- tation and object proposal techniques. IEEE TPAMI, 38(7):1465-1478, 2016.
- [Qin et al., 2014] Chanchan Qin, Guoping Zhang, Yicong Zhou, Wenbing Tao, and Zhiguo Cao. Integration of the saliency-based seed extraction and random walks for im- age segmentation. Neurocomputing, 129:378-391, 2014.
- [Rutishauser et al., 2004] Ueli Rutishauser, Dirk Walther, Christof Koch, and Pietro Perona. Is bottom-up attention useful for object recognition? In CVPR 2004. Proceed- ings of the 2004 IEEE Computer Society Conference on, volume 2, pages II-37. IEEE, 2004.
- [Shi et al., 2015] Ran Shi, King Ngi Ngan, Songnan Li, Raveendran Paramesran, and Hongliang Li. Visual quality evaluation of image object segmentation: Subjective as- sessment and objective measure. IEEE TIP, 24(12):5033- 5045, 2015.
- [Villegas and Marichal, 2004] Paulo Villegas and Xavier Marichal. Perceptually-weighted evaluation criteria for segmentation masks in video sequences. IEEE TIP, 13(8):1092-1103, 2004.
- [Wang et al., 2004] Zhou Wang, Alan C Bovik, Hamid R Sheikh, and Eero P Simoncelli. Image quality assessmen- t: from error visibility to structural similarity. IEEE TIP, 13(4):600-612, 2004.
- [Wang et al., 2016] Linzhao Wang, Lijun Wang, Huchuan Lu, Pingping Zhang, and Xiang Ruan. Saliency detec- tion with recurrent fully convolutional networks. In ECCV, pages 825-841. Springer, 2016.
- [Wang et al., 2017] Jingdong Wang, Huaizu Jiang, Zejian Yuan, Ming-Ming Cheng, Xiaowei Hu, and Nanning Zheng. Salient object detection: A discriminative region- al feature integration approach. IJCV, 123(2):251-268, 2017.
- [Xie et al., 2013] Yulin Xie, Huchuan Lu, and Ming-Hsuan Yang. Bayesian saliency via low and mid level cues. IEEE TIP, 22(5):1689-1698, 2013.
- [Zhao et al., 2015] Rui Zhao, Wanli Ouyang, Hongsheng Li, and Xiaogang Wang. Saliency detection by multi-context deep learning. In CVPR, pages 1265-1274. IEEE, 2015.
References were extracted automatically from the PDF and may contain errors.
Full text extracted automatically from the PDF; figures, tables and equations may differ. The PDF is the version of record.
1 Introduction
Please take a look at Fig. 1. You see the output of a binary foreground segmentation model and a random Gaussian noise map. While it is clear that the foreground map (FM) is much closer to the ground-truth (GT) map, to date the most common measures (e.g. , IOU [Everingham et al., 2010], F1, and JI [Jaccard, 1901]) as well as recently proposed ones including Fbw [Margolin et al., 2014] and VQ [Shi et al., 2015] favor the noise map over the estimated map. This is one of the problems that we will address in this paper (see experiments Sec. 4.3). In order to solve it, we propose a novel measure that does much better than existing ones.
The comparison between a binary foreground estimated map and a human labeled ground-truth binary map is common in various computer vision tasks, such as image retrieval [Liu and Fan, 2013], image segmentation [Qin et al., 2014], object detection, recognition [Kanan and Cottrell, 2010; Rutishauser et al., 2004], foreground extraction [Blake et al., 2004], and salient object detection [Hou et al., 2018; Borji et al., 2015], and is crucial for making statements regarding which models perform better.
∗Bo Ren is the corresponding author.
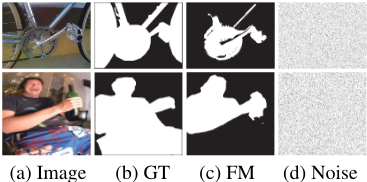
Three widely used measures for comparing the foreground map (FM) and the GT include Fβ measure [Arbelaez et al., 2011], Jaccard Index (JI) measure [Jaccard, 1901], and intersection over union (IOU) [Everingham et al., 2010]. Various evaluations based on Fβ-measures [Csurka et al., 2013; Margolin et al., 2014; Shi et al., 2015] and other measures (e.g. [Movahedi and Elder, 2010; Villegas and Marichal, 2004; McGuinness and O'connor, 2010]) have been reported in the past. All of these evaluations, however, have used measures that address pixel-wise similarities and often discard structural similarities. Recently, Fan et al. [2017] proposed the structure measure (S-measure), which achieves great performance. However, this measure is designed for evaluating non-binary maps and some components (e.g. uniform distribution term) are not well defined for binary map case.
On the contrary, here, we propose a novel measure known as E-measure (Enhanced-alignment measure) which consists of a single term to account for both pixel and image level properties. We show that such an approach leads to an effective and efficient way for evaluating binary foreground maps as demonstrated in Fig. 2. Three foreground maps with colored borders (blue, red, yellow) are evaluated compared to the ground-truth map. Compared to 3 popular measures in- GT
| No. | Measure | Year | Pub | Pros | Cons |
|---|---|---|---|---|---|
| 1 | IOU/F1/JI [Jaccard, 1901] | 1901 | BSVSN | easy to calculate | losing image level statistics |
| 2 | CM [Movahedi and Elder, 2010] | 2010 | CVPRW | considering both region and contour | noise sensitive |
| 3 | Fbw [Margolin et al., 2014] | 2014 | CVPR | assigning different weights for errors | error location sensitive, complicated |
| 4 | VQ [Shi et al., 2015] | 2015 | TIP | weighting errors by psychological function | subjective measure |
| 5 | S-measure [Fan et al., 2017] | 2017 | ICCV | considering structure similarity | focusing on non-binary map properties |
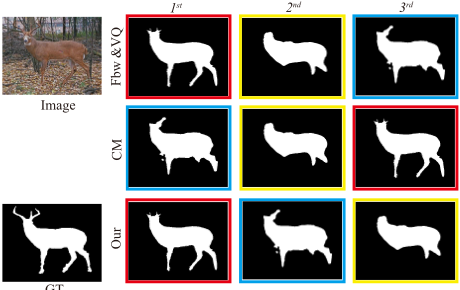
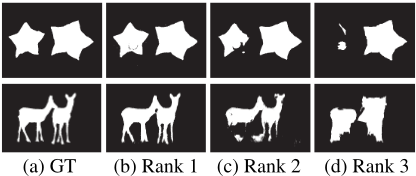
Figure 2: Demonstration of effectiveness of our measure. The ranking of binary foreground maps (after threshold) are generated by 3 state-of-the-art salient object detection models including DCL [Li and Yu, 2016], RFCN [Wang et al., 2016] and DHS [Liu and Han, 2016]. All of the 3 different types of popular measures (CM, Fbw and VQ) fail to rank the maps correctly. However, our measure gives the right order.
cluding Fbw, VQ, and CM, only our measure correctly ranks the three, considering both structural information and global shape coverage. We achieve this by taking into account image-level statistics (mean value of FM) and pixel-level matching jointly. Our measure (will be described in detail in Sec. 3) can correctly rank the estimated segmentation maps. Our main contributions are as follows:
- We propose a simple measure that consists of a compact term that simultaneously captures image level statistics and local pixel matching information. Using 5 metameasures on 4 public datasets, we experimentally show that our measure is significantly better than traditional IOU, F1/JI, CM measures and the recently proposed ones including VQ, Fbw and S-measure.
- To assess the measures, we also propose a new metameasure (SOTA vs. Noise) and build a new dataset. Our dataset contains 555 binary foreground maps which are ranked by humans. We use this dataset to examine the ranking consistency between current measures and human judgments.
2 RelatedWork
A summary of popular evaluation metrics for binary foreground map evaluation can be found in Tab. 1. Here, we explain these measures and discuss their pros and cons.
The Fβ measure [Arbelaez et al., 2011; Cheng et al., 2015; Liu et al., 2011] is a common measure, which simultaneously
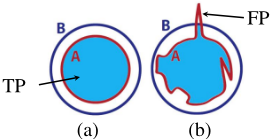
where β is a parameter to trade-off recall and precision, True Positives (TP), True Negatives (TN), False Positives (FP), and False Negatives (FN) are 4 basic quantities. Setting β = 1 leads to the classic F1 measure. Another widely used F1-based measure is the Jaccard Index (JI) [Jaccard, 1901], also known as the IOU measure:
The F1 and IOU measures are related as: JI = F1 2-F1 . Shi et al. [Shi et al., 2015] proposed another measure for subjective object segmentation assessment. Essentially, their measure is also based on the F1 measure. Margolin et al. [2014] proposed a complicated measure called weighted Fβ measure (Fbw):
It assigns different weights to errors in different locations.
All the measures mentioned above are closely related with Fβ. They can be estimated by considering each pixel position independently, and ignore important image level information, which leads to suboptimal performance in identifying noise (Fig. 1), structure errors (Fig. 2), and different shapes (Fig. 3).
Movahedi et al. [2010] proposed the contour mapping (CM) measure. This measure, however, is sensitive to noise (see Fig. 1), which results in poor performance, especially using meta-measure 3 as explained later (Sec. 4.3 & Tab. 2). A recently proposed measure known as S-measure [Fan et al., 2017], focuses on non-binary foreground map (FM) evaluation. It considers the region-level structure similarity on a 2×2 grid over the segmentation map and the object-level properties (e.g. , uniform and contrast). However, these properties are not well defined for binary maps.
3 The ProposedMeasure
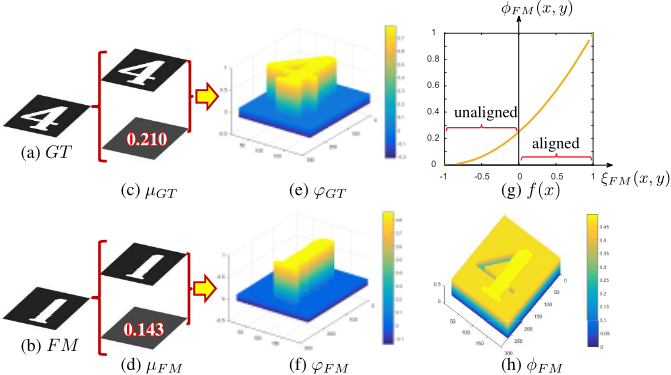
In this section, we explain details of our new measure to evaluate binary foreground maps. An important advantage of our measure is its simplicity as it consists of a compact term that simultaneously captures global statistics and local pixel matching information. As a result, our measure performs better than the current popular measures. Our E-measure framework is demonstrated in Fig. 4.
3.1 Motivation
Despite the previous success of binary map measures, recent measures such as the S-measure are still not performing well enough on binary maps. It is often the case that these measures assign a higher score to a binary generic map than a state-of-the-art (SOTA) estimate segmentation map (see Sec. 4.2). The reason behind this is that in binary maps, S-measure puts emphasis on the luminance comparison, contrast comparison and the dispersion probability. However, while it makes sense to compute these terms for non-binary maps whose values are real numbers ranged in [0, 1] and treat the values as representing the probability that a pixel is owned by the foreground, in binary maps such properties are not well defined and less valid. As a result, using continuous assumptions can lead to erroneous evaluation on binary maps.
Cognitive vision studies have shown that human vision system is highly sensitive to structures (e.g. global information, local details) in scenes. Accordingly, it is important to consider local information and global information simultaneously when evaluating the similarity between an FM and a GT.
Based on the above observation, we design a novel measure that is tailored for binary map evaluation. Our measure works on well-defined properties of binary maps, and combines local pixel values and image-level mean value in one term, which helps to capture image-level statistics and local pixel matching information jointly. Experiments (Sec. 4) show that our measure performs better than other previous measures on binary maps.
3.2 Alignment Term
To design a compact term that simultaneously captures local pixel matching information and global statistics, we define a bias matrix ϕ as the distance between each pixel-wise value of the input binary foreground map I and its global mean µI :
where, A is a matrix in which all the element values are 1 and the size of A is identical to I. We compute two bias matrices ϕGT and ϕFM for the binary ground-truth map GT and binary foreground map FM, respectively. I ∈ {GT, FM}. The bias matrix can be treated as the signal centering by removing the mean intensity from the signal. It can eliminate errors due to intrinsic variations, or large numerical differences.
Our bias matrix has strong relationship to the luminance contrast [Wang et al., 2004]. Consequently, we consider the correlation (Hadamard product) between ϕGT and ϕFM as a simple and effective measure to quantify the bias matrix similarity. Therefore, we define an alignment matrix ξ as following:
where, ◦ donates the Hadamard product. The alignment matrix ξFM has the properties that ξFM(x, y) ⩾ 0 if and only if ϕGT (x, y) and ϕFM(x, y) have the same sign, i.e. the two inputs are aligned at this position (x, y). The value of the alignment matrix element will depend on the global means, taking global statistic into account. These properties make Equ. (5) suitable for our purpose.
3.3 Enhanced Alignment Term
The absolute value of ξFM(x, y) depends on the similarity of µFM and µGT . When two maps are highly similar, further similarity between µFM and µGT may increase positive values at aligned positions and decrease negative values at unaligned positions. When summed together the total value of ξFM(x, y) does not necessarily go up as we expected. Therefore, we need a mapping function that suppresses decrease (which means having smaller derivative value) at negative value (ξFM(x, y) ⩽ 0) regions and strengthens increase at positive value (ξFM(x, y) ⩾ 0) regions.
To achieve this goal, a "convex function" is needed. We have tested other forms of mapping functions such as higherorder polynomials or trigonometric functions, but have found the quadratic form (f(x) = 14 (1+x)2 shown in Fig. 4 (g)) is a simple and effective function and works best in our experiments. Here, we use it to define the enhanced alignment matrix φ as:
3.4 Enhanced Alignment Measure
Using the enhanced alignment matrix φ to capture the two properties (pixel-level matching and image-level statistics) of a binary map, we define our final E-measure as:
where h and w are the height and the width of the map, respectively. Using this measure to evaluate the foreground map (FM) and noise in Fig. 1, we can correctly rank the maps consistent with the application rank (See below).
4 Experiments
In this section, we compare our E-measure with 5 popular measures for binary foreground map evaluation on 4 public salient object detection datasets, as in [Fan et al., 2017].
Meta-Measure. To test the quality of an evaluation measure, we use the meta-measure methodology. The basic idea is defining some desired criteria about the quality of the results and assessing how well a measure satisfies those criteria [Pont-Tuset and Marques, 2016]. We use 4 meta-measures proposed in [Margolin et al., 2014; Pont-Tuset and Marques, 2016; Fan et al., 2017], as well as a new one (Sec. 4.3) introduced here by us. Results are listed in Tab. 2.
Datasets & Models. The employed datasets include PASCAL-S [Li et al., 2014], ECSSD [Xie et al., 2013], HKUIS [Li and Yu, 2015], and SOD [Martin et al., 2001]. We use 10 state-of-the-art (SOTA) salient object detection models including 3 traditional ones (ST [Liu et al., 2014], DRFI [Wang et al., 2017], and DSR [Li et al., 2013]) and 7 deep learning based ones (DCL [Li and Yu, 2016], RFCN [Wang et al., 2016], MC [Zhao et al., 2015], MDF [Li and Yu, 2015], DISC [Chen et al., 2016], DHS [Liu and Han, 2016], and ELD [Lee et al., 2016]) to generate non-binary maps. In order to further obtain foreground binary maps, we use the image-dependent adaptive thresholding method [Achanta et al., 2009] to threshold non-binary maps.
4.1 Meta-Measure 1: Application Ranking
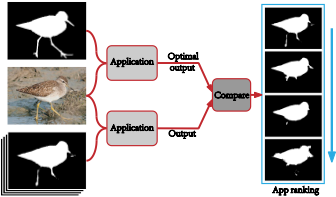
The first meta-measure specifies that the results of an evaluation measure to rank the foreground maps should be consistent with the results of application ranking. Fig. 5 illustrates the application ranking. Assume that the application's output when using GT maps is the optimal output. Then we feed a series of estimated maps to the application and obtain a sequence of outputs which have been ordered from the most similar to the most dissimilar. We compare the output sequence with the optimal output sequence. The more similar a map is to the GT map, the closer its application's output sequence should be to the GT output sequence.
As Margolin et al. [Margolin et al., 2014] claimed, the applications including image retrieval, object detection and segmentation have similar results. For a fair comparison, we use the context-based image retrieval application as Margolin et al. to perform this meta-measure. Implementation of this application is mentioned in the Sec. Application Realization and other applications are implemented similarly.
Here, we use the θ = 1 - ρ [Best and Roberts, 1975] measure to examine the ranking correlation between measure ranking and application ranking. The value of θ falls in the range [0, 2]. Value of 0 means that the orders of measure ranking and application ranking are the same. Completely reverse orders give a value of 2.
In Tab. 2 we observe a significant improvement over the popular evaluation measures. Compared to the best prior measure, our measure improves the performance by 19.65%, 9.08%, 18.42% and 9.64% over PASCAL, ECSSD, SOD and HKU datasets, respectively. Fig. 2 illustrates an example of how well our measure predicts the preference of these applications.
Application Realization. Context-based image retrieval finds the most similar images to a query image in a dataset [Lew et al., 2000]. The similarity is determined by various features such as color-histograms, color and edge directivity descriptor (CEDD). We use LIRE [Lew et al., 2000] with CEDD to weigh the binary foreground maps.
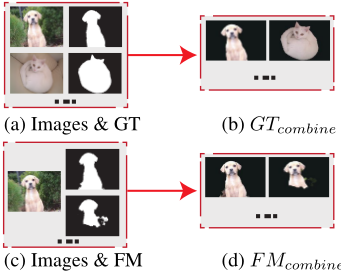
Firstly, in order to ignore the background and get the foreground feature, we generate a combined GT image or FM image by combining the image with its GT map or FM map (see Fig. 6 (a)-(d)). The combined results are denoted by GTcombine = {G1, · · · ,Gn} and FMcombine = {F1, · · · , Fn}. Secondly, for each combined image we use LIRE to retrieve a list of 100 most similar combined images which are ordered from the most similar to the most dissimilar. The GT output, GTouti = {G1-i, · · · ,G100-i}, is the ordered list returned when using the combined GT (e.g. Gi). The ordered score list is GTscorei = {GTs1-i, · · · ,GTs100-i}. The score means the degree of similarity. Likewise, for the FM we obtain Fouti = {F1-i, · · · , F100-i} and Fscorei = {Fs1-i, · · · , Fs100-i}. Thirdly, let Ii = {GTouti∩Fouti}. We find Fk which equals to Gi in the Fouti. If Fk exists, indicating Gi ∈ Fouti, we get the index k as well as the corresponding score Fsk-i. Each score Si of FM assigned:

4.2 Meta-Measure 2: SOTA vs. Generic Maps
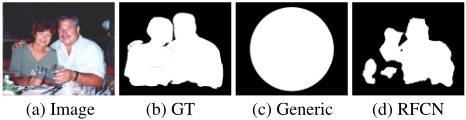
The second meta-measure is that an evaluation measure should assign higher scores to maps obtained by the SOTA models than trivial maps without any meaningful contents. Here, we use a centered circle as the generic map. One example can be seen in Fig. 7. We expect that evaluating FM in (c) would generate a higher score than (d).
We counted the number of times a generic map scored higher than the mean score obtained by 10 SOTA models mentioned in Sec. 4 as mis-ranking rate. As suggested in [Margolin et al., 2014], the mean score is robust to situations in which a certain model generates a poor result. The evaluation score of 10 maps should be higher than a threshold to choose as the "good map". Thus, about 80% good maps in the dataset have been selected to examine this meta-measure. The lower the mis-ranking rate is, the better the measure performs. Our measure outperforms the current measures over ECSSD, SOD and HKU-IS except on the PASCAL-S dataset.
4.3 Meta-Measure 3: SOTA vs. RandomNoise
The property on which we based our third meta-measure is that an evaluation measure should prefer the map generated by a SOTA model over the random noise map on average.
We perform this experiment similar to the meta-measure 2 but this time we use the Gaussian random noise map instead of the generic map in Sec. 4.2. Our measure achieves the best performance since it considers both local pixel-matching and the global statistics jointly. It is to be noted that as stated in Sec. 4.2, the mean score is robust to single failure case of FM from a certain SOTA model. As a result the mean score on foreground maps from the group of SOTA models should always be higher than a score measured from noise map, however, only our measure and the S-measure achieve the lowest mis-ranking rate.
4.4 Meta-Measure 4: Human Ranking
The fourth meta-measure regards examining the ranking correlation between an evaluation measure and the human ranking. To the best of our knowledge, there is no such binary foreground map dataset ranked by human beings before. To create such a dataset, we randomly select the ranked maps by an application in meta-measure 1, from four above mentioned datasets including PASCAL, SOD, ECSSD and HKU. Then, we asked 10 subjects to rank these maps. We keep the maps for which all of the viewers agree in their rankings. We name our dataset FMDatabase 1 which contains 185 images. Each of the images comes with 3 ranked estimated maps (555 maps in total).
To give a quantitative assessment of the correlation between human ranking and measure ranking, we also use the θ measure (mentioned in meta-measure 1) to examine this meta-measure. The lower the score is, the more consistent an evaluation measure is for human ranking. As it can be seen, our measure outperforms other measures. Fig. 2 illustrates an example of how well our measure predicts the preference using human ranking.
4.5 Meta-Measure 5: Ground Truth Switch
The property on which we base the fifth meta-measure is that the score of a "good map" should decrease when we use a wrong GT map. We analyzed 4 popular datasets (PASCAL, SOD, ECSSD, HKU) and found that a map is considered as "good" when it scores (using F1 measure) at least 0.8 out of 1. We followMargolin et al. [Margolin et al., 2014] to calculate this meta-measure. We count the percentage of times that
1 FMDatabase: http://dpfan.net/e-measure/
| PASCAL | ECSSD | SOD | HKU | ||||||||||
|---|---|---|---|---|---|---|---|---|---|---|---|---|---|
| Measure | MM1 | MM2 | MM3 | MM1 | MM2 | MM3 | MM1 | MM2 | MM3 | MM1 | MM2 | MM3 | MM4 |
| CM | 0.610 | 49.78% | 100.0% | 0.504 | 34.62% | 100.0% | 0.723 | 29.89% | 56.22% | 0.613 | 25.26% | 100.0% | 1.492 |
| VQ | 0.339 | 17.97% | 15.32% | 0.294 | 7.445% | 6.162% | 0.335 | 9.143% | 14.05% | 0.331 | 3.067% | 1.800% | 0.161 |
| IOU/F1/JI | 0.307 | 9.426% | 5.597% | 0.272 | 4.097% | 1.921% | 0.342 | 4.571% | 6.857% | 0.303 | 0.900% | 0.197% | 0.124 |
| Fbw | 0.308 | 5.147% | 4.265% | 0.280 | 2.945% | 1.152% | 0.361 | 6.286% | 5.714% | 0.312 | 0.535% | 0.083% | 0.149 |
| S-measure | 0.315 | 2.353% | 0.000% | 0.279 | 1.152% | 0.000% | 0.374 | 1.714% | 0.000% | 0.312 | 0.141% | 0.000% | 0.140 |
| Ours | 0.247 | 3.093% | 0% | 0.247 | 0.641% | 0% | 0.273 | 0.571% | 0% | 0.274 | 0.084% | 0% | 0.121 |

(a) Image



(b) FM (c) GT (d) Switched GT
Figure 9: Meta-measure 5: Ground-truth switch. An evaluation measure should assign the "good" map (b) a higher score when using the right ground-truth (c) as the reference than using the randomly switched ground-truth (d).
an evaluation measure assigns a higher score when using the wrong GT map. We found that all the evaluation measures perform well (The average result on 4 datasets are: VQ with 0.000925%, CM with 0.001675%, IOU/JI/F1 with 0.00515%, S-measure with 0.0014% and ours with 0.0523%). Our measure has a 0.05% gap relative to other measures.
5 Conclusion and FutureWork
In this paper, we analyzed various binary foreground evaluation measures that consider errors in different levels including pixel, region, boundary and object level. They can be classified as considering either pixel-level errors or image-level errors independently. To solve this shortcoming, here we proposed the simple E-measure which simultaneously considers both types of errors. Our measure is highly effective and efficient. Extensive experiments using 5 meta-measures demonstrate the effectiveness of our measure compared to existing measures on 4 popular datasets. Finally, we created a new dataset (740 maps) which consists of 185 ground-truth maps and 555 human ranked maps to examine the correlation between evaluation measures and human judgments.
Limitation. Compared to our metric, S-measure is mainly designed for tackling structural similarity. Images in PASCAL dataset have more structural objects than the other 3 datasets (ECSSD, SOD, HKU-IS). Therefore, S-measure is slightly better than our metric in PASCAL dataset. One failure case can be found in Fig. 10.
Future Work. We will investigate the potential to propose a new segmentation model based on the E-measure in our future work. Besides, our metric consists of simple derivable functions, so a new loss function based on the E-measure can be developed. To help future explorations in this area, our code and dataset will be made publicly available on the web.
Acknowledgments
This research was supported by NSFC (NO. 61620106008, 61572264), Huawei Innovation Research Program, and Fundamental Research Funds for the Central Universities.
@inproceedings{ijcai2018p97,
  title     = {Enhanced-alignment Measure for Binary Foreground Map Evaluation},
  author    = {Fan, Deng-Ping and Gong, Cheng and Cao, Yang and Ren, Bo and Cheng, Ming-Ming and Borji, Ali},
  booktitle = {Proceedings of the Twenty-Seventh International Joint Conference on
               Artificial Intelligence, {IJCAI-18}},
  publisher = {International Joint Conferences on Artificial Intelligence Organization},
  editor    = {Jérôme Lang},
  pages     = {698--704},
  year      = {2018},
  month     = {7},
  note      = {Main track},
  doi       = {10.24963/ijcai.2018/97},
  url       = {https://doi.org/10.24963/ijcai.2018/97},
}
TY - CPAPER TI - Enhanced-alignment Measure for Binary Foreground Map Evaluation AU - Fan, Deng-Ping AU - Gong, Cheng AU - Cao, Yang AU - Ren, Bo AU - Cheng, Ming-Ming AU - Borji, Ali T2 - Proceedings of the Twenty-Seventh International Joint Conference on Artificial Intelligence, IJCAI-18 PB - International Joint Conferences on Artificial Intelligence Organization PY - 2018 SP - 698 EP - 704 DO - 10.24963/ijcai.2018/97 UR - https://doi.org/10.24963/ijcai.2018/97 ER -Copied
Machine-readable versions of this paper, for tools and AI agents:





