
DeepFlow: Detecting Optimal User Experience From Physiological Data Using Deep Neural Networks
Proceedings of the Twenty-Eighth International Joint Conference on Artificial Intelligence. Main track. Pages 1415-1421.
https://doi.org/10.24963/ijcai.2019/196
Keywords
- Machine Learning Applications: Applications of Supervised Learning
- Humans and AI: Human-Computer Interaction
Abstract
Flow is an affective state of optimal experience, total immersion and high productivity. While often associated with (professional) sports, it is a valuable information in several scenarios ranging from work environments to user experience evaluations, and we expect it to be a potential reward signal for human-in-the-loop reinforcement learning systems. Traditionally, flow has been assessed through questionnaires which prevents its use in online, real-time environments. In this work, we present our findings towards estimating a user's flow state based on physiological signals measured using wearable devices. We conducted a study with participants playing the game Tetris in varying difficulty levels, leading to boredom, stress, and flow. Using an end-to-end deep learning architecture, we achieve an accuracy of 67.50% in recognizing high flow vs. low flow states and 49.23% in distinguishing all three affective states boredom, flow, and stress.
- [Anders et al., 2004] Silke Anders, Martin Lotze, Michael Erb, Wolfgang Grodd, and Niels Birbaumer. Brain activ- ity underlying emotional valence and arousal: A response- related fmri study. Human brain mapping, 23(4):200-209, 2004.
- [Appelhans and Luecken, 2006] Bradley M Appelhans and Linda J Luecken. Heart rate variability as an index of regu- lated emotional responding. Review of general psychology, 10(3):229, 2006.
- [Bai et al., 2018] Shaojie Bai, J Zico Kolter, and Vladlen Koltun. An empirical evaluation of generic convolutional and recurrent networks for sequence modeling. arXiv preprint arXiv:1803.01271, 2018.
- [Ballinger et al., 2018] Brandon Ballinger, Johnson Hsieh, Avesh Singh, Nimit Sohoni, Jack Wang, Geoffrey H Tison, Gregory M Marcus, Jose M Sanchez, Carol Maguire, Jef- frey E Olgin, et al. Deepheart: Semi-supervised sequence learning for cardiovascular risk prediction. arXiv preprint arXiv:1802.02511, 2018.
- [Baveye et al., 2015] Yoann Baveye, Emmanuel Dellandrea, Christel Chamaret, and Liming Chen. Liris-accede: A video database for affective content analysis. IEEE Trans- actions on Affective Computing, 6(1):43-55, 2015.
- [Cambria, 2016] Erik Cambria. Affective computing and sentiment analysis. IEEE Intelligent Systems, 31(2):102- 107, 2016.
- [Chanel et al., 2008] Guillaume Chanel, Cyril Rebetez, Mireille Bétrancourt, and Thierry Pun. Boredom, engage- ment and anxiety as indicators for adaptation to difficulty in games. In Proceedings of the 12th international con- ference on Entertainment and media in the ubiquitous era, pages 13-17, 2008.
- [Chanel et al., 2011] Guillaume Chanel, Cyril Rebetez, Mireille Bétrancourt, and Thierry Pun. Emotion assess- ment from physiological signals for adaptation of game difficulty. IEEE Transactions on Systems, Man, and Cybernetics-Part A: Systems and Humans, 41(6):1052- 1063, 2011.
- [Christiano et al., 2017] Paul Christiano, Jan Leike, Tom Brown, Miljan Martic, Shane Legg, and Dario Amodei. Deep reinforcement learning from human preferences. In Advances in Neural Information Processing Systems, pages 4299-4307, 2017.
- [Csikszentmihalyi and Csikszentmihalyi, 1975] Mihaly Csikszentmihalyi and Isabella Csikszentmihalyi. Beyond boredom and anxiety: Experiencing Flow in Work and Play, volume 721. Jossey-Bass San Francisco, 1975.
- [Csikszentmihalyi, 1990] M Csikszentmihalyi. Flow. The Psychology of Optimal Experience. New York (Harper- Perennial), 1990.
- [Harmat et al., 2015] László Harmat, Örjan de Manzano, Töres Theorell, Lennart Högman, Håkan Fischer, and Fredrik Ullén. Physiological correlates of the flow experi- ence during computer game playing. International Journal of Psychophysiology, 97(1):1-7, 2015.
- [IJsselsteijn et al., 2013] WA IJsselsteijn, YAW De Kort, and Karolien Poels. The game experience questionnaire. Eind- hoven: Technische Universiteit Eindhoven, 2013.
- [Inc., 2018] Empatica Inc. Real-time physiological signals -e4 eda/gsr sensor. https://www.empatica.com/research/ e4/, 2018. Accessed: 2018-09-03. Link
- [Jackson and Marsh, 1996] Susan A Jackson and Herbert W Marsh. Development and validation of a scale to measure optimal experience: The flow state scale. Journal of sport and exercise psychology, 18(1):17-35, 1996.
- [Jaques et al., 2018] Natasha Jaques, Jesse Engel, David Ha, Fred Bertsch, Rosalind W. Picard, and Douglas Eck. Learning via social awareness: improving sketch repre- sentations with facial feedback. CoRR, abs/1802.04877, 2018.
- [Keller et al., 2011] Johannes Keller, Herbert Bless, Frederik Blomann, and Dieter Kleinböhl. Physiological aspects of flow experiences: Skills-demand-compatibility effects on heart rate variability and salivary cortisol. Journal of Ex- perimental Social Psychology, 47(4):849-852, 2011.
- [Koskimäki et al., 2017] Heli Koskimäki, Henna Mönttinen, Pekka Siirtola, Hanna-Leena Huttunen, Raija Halonen, and Juha Röning. Early detection of migraine attacks based on wearable sensors: experiences of data collection using empatica e4. In Proceedings of the 2017 ACM In- ternational Joint Conference on Pervasive and Ubiquitous Computing, pages 506-511. ACM, 2017.
- [Kurniawan et al., 2013] Hindra Kurniawan, Alexandr Maslov, and Mykola Pechenizkiy. Stress detection from speech and galvanic skin response signals. In Proceed- ings of the 2013 IEEE 26th International Symposium on Computer-Based Medical Systems (CBMS), pages 209-214. IEEE, 2013.
- [Lane et al., 2009] Richard Lane, Kateri McRae, Eric Reiman, Kewei Chen, Geoffrey Ahern, and Julian Thayer. Neural correlates of heart rate variability during emotion. Neuroimage, 44(1):213-222, 2009.
- [Lang et al., 1993] Peter Lang, Mark Greenwald, Margaret Bradley, and Alfons Hamm. Looking at pictures: Af- fective, facial, visceral, and behavioral reactions. Psy- chophysiology, 30(3):261-273, 1993.
- [Lisetti, 1998] CL Lisetti. Affective computing, 1998.
- [Maier et al., 2019] Marco Maier, Chadly Marouane, and Daniel Elsner. Deepflow: Detecting optimal user expe- rience from physiological data using deep neural networks -extended abstract. In Proceedings of the International Conference on Autonomous Agents and Multiagent Sys- tems (AAMAS 2019), pages 2108-2110, May 2019. Mon- treal, Canada.
- [Makowski, 2016] Dominique Makowski. Neurokit: A python toolbox for statistics and neurophysiological signal processing (eeg, eda, ecg, emg...). Memory and Cognition Lab' Day, 01 November, Paris, France, 2016.
- [McCarthy et al., 2016] Cameron McCarthy, Nikhilesh Pradhan, Calum Redpath, and Andy Adler. Validation of the empatica e4 wristband. In Proceedings of the 2016 IEEE EMBS International Student Conference (ISC), pages 1-4. IEEE, 2016.
- [Mollahosseini et al., 2016] Ali Mollahosseini, Behzad Hasani, Michelle Salvador, Hojjat Abdollahi, David Chan, and Mohammad Mahoor. Facial expression recognition from world wild web. In IEEE Conference on Computer Vision and Pattern Recognition, pages 58-65, 2016.
- [Mollahosseini et al., 2017] Ali Mollahosseini, Behzad Hasani, and Mohammad Mahoor. Affectnet: A database for facial expression, valence, and arousal computing in the wild. arXiv preprint arXiv:1708.03985, 2017.
- [Nacke and Lindley, 2008a] Lennart Nacke and Craig A Lindley. Flow and immersion in first-person shooters: measuring the player's gameplay experience. In Proceed- ings of the 2008 Conference on Future Play: Research, Play, Share, pages 81-88. ACM, 2008.
- [Nacke and Lindley, 2008b] Lennart Nacke and Craig A Lindley. Flow and immersion in first-person shooters: measuring the player's gameplay experience. In Proceed- ings of the 2008 Conference on Future Play: Research, Play, Share, pages 81-88. ACM, 2008.
- [Ollander et al., 2016] Simon Ollander, Christelle Godin, Aurélie Campagne, and Sylvie Charbonnier. A compar- ison of wearable and stationary sensors for stress detec- tion. In Proceedings of the 2016 IEEE International Con- ference on Systems, Man, and Cybernetics (SMC), pages 4362-4366. IEEE, 2016.
- [Paletta et al., 2015] L Paletta, NM Pittino, M Schwarz, V Wagner, and KW Kallus. Human factors analysis using wearable sensors in the context of cognitive and emotional arousal. Procedia Manufacturing, 3:3782-3787, 2015.
- [Picard, 1999] Rosalind W Picard. Affective computing for hci. In HCI (1), pages 829-833. Citeseer, 1999.
- [Picard, 2003] Rosalind W Picard. Affective computing: challenges. International Journal of Human-Computer Studies, 59(1-2):55-64, 2003.
- [Ragot et al., 2017] Martin Ragot, Nicolas Martin, Sonia Em, Nico Pallamin, and Jean-Marc Diverrez. Emotion recognition using physiological signals: laboratory vs. wearable sensors. In Proceedings of the International Conference on Applied Human Factors and Ergonomics, pages 15-22, 2017.
- [Rissler et al., 2018] Raphael Rissler, Mario Nadj, Maximil- ian Xiling Li, Michael Thomas Knierim, and Alexander Maedche. Got flow?: Using machine learning on physio- logical data to classify flow. In Extended Abstracts of the 2018 CHI Conference on Human Factors in Computing Systems, page LBW612. ACM, 2018.
- [Shaffer and Ginsberg, 2017] Fred Shaffer and JP Ginsberg. An overview of heart rate variability metrics and norms. Frontiers in public health, 5:258, 2017.
- [Valenza et al., 2014a] Gaetano Valenza, Luca Citi, Antonio Lanatá, Enzo Pasquale Scilingo, and Riccardo Barbieri. Revealing real-time emotional responses: a personalized assessment based on heartbeat dynamics. Scientific re- ports, 4:4998, 2014.
- [Valenza et al., 2014b] Gaetano Valenza, Mimma Nardelli, Antonio Lanata, Claudio Gentili, Gilles Bertschy, Rita Paradiso, and Enzo Pasquale Scilingo. Wearable moni- toring for mood recognition in bipolar disorder based on history-dependent long-term heart rate variability analy- sis. IEEE Journal of Biomedical and Health Informatics, 18(5):1625-1635, 2014.
- [Valenza et al., 2015] Gaetano Valenza, Luca Citi, Claudio Gentili, Antonio Lanata, Enzo Scilingo, and Riccardo Bar- bieri. Characterization of depressive states in bipolar pa- tients using wearable textile technology and instantaneous heart rate variability assessment. IEEE journal of biomed- ical and health informatics, 19(1):263-274, 2015.
- [Wang and Ji, 2015] Shangfei Wang and Qiang Ji. Video affective content analysis: a survey of state of the art methods. IEEE Transactions on Affective Computing, 6(4):410-430, May 2015.
- [Wikipedia, 2018] Wikipedia. Tetris. https://en.wikipedia. org/wiki/Tetris, 2018. Accessed: 2018-09-03. Link
- [Xu et al., 2005] Min Xu, L-T Chia, and Jesse Jin. Affec- tive content analysis in comedy and horror videos by au- dio emotional event detection. In 2005 IEEE International Conference on Multimedia and Expo (ICME), pages 4-pp. IEEE, 2005.
- [Yates et al., 2017] Heath Yates, Brent Chamberlain, Greg Norman, and William H Hsu. Arousal detection for bio- metric data in built environments using machine learning. In IJCAI 2017 Workshop on Artificial Intelligence in Af- fective Computing, pages 58-72, 2017.
- [Zhai and Barreto, 2006] Jing Zhai and Armando Barreto. Stress detection in computer users based on digital sig- nal processing of noninvasive physiological variables. In Proceedings of the 2006 IEEE 28th Annual International Conference on Engineering in Medicine and Biology Soci- ety (EMBS), pages 1355-1358. IEEE, 2006.
References were extracted automatically from the PDF and may contain errors.
Full text extracted automatically from the PDF; figures, tables and equations may differ. The PDF is the version of record.
1 Introduction
The research field Affective Computing is dealing with recognizing, processing, interpreting, and simulating human affects and emotions [Picard, 2003; Lisetti, 1998; Picard, 1999]. With regard to the goal of recognizing emotions, typical approaches rely on various types of sensor data which can be analyzed to infer information about the subject's affective state. Typical inputs for such analyses are images [Mollahosseini et al., 2016; Mollahosseini et al., 2017], videos [Baveye et al., 2015; Wang and Ji, 2015], audio data [Xu et al., 2005], text [Cambria, 2016] and physiological signals such as heart rate (HR) or electrodermal activity (EDA) [Zhai and Barreto, 2006; Kurniawan et al., 2013; Nacke and Lindley, 2008a].
Apart from basic emotions such as being happy or sad, other psychological models such as the flow theory [Csikszentmihalyi, 1990] can be a valuable construct to assess a user's affective state and often tend to be more directly actionable compared to generic emotional states. The state of flow is characterized by optimal experience, total immersion and high productivity, making it a valuable piece of information when assessing user experiences, from user interfaces to games to whole environments. Flow is usually formed when the challenge an individual is facing matches his or her skill level [Csikszentmihalyi and Csikszentmihalyi, 1975]. If the challenge is too easy compared to the individual's capabilities, the individual can get bored (and consequently unfocused). If the challenge is too difficult, however, the individual is overwhelmed and can get stressed. This is potentially leading to a burn-out of the individual if the situation persists over a longer time span. The sweet spot lies in between, when the subject feels being in control of the situation, can totally immerse in the task, and challenge and skill level are balanced.
∗Both authors contributed equally
Traditionally, whether a subject experiences flow or not is assessed through questionnaires [Jackson and Marsh, 1996; IJsselsteijn et al., 2013]. Although extensive research has been conducted on how to assess flow using scales, it has the disadvantage of being only applicable after the actual occurrence of flow and requires manual effort from the subject. In contrast, automatic flow recognition based on sensor data would overcome this limitation and would be applicable unobtrusively and in real-time.
Extant research in psychology has examined physiological aspects of flow experiences [Keller et al., 2011; Harmat et al., 2015]. One set of suitable data inputs is comprised of various kinds of physiological data, e.g., HR or EDA. However, the approaches and methods in these cases are based on manual examination of the physiological measurements by experts and typically use expensive, stationary equipment for sensing. The question arises whether the interpretation of physiological signals with regard to the flow theory can be automatized, especially when using more real-life-suitable devices such as wrist-worn devices. Real-time, automatic flow measurement could then - among other fields of application - be applied in human-in-the-loop reinforcement learning (RL) systems, by enabling socially interactive agents to incorporate affective states as reward signals. Preliminary results of our suggested approach have been published in an extended abstract [Maier et al., 2019]. This work contains major improvements with regard to the study setup, the dataset size, pre-processing, and contains a significantly more rigorous evaluation and comparison to related methods.
Contributions We propose amethod to automaticallymeasure flow using physiological signals from wrist-worn devices. The method is based on a convolutional neural network (CNN) architecture. To the best of our knowledge, this is the first attempt to apply end-to-end deep learning for flow classification. The performance of the developed model is crossevaluated and compared to existing methods for flow classification. Our DeepFlow model does not only allow for recognizing high vs. low flow, but also allows to estimate whether the user is under- or overchallenged (i.e., bored or stressed) when not experiencing flow. Furthermore, DeepFlow is able to learn both tasks and we find that the importance of BVPand EDA-based information is different for each of the two tasks.
2 Physiological Signals and RelatedWork
Physiological signals are widely used to recognize medical conditions, but also to infer psychological states, human affective states in particular. Previous work, both from the field of psychology as well as from computer science, has used physiological signals to make inferences regarding human emotions [Anders et al., 2004; Appelhans and Luecken, 2006; Lane et al., 2009; Valenza et al., 2014a] and especially to determine people's stress levels [Zhai and Barreto, 2006; Kurniawan et al., 2013; Paletta et al., 2015].
Machine learning has also been applied on Electrocardiography (ECG) data to classify high and low flow [Rissler et al., 2018]. Handcrafted features from brain waves measured by Electroencephalography (EEG) fused with signals from the peripheral nervous system (e.g., heart rate (HR), Galvanic Skin Response (GSR), and ElectroMyogram (EMG)) have further been used to classify affective states in gaming [Chanel et al., 2008; Chanel et al., 2011].
These approaches are still limited to laboratory settings or at least require rather obtrusive measuring devices with high sampling rates. However, several physiological signals can now also be measured with (consumer) wearable devices. Since such wearable devices are central to our approach, the most relevant physiological signals are HR, i.e., the number of heartbeats per minute, heart rate variability (HRV), i.e., the variations of inter-beat intervals, and electrodermal activity (EDA), i.e., the skin conductance influenced by producing sweat. Wearable devices measuring the aforementioned signals have been successfully used to assess various medical conditions such as depressive states of bipolar patients [Valenza et al., 2014b; Valenza et al., 2015] or cardiovascular risks [Ballinger et al., 2018]. Consequently, it is promising to use them also for real-time flow detection.
3 Study Setup
To collect data, we created a custom version of the game Tetris [Wikipedia, 2018] as a mobile application. Tetris has already been used in similar studies and it has been found that depending on the difficulty of the game, users experience flow [Keller et al., 2011; Harmat et al., 2015; Chanel et al., 2008; Chanel et al., 2011]. Similar findings have been obtained using other games, e.g., first-person shooters [Nacke and Lindley, 2008b].
| Time [s] | Easy Level | Medium Level | Hard Level |
| Group A | 0.53 | 0.20 | 0.10 |
|---|---|---|---|
| Group B | 0.46 | 0.14 | 0.03 |
The original game logic and setup were modified in the following ways:
- At the beginning of a session, there is a countdown for 120 seconds, allowing the participants to calm down and focus on the game. This time period allows to establish a baseline for the physiological signals.
- There are only three levels of game difficulty: easy, normal, and hard, which differ by the speed of the tetriminos (i.e., the game pieces) falling down. To better match game difficulty with the participants' skill levels, participants were assigned to one of two groups: one for more experienced, one for less experienced players. The exact speed of the tetriminos is depicted in table 1.
- Each level occurs exactly once, i.e., one session contains all three levels.
- Each level lasts exactly 10 minutes, regardless of the performance of the player.
- The order of the three levels is randomized at the beginning of a session.
- When the level changes, all rows are deleted, i.e., the player starts with a cleared Tetris environment.
- In case the stack reaches the top (which would end the game in the original version), the 6 bottom-most rows are deleted and the game continues.
- Letting the current tetromino fall down quickly (e.g., by swiping downwards) is not available, i.e., players have to wait for each tetromino to reach the bottom at its current speed.
The speed of the easy level was set to be very low. In combination with the missing feature to quickly let a tetromino fall down at will, this was intended to lead to boredom for the players. The normal level was chosen to allow for smooth playing, i.e., paced quickly enough to not lead to boredom, but still manageable so that the player is in control of the game, which was intended to induce flow. The speed of the hard level was set to be very high. In this level, typical players are only able to somehow put the tetriminos in a suitable horizontal position, but they are not able anymore to rotate the tetriminos and put them in place efficiently (i.e., spacesaving). This level was intended to induce stress.
Participants were equipped with an Empatica E4 wristworn device [Inc., 2018] which can accurately capture physiological signals such as HR, HRV (based on blood volume pulse (BVP)) as well as EDA and skin temperature [Ollander et al., 2016; McCarthy et al., 2016]. The E4 has been widely used in comparable studies [Yates et al., 2017; Koskim¨aki et al., 2017; Ragot et al., 2017]. The participants were asked to wear the E4 on their non-dominant hand, the smartphone (iPhone 5s) with the Tetris application was held in the other (dominant) hand.
The data for training and evaluating the models was collected as follows. The experiment was conducted at experimenTUM, a research laboratory for experimental economic research at the Technical University of Munich, with 72 participants (27 female, 45 male) aged between 18 and 32 (M=23 years). In total, we gathered 72 sessions, summing up to 36 hours of gameplay data. Two sessions had to be discarded because of missing data. First, participants were asked to play a warm-up round. Based on the results of this round, they were either assigned to the group of more experienced players (Group B, 37 participants) or to the one of less experienced players (Group A, 33 participants). After each level, participants' subjective flow experience was assessed through the Game Experience Questionnaire (GEQ), which had been developed to measure flow in gaming contexts [IJsselsteijn
et al., 2013]. The average duration of the sessions was 45.3 minutes, which included baseline measurement, playing all three game levels, and filling out the questionnaire.
4 Data and Preprocessing
Since the works of Rissler et al. and Chanel et al. [Rissler et al., 2018; Chanel et al., 2011] are the most recent and similar approaches compared to our method, we regard them as the most suitable benchmarks for our work. Consequently, we implemented their methods as accurately as possible (performing grid search for hyperparameters not described in their work) and applied it in our setting.
The collected data streams from the E4 comprise BVP, EDA, skin temperature, and the so-called RR intervals, i.e., the time difference between consecutive heartbeats, from which various HRV measures are derived. EDA and skin temperature are sampled at 4 Hz while the BVP values are sampled at 64 Hz. RR intervals are not provided at regular intervals but when they occur. To calculate frequency-based HRV features from the RR intervals, we used the open-source Python library NeuroKit [Makowski, 2016], similar to Rissler et al..
For our approach, in each session the EDA and BVP streams of physiological data were resampled to an equidistant time series at 4Hz and standardized with regard to the whole session (i.e., centered on the mean with unit variance).
4.1 Dataset creation
In order to create the actual training and validation sets, the sessions were further pre-processed for Chanel et al.'s, Rissler et al.'s, and our approach respectively in the following manner:
Chanel et al.
Chanel et al. classify the three affective states boredom (negative-calm), engagement (positive-excited) and anxiety (negative-excited) from physiological data sampled at 256Hz. Accordingly, these three states correspond to their three Tetris difficulty levels, which Chanel et al. capture by administering a (non-standardized) questionnaire of 30 questions related to emotions and level of involvement in the game [Chanel et al., 2011]. They achieve an accuracy of 59% (excluding EEG
1 2 3 4 5 6 7 8 9 10 … data) on selected features from the peripheral signals GSR, BVP, respiration rate, and skin temperature. As the E4 lacks a sensor for measuring the respiration rate, we omit the respective features in our analyses. By testing multiple feature combinations of the proposed features, we find that three of the most relevant identified features by Chanel et al., f DecTime GSR (proportion of negative samples in the derivative vs. all samples), f NbPeaks GSR (number of resistance falls in the signal), and µHR (mean of the heart rate) are also the most relevant features for our data. As the game level duration is 5 minutes in their experiment, we tried both, computing the features on 5 and 10 minute time periods (i.e., our level duration) and achieved better results by using only the first 5 minutes for feature engineering. While their best classifier is a Quadratic Discriminant Analysis (QDA) with 59% accuracy, we obtain the best results by using a Random Forest classifier (see table 2).
Rissler et al.
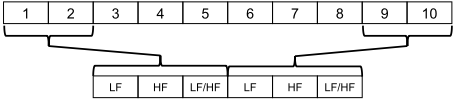
Rissler et al. asked participants to perform a sorting task for five minutes at a time while being connected to an ECG device. After each round, the participants self-reported their flow experience through an established 36-item flow questionnaire [Jackson and Marsh, 1996]. For each of these fiveminute-rounds, Rissler et al. extracted the first and the fifth minute of ECG data and computed the HRV features LF, HF and the ratio LF/HF. This resulted in one sample in the dataset being comprised of 6 features and being mapped to the resulting flow value from the questionnaire. The dataset being feature-engineered in this manner then was fed into a Random Forest model. They achieved an accuracy of 72.30% on their data without cross validation. We adapt this approach to our scenario with one modification: We extract windows of 2 minutes length, since literature on HRV suggests to use at least this size for computing frequency-based HRV features [Shaffer and Ginsberg, 2017]. Consequently, we extract an interval comprising the first two minutes and - since the levels in our setting have a duration of 10 minutes - the interval comprising minutes 9 and 10 of each level, and compute the HRV features as above, again resulting in data points comprised of 6 features each. Whereas in the original work of Rissler et al., each participant completed several basically identical rounds of doing the task, in our case, each participant produced exactly three datapoints, one for each game level of her session. Figure 1 depicts the dataset creation process for this approach.
DeepFlow
In contrast to the existing approaches, our approach uses an end-to-end deep learning architecture. There are two main differences in how we created the dataset: First, we extract 2-minutes-windows, but do so in a sliding window manner LF HF LF/HF LF HF LF/HF

Figure 2: Dataset creation for our approach.
with step size 1 sample (see figure 2). Consequently, we do not obtain one data point per session per game level but (102) · 60 · 4 = 1920 extracted, overlapping windows per session per game level. Second, we use the raw BVP and/or EDA data and do not pre-compute any features. This is left for the network to learn on its own. Hence, models are trained for the three signal combinations, (a) only BVP, (b) only EDA and (c) BVP and EDA.
4.2 Classification tasks
We aim for and evaluated two different classification tasks.
2-class
The classic task of flow classification tries to discriminate between low flow and high flow states. We again follow the method of Rissler et al., which selects the 20% highest-flow data points for the high flow state and the 20% lowest-flow data points for the low flow state. Data points that fall in between are discarded in this case.
3-class
Going one step further, we aim to discriminate between three different affective states: Boredom, Flow and Stress. This distinction enables the model to explain why a participant is not in flow: Because she is underchallenged or because she is overchallenged. This information is important when the flow detection should be used to adapt a system in realtime, because it allows to infer the direction in which an adjustment has to be made. To create the dataset for this task, the three different levels of each session were mapped to the three aforementioned states. Since not every participant had experienced flow in exactly the way we tried to induce it by manipulating the game levels, we reduced the dataset to exactly those sessions in which the intended mapping between game level and flow level actually worked (based on the results of the questionnaires that participants completed after each level). The resulting dataset still contained 45 sessions which were now accurately labeled to learn the 3-class task.
5 Model Architecture
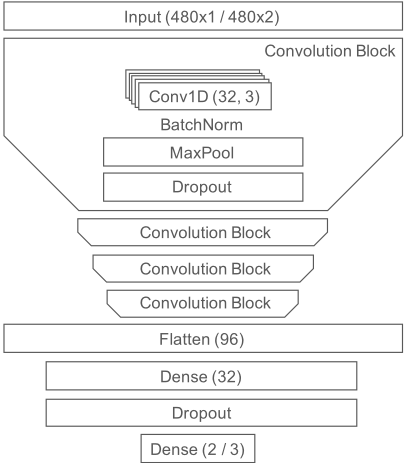
Figure 3 shows the CNN architecture we used for our experiments. The network consists of four convolutional layers (32 filters, kernel size 3), connected through max pooling layers. After the convolutions, one fully connected layer (32 neurons) leads to a final dense layer with the number of neurons in accordance with the number of classes of the task and a softmax activation. Except for the last layer, we used ReLU activations for the layers. During training, dropout is applied after the convolutional (0.1) and dense (0.5) layers to prevent overfitting. We used the popular Adam optimization algorithm with a learning rate of 0.001 without learning rate decay to train the neural network.
Since to the best of our knowledge, this new approach is the first to create a flow detection model using end-to-end deep learning, extensive hyper-parameter tuning and model architecture search were omitted. In preliminary experiments, the chosen model was found to be a good fit for the problem at hand. Although the time-series nature of the data might suggest a recurrent architecture, we often find that convolutional architectures are effective in dealing with time-series data as well. These findings are in line with other recent work comparing recurrent and convolutional architectures for sequence modelling [Bai et al., 2018]. Nonetheless, exploring recurrent and different, more sophisticated architectures can be a reasonable endeavor for future work.
6 Evaluation
We conducted 5-fold cross validations to evaluate the performance of the various approaches in terms of the 2-class and the 3-class task. It is important to note that the 20% test data only contain unseen levels, to ascertain that the model is able to generalize well on unseen data. Because the dataset was created as described above, the training and test sets were balanced (i.e. stratified). Training of the neural network in general was limited to 8 epochs in each fold. Usually, the highest test accuracies were reached after just a few epochs and the model tends to overfit later on.
Table 2 shows the results for the approaches of Rissler et al. and Chanel et al. compared to the results of our DeepFlow approach. Although the related methods were each only designed for one of the classification tasks, we tested their applicability for both tasks. The mean test accuracies of the 5fold cross validation of the DeepFlow models are at comparable levels to the related approaches (2-class: 67.50%, 3-class: 49.23%). Note that for the 2-class and 3-class tasks, an accuracy of 50% and 33%, respectively, can serve as a baseline because the test sets were balanced between the classes.
| Accuracy [%] | Rissler et al. | Chanel et al. | DeepFlow (BVP) | DeepFlow (EDA) | DeepFlow (BVP & EDA) |
| 2-class | 66.07 | *63.63 | 67.50 | 58.54 | 63.03 |
| 3-class | *42.86 | 48.89 | 41.40 | 45.35 | 49.23 |
7 Discussion
Several interesting observations can be made from the evaluation results. In general, one can see that our proposed methodology of applying deep learning to sensor data from wrist-worn devices does a good job at solving both the 2-class and the 3-class tasks. In the 2-class task, our DeepFlowmodel using BVP data is approximately on-par with the previous results from Rissler et al.. This is an interesting finding because of two reasons. First, it confirms previous results of Rissler et al. and indicates that their approach can be used in different settings with approximately the same levels of accuracy. Second, it shows that our end-to-end deep learning approach seems to be able to learn relevant features from the BVP data alone, maybe even similar ones as the manually engineered HRV features LF or HF. Despite the similar accuracy levels, it is noteworthy that our model works on single 2-minuteswindows from anywhere within a session whereas Rissler et al.'s approach requires data from (exactly) a whole level, i.e., the first two and the last two minutes. Consequently, the DeepFlow model might be more suitable for settings in which there is no clear beginning and end of a task.
Surprisingly at first, the addition of the EDA data leads to worse results of the DeepFlow approach in the 2-class task. We observe the exact opposite in the 3-class task, in which the DeepFlow model using both BVP and EDA performs significantly better than when using BVP alone. The importance of the EDA signal for the 3-class task is also corroborated by the results we obtain for the method of Chanel et al.. Here, EDA features are the most relevant features and the accuracy is comparable to our DeepFlow models. Previous work on EDA suggests that while emotionally activating events might lead to so-called peaks in the Skin Conductance Response (SCR), longer term phases of stress in general increase the slowly changing Skin Conductance Level (SCL) [Lang et al., 1993]. We speculate that exactly the possible effects of the three different affective states (especially the stress state) on the SCL can be learned by the DeepFlow model in the 3-class task. In the 2-class task, in contrast, the model is presented with low-flow examples that either are caused by boredom (typically lower SCL) or stress (typically higher SCL). In this case, the model has a harder time to make sense of the EDA data and probably overfits on the training examples.
With regard to our data pre-processing, it needs to be noted that standardization within single sessions already removes baseline differences between and even within participants. For example, if a participant experiences an elevated heart rate due to external influences (e.g., because of drinking coffee), the effect will probably be constant throughout the session, thus being filtered out through standardization. As a result, our model is not directly applicable in lesser-controlled settings, especially when we cannot standardize across a session that exhibits all three affective states (i.e., Boredom, Flow, and Stress). Nevertheless, we expect the variations of physiological baselines in many relevant domains such as gaming or work environments to be rather small, thus, allowing for an approximate standardization of the signals based on a (short) calibration phase for each participant.
8 Applications
We expect that our model can also be applied in other, similar domains. Yet, a detailed analysis regarding the model's transferability is left for future work. If the premise holds, applying automatic flow detection in user interface or user experience tests could provide very valuable and objective pieces of information about how smooth the interaction with a software or device really is, and especially, at which points of the interaction the user is thrown out of the flow state.
Taking this one step further, one could not only analyze a certain user experience after it happened, but could also adapt the user interface (or content or work task, etc.) in real-time in order to keep the user in the state of flow. A primary domain in this regard is gaming (e.g., adapting the difficulty according to the user's state), but there are many other promising use cases, e.g., for new work environments, online educational courses, or smart physical devices.
We also envision our approach to be used as a feedback mechanism for human-in-the-loop RL systems. It has been shown that RL agents can learn faster when provided with feedback from humans as a reward signal [Christiano et al., 2017]. Furthermore, facial emotion recognition has already been used as a feedback mechanism to improve a sketchdrawing Artificial Intelligence (AI) [Jaques et al., 2018]. While feedback based on facial emotion recognition is a lower latency mechanism compared to using physiologybased flow detection, we expect the flow construct to be a more relevant assessment in cases in which a human already interacts or works together with an intelligent agent. That means that using flow detection might not be the best approach for initial training, but it probably is a valuable signal for refinement of an agents behavior.
9 Conclusion and FutureWork
In this work, we introduced a new approach for automatically detecting the affective state of flow based on physiological signals collected with sensors from wrist-worn devices. With data collected using a modified version of the game Tetris, we trained a CNN to classify this state and obtained an accuracy of 67.50% in a 2-class classification task, i.e., low flow vs. high flow. In a 3-class task, i.e., distinguishing between the states of boredom, flow, and stress (induced by our level design), our DeepFlow approach reaches 49.23% accuracy.
These positive initial results open up several possibilities for future work. In addition to improving the data set and tuning the model, we see a lot of potential in transferring the general approach to other, similar tasks, especially typical tasks of an office activity. This could be the basis for an intelligent, automatic controlling of office tasks and workloads (keeping employees in flow).
More clearly scoped to the field of AI research, we are especially interested in using automatic flow detection as a feedback mechanism in human-in-the-loop RL. Socially intelligent agents could benefit from the information about this affective state by using it as a reward signal for their behavior.
@inproceedings{ijcai2019p196,
  title     = {DeepFlow: Detecting Optimal User Experience From Physiological Data Using Deep Neural Networks},
  author    = {Maier, Marco and Elsner, Daniel and Marouane, Chadly and Zehnle, Meike and Fuchs, Christoph},
  booktitle = {Proceedings of the Twenty-Eighth International Joint Conference on
               Artificial Intelligence, {IJCAI-19}},
  publisher = {International Joint Conferences on Artificial Intelligence Organization},
  editor    = {Sarit Kraus},
  pages     = {1415--1421},
  year      = {2019},
  month     = {8},
  note      = {Main track},
  doi       = {10.24963/ijcai.2019/196},
  url       = {https://doi.org/10.24963/ijcai.2019/196},
}
TY - CPAPER TI - DeepFlow: Detecting Optimal User Experience From Physiological Data Using Deep Neural Networks AU - Maier, Marco AU - Elsner, Daniel AU - Marouane, Chadly AU - Zehnle, Meike AU - Fuchs, Christoph T2 - Proceedings of the Twenty-Eighth International Joint Conference on Artificial Intelligence, IJCAI-19 PB - International Joint Conferences on Artificial Intelligence Organization PY - 2019 SP - 1415 EP - 1421 DO - 10.24963/ijcai.2019/196 UR - https://doi.org/10.24963/ijcai.2019/196 ER -Copied
Machine-readable versions of this paper, for tools and AI agents:





