
AddGraph: Anomaly Detection in Dynamic Graph Using Attention-based Temporal GCN
Proceedings of the Twenty-Eighth International Joint Conference on Artificial Intelligence. Main track. Pages 4419-4425.
https://doi.org/10.24963/ijcai.2019/614
Keywords
- Machine Learning: Deep Learning
- Machine Learning: Time-series;Data Streams
- Machine Learning: Semi-Supervised Learning
Abstract
Anomaly detection in dynamic graphs becomes very critical in many different application scenarios, e.g., recommender systems, while it also raises huge challenges due to the high flexible nature of anomaly and lack of sufficient labelled data. It is better to learn the anomaly patterns by considering all possible features including the structural, content and temporal features, rather than utilizing heuristic rules over the partial features. In this paper, we propose AddGraph, a general end-to-end anomalous edge detection framework using an extended temporal GCN (Graph Convolutional Network) with an attention model, which can capture both long-term patterns and the short-term patterns in dynamic graphs. In order to cope with insufficient explicit labelled data, we employ the negative sampling and margin loss in training of AddGraph in a semi-supervised fashion. We conduct extensive experiments on real-world datasets, and illustrate that AddGraph can outperform the state-of-the-art competitors in anomaly detection significantly.
- [Aggarwal et al., 2011] Charu C Aggarwal, Yuchen Zhao, and S Yu Philip. Outlier detection in graph streams. In 2011 IEEE 27th International Conference on Data Engi- neering, pages 399-409. IEEE, 2011.
- [Akoglu et al., 2015] Leman Akoglu, Hanghang Tong, and Danai Koutra. Graph based anomaly detection and de- scription: a survey. Data mining and knowledge discovery, 29(3):626-688, 2015.
- [Bordes et al., 2013] Antoine Bordes, Nicolas Usunier, Alberto Garcia-Duran, Jason Weston, and Oksana Yakhnenko. Translating embeddings for modeling multi-relational data. In Advances in neural information processing systems, pages 2787-2795, 2013.
- [Chung et al., 2014] Junyoung Chung, Caglar Gulcehre, KyungHyun Cho, and Yoshua Bengio. Empirical evalua- tion of gated recurrent neural networks on sequence mod- eling. arXiv preprint arXiv:1412.3555, 2014.
- [Cui et al., 2017] Qiang Cui, Shu Wu, Yan Huang, and Liang Wang. A hierarchical contextual attention-based gru net- work for sequential recommendation. arXiv preprint arXiv:1711.05114, 2017.
- [Defferrard et al., 2016] Michaël Defferrard, Xavier Bres- son, and Pierre Vandergheynst. Convolutional neural net- works on graphs with fast localized spectral filtering. In Advances in neural information processing systems, pages 3844-3852, 2016.
- [Eswaran et al., 2018] Dhivya Eswaran, Christos Faloutsos, Sudipto Guha, and Nina Mishra. Spotlight: Detecting anomalies in streaming graphs. In Proceedings of the 24th ACM SIGKDD International Conference on Knowledge Discovery & Data Mining, pages 1378-1386. ACM, 2018.
- [Grover and Leskovec, 2016] Aditya Grover and Jure Leskovec. node2vec: Scalable feature learning for networks. In Proceedings of the 22nd ACM SIGKDD international conference on Knowledge discovery and data mining, pages 855-864. ACM, 2016.
- [Hooi et al., 2016] Bryan Hooi, Hyun Ah Song, Alex Beutel, Neil Shah, Kijung Shin, and Christos Faloutsos. Fraudar: Bounding graph fraud in the face of camouflage. In Pro- ceedings of the 22nd ACM SIGKDD International Con- ference on Knowledge Discovery and Data Mining, pages 895-904. ACM, 2016.
- [Kipf and Welling, 2017] Thomas N. Kipf and Max Welling. Semi-supervised classification with graph convolutional networks. In International Conference on Learning Rep- resentations (ICLR), 2017.
- [Liu et al., 2017] Jun Liu, Gang Wang, Ping Hu, Ling-Yu Duan, and Alex C Kot. Global context-aware attention lstm networks for 3d action recognition. In Proceedings of the IEEE Conference on Computer Vision and Pattern Recognition, pages 1647-1656, 2017.
- [McConville et al., 2015] Ryan McConville, Weiru Liu, and Paul Miller. Vertex clustering of augmented graph streams. In Proceedings of the 2015 SIAM International Confer- ence on Data Mining, pages 109-117. SIAM, 2015.
- [Ranshous et al., 2015] Stephen Ranshous, Shitian Shen, Danai Koutra, Steve Harenberg, Christos Faloutsos, and Nagiza F Samatova. Anomaly detection in dynamic net- works: a survey. Wiley Interdisciplinary Reviews: Compu- tational Statistics, 7(3):223-247, 2015.
- [Ranshous et al., 2016] Stephen Ranshous, Steve Harenberg, Kshitij Sharma, and Nagiza F Samatova. A scalable ap- proach for outlier detection in edge streams using sketch- based approximations. In Proceedings of the 2016 SIAM International Conference on Data Mining, pages 189-197.
- [Shin et al., 2016] Kijung Shin, Bryan Hooi, and Christos Faloutsos. M-zoom: Fast dense-block detection in ten- sors with quality guarantees. In Joint European Confer- ence on Machine Learning and Knowledge Discovery in Databases, pages 264-280. Springer, 2016.
- [Shin et al., 2017] Kijung Shin, Bryan Hooi, Jisu Kim, and Christos Faloutsos. D-cube: Dense-block detection in terabyte-scale tensors. In Proceedings of the Tenth ACM International Conference on Web Search and Data Min- ing, pages 681-689. ACM, 2017.
- [Sricharan and Das, 2014] Kumar Sricharan and Kamalika Das. Localizing anomalous changes in time-evolving graphs. In Proceedings of the 2014 ACM SIGMOD inter- national conference on Management of data, pages 1347- 1358. ACM, 2014.
- [Sun et al., 2006] Jimeng Sun, Dacheng Tao, and Christos Faloutsos. Beyond streams and graphs: dynamic tensor analysis. In Proceedings of the 12th ACM SIGKDD in- ternational conference on Knowledge discovery and data mining, pages 374-383. ACM, 2006.
- [Tang et al., 2015] Jian Tang, Meng Qu, Mingzhe Wang, Ming Zhang, Jun Yan, and Qiaozhu Mei. Line: Large- scale information network embedding. In Proceedings of the 24th International Conference on World Wide Web, pages 1067-1077. International World Wide Web Confer- ences Steering Committee, 2015.
- [Wang et al., 2014] Zhen Wang, Jianwen Zhang, Jianlin Feng, and Zheng Chen. Knowledge graph embedding by translating on hyperplanes. In Twenty-Eighth AAAI con- ference on artificial intelligence, 2014.
- [Yu et al., 2018] Wenchao Yu, Wei Cheng, Charu C Aggar- wal, Kai Zhang, Haifeng Chen, and Wei Wang. Netwalk: A flexible deep embedding approach for anomaly detec- tion in dynamic networks. In Proceedings of the 24th ACM SIGKDD International Conference on Knowledge Discov- ery & Data Mining, pages 2672-2681. ACM, 2018.
- [Zhao and Yu, 2013] Yuchen Zhao and Philip S Yu. On graph stream clustering with side information. In Proceed- ings of the 2013 SIAM International Conference on Data Mining, pages 139-150. SIAM, 2013.
References were extracted automatically from the PDF and may contain errors.
Full text extracted automatically from the PDF; figures, tables and equations may differ. The PDF is the version of record.
1 Introduction
The recent years witness the rapid development of dynamic graphs. Taking the e-commerce sites as an example. Massive users perform different operations, such as item clicking, item buying, in the sites every day, which contribute to millions of newly-added edges into the graph. The modification of other attributes for accounts/items also produces a large amount of content information. These dynamic graphs serve as the basis for the most important tasks in the e-commerce sites like the query and item recommendation.
Anomalous users may perform some operations to generate fake data in the dynamic graphs to achieve the potential gain. These fake data are called anomaly in this paper. Taking the anomaly in the recommendation as an example. Anomalous users can improve the popularity of their target items through a large number of new operations related to target items, like clicking both target items and popular ones frequently. Then, the target items may show some similarities to other popular ones, which increases the chances and upgrade rankings in the recommendation [Hooi et al., 2016]. In order to achieve the goal quickly, anomalous users usually control multiple accounts to perform these operations in a short time period. The anomaly detection in dynamic graph, especially anomalous edges detection, is then highly needed before the data are fed into the following tasks [Akoglu et al., 2015; Ranshous et al., 2015].
∗Contact Author
It is not trivial to detect the anomaly due to its flexible and dynamic nature. Some anomalous operations show some explicit patterns but try to hide them in a large graph, while others are with implicit patterns. Take an explicit anomaly pattern in the recommender system as an example. As anomalous users usually control multiple accounts to promote the target items, the edges between these accounts and items may compose a dense subgraph, which emerge in a short time period. In addition, although the accounts which involve the anomaly perform anomalous operations sometimes, these accounts perform normally most of the time, which hides their long-term anomalous behavior and increases the difficulty of detection. The similar anomaly pattern appears in the network attack against IP-IP network [Eswaran et al., 2018], where there are sudden large number of connections, forming a very dense subgraph in the network. Such cases indicate the flexible nature of anomaly, which requires us to learn the anomaly patterns by combining all available hints like structural, temporal and content features.
Another challenge in the anomaly detection lies in the insufficient labelled data. Even if the initial data are normal, anomaly data will be finally mixed with the normal ones in the real-world applications as time goes by. It results in high burden or is even infeasible if we check the anomaly every day by hand. Even if we can label some anomaly operations, they may occupy a small part of anomalies. It indicates that the explicit labelled data may be not representative, and results in the poor performance if we learn a detection model in a supervised way.
Most of existing approaches to detecting the anomalies in dynamic large graphs rely on the heuristic rules which consider the above features in a rigid way. For example, [Hooi et al., 2016] mainly relies on the structural features. They define a density function and discover the target mainly using structural features. Other works [Zhao and Yu, 2013; McConville et al., 2015] consider content feature or even temporal factor. However, the way taking the content, structural and temporal factors into account is not flexible, which makes it restricted in a specific pattern. In addition, it is more difficult to detect anomalies using the long-term features due to their sparsity in the time dimension.
The advance of deep learning is very helpful in anomaly detection, with its ability to combine different features in a reasonable way and to learn implicit rules from the given data. GCN(Graph Convolutional Network) is a representative model to combine the content and structural features in a graph [Kipf and Welling, 2017]. Compared with traditional graph methods, GCN can automatically propagate the information carried by neighboring nodes, which can then be used to spread the anomalous probabilities of nodes. The major issue of direct usage of GCN in the anomaly detection lies in the fact that GCN does not consider the timing factors, which cannot be ignored in the dynamic graphs. The more recent works, like CAD [Sricharan and Das, 2014] and Netwalk [Yu et al., 2018] have applied the graph embedding method to dynamic graph. Their methods are well designed and have achieved good results on detecting anomalies in dynamic graphs. However, they cannot capture the long-term and short-term patterns of nodes, which are highly needed in a more general graph model framework to detect anomalies.
In order to overcome the limitations of the existing works, this paper extends the original GCN model to support temporal information using GRU(Gated Recurrent Unit) with a contextual attention-based model, and then introduces a selective negative sampling and margin loss in model training for anomalous edges incrementally. Specifically, the main contributions of our work are summarized as follows.
- We propose AddGraph, a semi-supervised learning framework for anomalous edge detection, using an extended temporal GCN with an attention-based GRU, which can combines the hidden states for long-term behavior patterns and the window information containing the short-term patterns of the nodes.
- We introduce a selective negative sampling strategy and margin loss in the training of AddGraph for detecting anomalous edges, inspired by the advances in embedding of knowledge graph. Those strategies attempt to handle the insufficient labelled anomaly data.
- Experiments on two real-world datasets achieve stateof-the-art performance, which proves the effectiveness of AddGraph on detecting anomalies in different kinds of graphs.
2 RelatedWork
In this section, we review the existing anomaly detection approaches, the graph embedding model, and some attempts to detect anomaly on embeddings.
2.1 Anomaly Detection in Dynamic Graph
Goutlier [Aggarwal et al., 2011] is proposed with an observation that anomalous edges always appear between two different node clusters. Specifically, it first partitions nodes, and then builds an edge generative model for the edges inside partition. The scores produced by the model can be used as an important measure in detecting anomalous edges. The works [Sun et al., 2006; Shin et al., 2016; Shin et al., 2017] view the anomaly as a dense sub-graph. Shin [2016; 2017] define a density function in the dynamic bipartite graph, and employ a greedy search strategy or sequence search to find these most dense sub-graphs. These works mainly rely on structural features lacking in flexibility as patterns are given in advance.
Besides the structural features, the temporal ones are considered in the anomaly detection. CM-Sketch [Ranshous et al., 2016] is a sketch-based method, which uses the local structural information and historical behavior near an edge to decide whether the edge is anomalous or not. SpotLight [Eswaran et al., 2018] randomly samples a series of node sets from the entire node set, and encodes the the graph at each timestamp to a vector by computing the overlap between these sets and the nodes of current edge set. The method finds out the anomalous graph by clustering these vectors. However, it can only catch instantaneous anomalies.
2.2 Graph Embedding
Graph embedding maps the nodes into a K-dimensional vector space, which preserves certain properties among nodes. Deepwalk [Tang et al., 2015], LINE [Tang et al., 2015] and Node2vec [Grover and Leskovec, 2016] are the methods to yield node embeddings so that two structural similar nodes have the similar embeddings. The difference of these works lies in the meaning of structural similarities. Deepwalk uses random walk to get an ordered sequence of nodes. LINE attempts to preserve the first-order similarity and the secondorder proximity. Node2vec improves random walk by introducing two parameters to balance the breadth-first search and depth-first search. Those methods can be used to yield node embeddings for detecting anomaly. However, they mainly focus on the preservation of structural similarity.
The work of GCN and following extensions can process structural features and content features. GCN extends the idea of convolution model over regular graphs (i.e., image) to general graphs. The works [Defferrard et al., 2016; Kipf and Welling, 2017]improve the performance of basic GCN from different viewpoints, like the optimization in time/space complexity. Due to its ability to handle both structural and content features, GCN can be leveraged as the basis in our anomaly detection approach. However, we cannot directly use GCN in our work, as it does not consider temporal features in dynamic graphs. Note that we choose the basic GCN in this paper, and its extensions can also be used with minor modification.
Knowledge graph embedding projects a triple (h, r, t) to low-dimensional vector spaces to preserve potential similarities and differences between multi-relational data. Insufficient data is also a key challenge for knowledge graph embedding, because there are only golden triples in the original dataset, which may result in weak distinction of data in different relationships. In order to solve this challenge, negative sampling is used to produce edges by randomly replacing the
ऑ࢚
ࡿࢇ࢙ࢎ࢚࢙
ࡴࢊࢊࢋ ࢙࢚ࢇ࢚ࢋ࢙ ࡻ࢛࢚࢛࢚ ࡸࢇ࢟ࢋ࢘
head or tail entities [Bordes et al., 2013]. In [Wang et al., 2014], a Bernoulli distribution is used for negative sampling, which holds different probabilities to replace head and tail in relations. To make the triple produced by negative sampling different from the golden one, margin loss is used to enlarge the difference between positive triples and negative samples. In this paper, we use a similar idea of negative sampling and margin loss from knowledge graph embedding to solve the problem of insufficient data in anomaly detecting.
2.3 Anomaly Detection over Graph Embedding
Some works began to combine the graph embedding into the anomaly detection. In [Sricharan and Das, 2014], a timecommute distance is used to detect anomalous changes in dynamic graph, while the method mainly focuses on structural features and cannot catch long-term anomalies. [Yu et al., 2018] proposed NetWalk, a dynamic graph embedding model based on random walks. The anomaly detection is realized by the dynamic clustering model of node representation. Our work roughly follows a similar idea. However, we extend GCN to the temporal GCN so that we can capture the temporal features in a more reasonable way, and we build an end-to-end semi-supervised learning model to detect anomalous edges rather than two-phases clustering, which has the potential to achieve better results.
3 ProposedMethod
In this section, we first formulate the problem, propose an AddGraph framework for anomaly detection, and then discuss its training strategies.
3.1 ProblemDefinition
Let T be the maximum timestamp. A graph steam G takes the form of {G t }Tt=1 , where each G t = (V t , E t ) represents the entire snapshot at timestamp t, and V t and E t are the set of nodes and edges respectively. An edge e = (i, j, w) ∈ E t means that the i-th node and the j-th node have a connection in the dynamic graph at the timestamp t with its weight w. For unweighted graphs, w is always 1; for weighted graphs, w ∈ R+. An adjacency matrix At ∈ Rm×n is to represent the edges in E t , where ∀(i, j,w) ∈ E t ,At [i][j] = w. For convenience, let G = (V,E) be the union of G, i.e., V = ⋃Tt=1V t and E = ⋃Tt=1E t . We let n = |V | and m = |E|.
The goal of this paper is to detect anomalous edges in E t . Specifically, for each e ∈ E t , this paper produces f(e), the
Algorithm 1 AddGraph algorithm
Input: Edge stream {E t }Tt=1 Parameter: β, µ, λ, γ, L, ω, d Output: {Ht }Tt=1 1: Initialize H0 2: repeat 3: for t = 1 to T do 4: Let Lt = 0 5: Currentt = GCN(Ht-1 ) 6: Shortt = CAB(Ht-w ; ...;Ht-1 ) 7: Ht = GRU(Currentt , Shortt ) 8: for all (i, j, w) ∈ E t do 9: Sample(i′ , j ′ , w) for f(i, j, w) 10: Lt = Lt + max(0, γ + f (i, j, w) + f (i′ , j ′ , w)) 11: end for 12: Lt = Lt +Lreg 13: Minimize Lt 14: end for 15: until Convergence 16: return {Ht }Tt=1anomalous probability of e. We do not need the labelled data for anomaly in the training phase, but assume that all edges in sets at the initial timestamps are normal, i.e., t is smaller than the timestamp Ttrain in training phase. In the test phase, we use the labelled anomaly data to measure f(e) produced in different methods.
3.2 AddGraph Framework
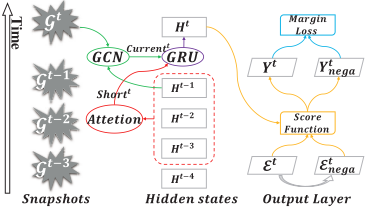
The overview of our AddGraph framework is illustrated in Figure 1. The core idea behind AddGraph is to build a framework to describe the normal edges by using all possible features in the snapshots in the training phase, including structural, content and temporal features. The framework then can be further refined and used to measure the anomalous edges in the following snapshots. Roughly, AddGraph employs GCN to process the previous node state with edges in the current snapshot by considering the structural and content features of nodes. The node states in a short window are then summarized as the short-term information with a contextual attention-based model. We put the output of GCN and shortterm information into GRU to get the hidden state of nodes at a new timestamp. We will use the hidden state of the nodes at each timestamp to calculate the anomalous probabilities of an existing edge and a negative sampled edge, and then feed them to a margin loss.
GCN for content and structural features. At timestamp t, we receive the snapshot G t = (V t , E t ) with its adjacency matrix At and the output hidden state matrix Ht-1 ∈ Rn×d of the framework at timestamp t - 1. First, we propagate the hidden state matrix with GCN,
where Currentt represents current state of nodes combining the current input with the long-term hidden state, and GCNL denotes an L-layered GCN which is proposed in [Kipf and Welling, 2017]. The details of GCNL are shown below:
where l ∈ [1,L - 1]. ˆAt = ˜D- 1 2 ˜At ˜D- 1 2 is the regularized adjacency matrix with self loops, where ˜At = At + In denotes the adjacency matrix with self loops, and ˜Dii = ∑j ˜ Atij denotes the degree of node i.
GRU with attention to combine short-term and long-term states. To catch the short-term pattern of nodes, we apply the contextual attention-based model which is inspired by [Liu et al., 2017] and proposed by [Cui et al., 2017]. In our framework, we construct short state of local window as follow:
where hti denotes the hidden state of the i-th node, and ω is the size of the window to catch short-term pattern. Qh and r are parameters to optimize the contextual attention-based model. We brief (5) - (8) to a single function:
For all nodes in V , the function is written as:
Now we get Currentt and Shortt . Currentt represents current states of nodes which combine the current input with the long-term hidden state, and Shortt represents the window information which catches the short-term interest of nodes. To make AddGraph encode temporal features, we use GRU to process Currentt and Shortt :
GRU is a variant of LSTM network. It is simpler and more effective than LSTM network [Chung et al., 2014]. GRU can record long-term information, and avoid gradient vanishing and exploding problems. The forward propagation equations of GRU in our framework are:
where Pt is the update gate to control output and Rt is the reset gate to balance input and memory. Now we get Ht containing the structural, content and temporal features.
Anomalous score computation for edges. Now, we get the hidden state of nodes Ht at timestamp t. For each edge (i, j, w) ∈ E t , we locate the embeddings for the i-th node and the j-th node in Ht , on which we can compute the anomalous scores:
where hi and hj are the hidden state of the i-th and j-th node respectively, and σ(x) = 1 1+ex is the sigmoid function. a and b are parameters to optimize in the output layer. β and µ are the hyper-parameters in the score function. Note that the single layer network used in this paper can be replaced by other sophisticated networks.
3.3 Selective Negative Sampling and Loss
In order to handle the insufficiency of anomaly data, we try to build a model to describe the normal data instead. Recall that we assume that all edges are normal in the training phase. For each normal edge in the graph, we generate a negative sample as an anomalous edge. Inspired by the method proposed in [Wang et al., 2014], we define a Bernoulli distribution with parameter di di+dj for sampling: given a normal edge (i, j), we replace i with probability di di+dj and replace j with probability dj di+dj , where di and dj denote the degree of the i-th node and the j-th node respectively.
As the generated sampled edges may be still normal, we cannot use a strict loss function such as cross entropy to distinguish the existing edges and the generated ones. We then take the same idea in [Bordes et al., 2013] and use marginbased pairwise loss in training of AddGraph:
where f(·, ·, ·) is the anomalous score function for edges, and γ ∈ (0, 1) is the margin between the possibilities of normal edge and anomalous one. The minimization of the loss function Lt encourages that f(i, j, w) becomes smaller while f(i′ , j ′ , w) becomes larger, which is in the same line with our expectation.
We cannot assume that all edges are still completely normal in the snapshots after training phase, while we need to compute the hidden states for each snapshot. In the process of sampling on the graph mixed with normal and anomalous edges, we actually select partial edges which are more credible for the training. Specifically, for each edge (i, j,w), we produce a negative sampled edge (i′ , j ′ ,w). The sampled edge pair is discarded if f(i, j,w) > f(i′ , j ′ ,w). The selective negative sampling strategy ensures the stability of AddGraph framework for a long time.
The overall loss function is summarized as follows:
where λ is a hyper-parameter, and Lreg is an L2regularization loss to avoid overfitting, which is shown as follows:
We summarize our algorithm as Algorithm 1.
| Dataset | Anomaly proportion | GOutlier | CM-Sketch | Netwalk | AddGraph |
|---|---|---|---|---|---|
| UCI Message | 1% | 0.7181 | 0.7270 | 0.7758 | 0.8083 |
| 5% | 0.7053 | 0.7086 | 0.7647 | 0.8090 | |
| 10% | 0.6707 | 0.6861 | 0.7226 | 0.7688 | |
| Digg | 1% | 0.6963 | 0.6871 | 0.7563 | 0.8341 |
| 5% | 0.6763 | 0.6581 | 0.7176 | 0.8470 | |
| 10% | 0.6353 | 0.6179 | 0.6837 | 0.8369 |
| Dataset | #Node | #Edge | Max. Degree | Avg. Degree |
|---|---|---|---|---|
| UCI Message | 1,899 | 13,838 | 255 | 14.57 |
| Digg | 30,360 | 85,155 | 283 | 5.61 |
4 Experiment
In this section, we first describe the experimental setup, and then compare AddGraph with other competitors.
4.1 Experimental Setup
Dataset. We evaluate our framework on two datasets and the details of these two datasets are shown in Table 2. UCI Message is a directed network containing messages among an online community at University of California, Irvine. Each node represents a user and each directed edge is for a message between two users. Digg is a response network of Digg, a social news site. Each node in the network is a user of the site, and each edge indicates that one user replies to another. Edges in both datasets are annotated with timestamps. We randomly generate an initial vector for each node as its content feature. We need to manually build the required datasets because the ground-truth for the test phase is difficult to obtain [Akoglu et al., 2015], and we follow the approach used in [Yu et al., 2018] to inject anomalous edges into two datasets.
Baselines. We compare AddGraph with three anomaly detection methods.
- GOutlier [Aggarwal et al., 2011]. It builds a generative model for edges in a node cluster, and the model can also be used to produce anomalous score for a given edge.
- CM-Sketch [Ranshous et al., 2016]. It uses the local structural feature and historical behavior near an edge to measure whether the edge is anomalous or not.
- NetWalk [Yu et al., 2018]. The method first builds node embeddings based on random walks, and then detects anomaly using the clustering on the node embedddings.
Experimental Design. We will test the anomaly detection methods over graphs without timestamps to see whether the framework can exploit the content and structural features effectively, and then extend to the dynamic graphs with all features. We will study the impacts of different parameters on AddGraph. The metric used to compare the performance of different methods is AUC (the area under the ROC curve).
4.2 Experimental Results
Results on Graphs without Timestamps
The tests over graphs without timestamps mainly focus on the exploration of structural and content features. As for AddGraph, a simplified version without window information is conducted for this experiment. We divide the dataset into two parts, the first 50% as the training data and the latter 50% as the test data. The number of GCN layers is 2. The weight decay λ for regularization is 5e-7. The learning rate lr is 0.002. The dropout rate is 0.2. For UCI Message dataset, the size of dimension is 500 for hidden state. The margin γ is set to 0.5. The parameters β and µ is set to 1.0 and 0.3 respectively. For Digg dataset, the size of dimension is 200 for hidden state. The margin γ is set to 0.7. The parameters β and µ is set to 3.0 and 0.5 respectively. We injected 1%, 5%, and 10% of the anomalous data into the test data of different datasets.
The results are shown in Table 1, in which the data of baselines are reported by [Yu et al., 2018]. We can see that AddGraph beats all baselines on the two datasets with varying anomaly proportions and has better ability to catch structural and content features. This is mainly due to the underlying GCN, which enables the framework to spread information between nodes and its neighbors better. In particular, on Digg dataset, our approach has gained more than 10% improvement. This outstanding effect proves that our framework can exploit the content and structural features effectively. Unlike the trend of baselines' results, AUC produced by our framework with 1% anomaly is a little lower than that with 5% anomaly, while it's still higher than all baselines. This may be due to the fact that when the anomaly proportion of the test set is low, the scores computed on the original data and negative samples cannot distinct them well, resulting in a decline of prediction accuracy.
Results on Dynamic Graphs
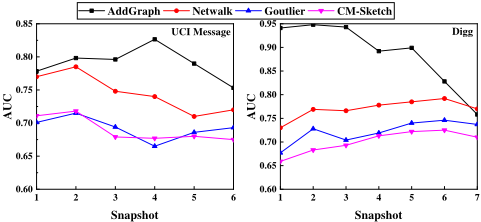
In the tests over dynamic graphs, we use the first 50% as the training data and the latter 50% as the test data. After anomaly injection with proportion of 5%, we split the training data and test data into snapshots. According to the size of dataset, the snapshot size is set to 1,000 and 6,000 for UCI Message and Digg respectively. In training phase, we use snapshots of training data to build an initial model. In test phase, we maintain the model incrementally as each snapshot at timestamp t arrives. The number of GCN layers is set to 3. The learning rate lr is 0.001. For UCI Message dataset, the size of dimension is 100 for hidden states. For Digg dataset, the size of dimension is 50 for hidden states. The margin γ
is set to 0.6. The rest parameters are with the same values as above.
Figure 2 illustrates the results on dynamic graph, in which the data of baselines are reported by [Yu et al., 2018]. The results indicate that AddGraph beats baselines on almost all snapshots except the last one in Digg. The prediction results show our framework is able to catch temporal features. The attention mechanism enables our framework to notice the changes of nodes during the window period. The extended GCN with GRU makes it possible to record long-term dependency. The decline on the last snapshot may be due to the fact that too many new nodes emerge in the test phase, which are not processed before.
Parameter Sensitivity
Now, we attempt to find out the influence of hyper-parameters on AddGraph, including L for the total number of layers in GCN, d for the size of dimension of hidden state, and the training ratio of the entire dataset.
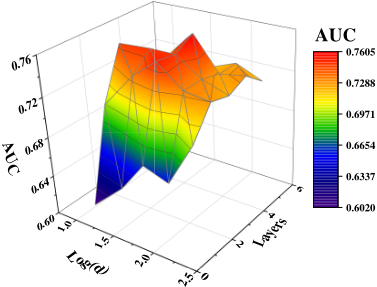
First, we evaluate the influence of L and d. The range of L is {1, 2, 3, 4, 5} and the range of d is {10, 25, 50, 100, 200}. Other parameters are set to optimum. In order to show the influence of different values of the parameters, we choose a relatively more challenging task in this study. We use Digg dataset with 10% anomalies in test data and detect anomalies at the last timestamp in terms of the AUC metric. For ease of observation, we use log(d) instead of d as the x-axis. As shown in Figure 3, AUC increases significantly when L increases from 1 to 2, and reaches its peak when L is 3. With the increase of d, the performance of AddGraph is gradually improved, and reaches the optimal value when d is 50. After d and L reach the optimal configuration, AUC decreases as they continue to increase. When there are too many layers, GCN may capture useless information of remote neighbors, which reduces the accuracy of the framework. Larger d will increase the complexity of the framework and make it more difficult in converging to the optimal point.
Second, we evaluate the influence of the training ratio of the entire dataset. The range of training ratio is {10%, 20%, 30%, 40%, 50%, 60%} and other parameters are set to optimum. We use Digg dataset with 10% anomalies in test data and record the AUC score of each timestamp at the test phase. As shown in Figure 4, with the decrease of training ratio, the average and maximum AUC values of AddGraph show an upward trend, while the minimum values indicate a downward trend. Since there is no anomalous data in the training
2.5
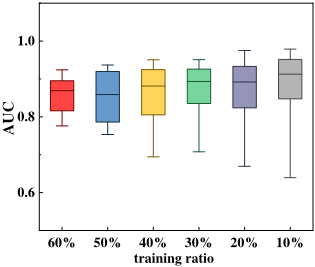
Figure 4: AUC results on Digg with different training ratios
set, a higher proportion of test data contains more anomalous edges, which enables AddGraph to increase the distance between the scores of positive and negative samples. These results show the strong ability of our framework to detect anomalous edges in dynamic graphs with insufficient training data. The decrease of the minimum value is due to the reduction of the training data, which reduces the stability of Addgraph.
5 Conclusion
We propose an anomaly detection framework, AddGraph, on dynamic graphs which can detect the patterns of anomalies flexibly without explicit labelled anomaly data. AddGraph attempts to learn the anomaly patterns by considering all possible hints including the structural, content and temporal features using the temporal GCN with a contextual attentionbased model. It also employs a selective negative sampling strategy and margin loss in training to handle the insufficient labelled anomaly data. Experiments on several realworld datasets show that AddGraph outperforms other existing anomaly detection methods significantly.
Acknowledgments
This work was partially supported by National Key Research and Development Program No.2016YFB1000700, NSFC under Grant No.61572040 and 61832001, and Alibaba-PKU joint Program.
@inproceedings{ijcai2019p614,
  title     = {AddGraph: Anomaly Detection in Dynamic Graph Using Attention-based Temporal GCN},
  author    = {Zheng, Li and Li, Zhenpeng and Li, Jian and Li, Zhao and Gao, Jun},
  booktitle = {Proceedings of the Twenty-Eighth International Joint Conference on
               Artificial Intelligence, {IJCAI-19}},
  publisher = {International Joint Conferences on Artificial Intelligence Organization},
  editor    = {Sarit Kraus},
  pages     = {4419--4425},
  year      = {2019},
  month     = {8},
  note      = {Main track},
  doi       = {10.24963/ijcai.2019/614},
  url       = {https://doi.org/10.24963/ijcai.2019/614},
}
TY - CPAPER TI - AddGraph: Anomaly Detection in Dynamic Graph Using Attention-based Temporal GCN AU - Zheng, Li AU - Li, Zhenpeng AU - Li, Jian AU - Li, Zhao AU - Gao, Jun T2 - Proceedings of the Twenty-Eighth International Joint Conference on Artificial Intelligence, IJCAI-19 PB - International Joint Conferences on Artificial Intelligence Organization PY - 2019 SP - 4419 EP - 4425 DO - 10.24963/ijcai.2019/614 UR - https://doi.org/10.24963/ijcai.2019/614 ER -Copied
Machine-readable versions of this paper, for tools and AI agents:





