
BeatGAN: Anomalous Rhythm Detection using Adversarially Generated Time Series
Proceedings of the Twenty-Eighth International Joint Conference on Artificial Intelligence. Main track. Pages 4433-4439.
https://doi.org/10.24963/ijcai.2019/616
Keywords
- Machine Learning: Time-series;Data Streams
- Machine Learning Applications: Bio;Medicine
- Machine Learning: Data Mining
Abstract
Given a large-scale rhythmic time series containing mostly normal data segments (or `beats'), can we learn how to detect anomalous beats in an effective yet efficient way? For example, how can we detect anomalous beats from electrocardiogram (ECG) readings? Existing approaches either require excessively high amounts of labeled and balanced data for classification, or rely on less regularized reconstructions, resulting in lower accuracy in anomaly detection. Therefore, we propose BeatGAN, an unsupervised anomaly detection algorithm for time series data. BeatGAN outputs explainable results to pinpoint the anomalous time ticks of an input beat, by comparing them to adversarially generated beats. Its robustness is guaranteed by its regularization of reconstruction error using an adversarial generation approach, as well as data augmentation using time series warping. Experiments show that BeatGAN accurately and efficiently detects anomalous beats in ECG time series, and routes doctors' attention to anomalous time ticks, achieving accuracy of nearly 0.95 AUC, and very fast inference (2.6 ms per beat). In addition, we show that BeatGAN accurately detects unusual motions from multivariate motion-capture time series data, illustrating its generality.
- [AAMI, 1998] AAMI. Testing and reporting performance results of cardiac rhythm and st segment measurement al- gorithms. ANSI/AAMI EC38, 1998.
- [Akcay et al., 2018] Samet Akcay, Amir Atapour- Abarghouei, and Toby P Breckon. Ganomaly: Semi- supervised anomaly detection via adversarial training. arXiv preprint arXiv:1805.06725, 2018.
- [An and Cho, 2015] Jinwon An and Sungzoon Cho. Varia- tional autoencoder based anomaly detection using recon- struction probability. Special Lecture on IE, 2:1-18, 2015.
- [Baum and Petrie, 1966] Leonard E Baum and Ted Petrie. Statistical inference for probabilistic functions of finite state markov chains. The annals of mathematical statis- tics, 37(6):1554-1563, 1966.
- Carreiras et al., 2015 ]
- Carlos Carreiras, Ana Priscila Alves, André Lourenc ¸o, Filipe Canento, Hugo Silva, Ana Fred, et al. BioSPPy: Biosignal processing in Python, 2015-. [Online; accessed 2019-1-12].
- [Chen et al., 2018] Pudi Chen, Shenghua Liu, Chuan Shi, Bryan Hooi, Bai Wang, and Xueqi Cheng. Neucast: Sea- sonal neural forecast of power grid time series. In IJCAI, pages 3315-3321, 2018. IJCAI
- [Davis and Goadrich, 2006] Jesse Davis and Mark Goadrich. The relationship between precision-recall and roc curves. In Proceedings of the 23rd international conference on Machine learning, pages 233-240. ACM, 2006.
- [Goodfellow et al., 2014] Ian Goodfellow, Jean Pouget- Abadie, Mehdi Mirza, Bing Xu, David Warde-Farley, Sherjil Ozair, Aaron Courville, and Yoshua Bengio. Gen- erative adversarial nets. In Advances in neural information processing systems, pages 2672-2680, 2014.
- [Hagiwara et al., 2018] Yuki Hagiwara, Hamido Fujita, Shu Lih Oh, Jen Hong Tan, Ru San Tan, Edward J Ciac- cio, and U Rajendra Acharya. Computer-aided diagnosis of atrial fibrillation based on ecg signals: a review. Infor- mation Sciences, 467:99-114, 2018.
- [Hooi et al., 2017] Bryan Hooi, Shenghua Liu, Asim Smailagic, and Christos Faloutsos. BEATLEX: Sum- marizing and forecasting time series with patterns. In Joint European Conference on Machine Learning and Knowledge Discovery in Databases, pages 3-19. Springer, 2017.
- [Hooi et al., 2018] Bryan Hooi, Hyun Ah Song, Amritan- shu Pandey, Marko Jereminov, Larry Pileggi, and Christos Faloutsos. Streamcast: Fast and online mining of power grid time sequences. In Proceedings of the 2018 SIAM In- ternational Conference on Data Mining, pages 531-539.
- [Kingma and Ba, 2014] Diederik P Kingma and Jimmy Ba. Adam: A method for stochastic optimization. arXiv preprint arXiv:1412.6980, 2014.
- [Kiranyaz et al., 2017] Serkan Kiranyaz, Turker Ince, and Moncef Gabbouj. Personalized monitoring and advance warning system for cardiac arrhythmias. Scientific Re- ports, 7(1):9270, 2017.
- [Le Guennec et al., 2016] Arthur Le Guennec, Simon Mali- nowski, and Romain Tavenard. Data augmentation for time series classification using convolutional neural net- works. In ECML/PKDD workshop on advanced analytics and learning on temporal data, 2016.
- [Li et al., 2009] Lei Li, James McCann, Nancy S Pollard, and Christos Faloutsos. Dynammo: Mining and summa- rization of coevolving sequences with missing values. In Proceedings of the 15th ACM SIGKDD international con- ference on Knowledge discovery and data mining, pages 507-516. ACM, 2009.
- [Matsubara et al., 2014] Yasuko Matsubara, Yasushi Saku- rai, and Christos Faloutsos. Autoplait: Automatic mining of co-evolving time sequences. In Proceedings of the 2014 ACM SIGMOD international conference on Management of data, pages 193-204. ACM, 2014.
- [Moody and Mark, 2001] George B Moody and Roger G Mark. The impact of the mit-bih arrhythmia database. IEEE Engineering in Medicine and Biology Magazine, 20(3):45-50, 2001.
- [Radford et al., 2015] Alec Radford, Luke Metz, and Soumith Chintala. Unsupervised representation learning with deep convolutional generative adversarial networks. arXiv preprint arXiv:1511.06434, 2015.
- [Rajpurkar et al., 2017] Pranav Rajpurkar, Awni Y Hannun, Masoumeh Haghpanahi, Codie Bourn, and Andrew Y Ng. Cardiologist-level arrhythmia detection with convolutional neural networks. arXiv preprint arXiv:1707.01836, 2017.
- [Schlegl et al., 2017] Thomas Schlegl, Philipp Seeböck, Se- bastian M Waldstein, Ursula Schmidt-Erfurth, and Georg Langs. Unsupervised anomaly detection with generative adversarial networks to guide marker discovery. In Inter- national Conference on Information Processing in Medi- cal Imaging, pages 146-157. Springer, 2017.
- [Schölkopf et al., 2000] Bernhard Schölkopf, Robert C Williamson, Alex J Smola, John Shawe-Taylor, and John C Platt. Support vector method for novelty detection. In Advances in neural information processing systems, pages 582-588, 2000.
- [Shah et al., 2014] Neil Shah, Alex Beutel, Brian Gallagher, and Christos Faloutsos. Spotting suspicious link behavior with fbox: An adversarial perspective. In Data Mining (ICDM), 2014 IEEE International Conference on, pages 959-964. IEEE, 2014.
- [Song et al., 2017] Hyun Ah Song, Bryan Hooi, Marko Jereminov, Amritanshu Pandey, Larry Pileggi, and Chris- tos Faloutsos. Powercast: Mining and forecasting power grid sequences. In Joint European Conference on Machine Learning and Knowledge Discovery in Databases, pages 606-621. Springer, 2017.
- [Vintsyuk, 1968] Taras K Vintsyuk. Speech discrimination by dynamic programming. Cybernetics and Systems Anal- ysis, 4(1):52-57, 1968.
References were extracted automatically from the PDF and may contain errors.
Full text extracted automatically from the PDF; figures, tables and equations may differ. The PDF is the version of record.
1 Introduction
How can we detect anomalous time series segments ('beats') in large-scale rhythmic time series data? A major application of this is for detecting cardiac arrhythmias, which cause millions of deaths annually around the world [Kiranyaz et al., 2017]. With the rapid growth in availability of medical sensor data such as ECG, blood pressure etc., anomaly detection in medical time series has become an increasingly important topic of research[Hagiwara et al., 2018]. More generally, anomalous time series segment detection is valuable for analyzing time series sensor data of many kinds: industrial, environmental, video, and so on. In particular, we use multivariate motion-capture data, collected from sensors worn by people, to detect unusual segments.
∗They are all from CAS Key Laboratory of Network Data Science and Technology and University of Chinese Academy of Sciences, Beijing, China
A key goal in this process is explainability: in medical and other domains, anomalies are best responded by domain experts who need to know not just whether an anomaly is present, but also understand its mechanism. This leads to the following questions:
How can we automatically detect anomalous beats when monitoring multivariate time series? Can we pinpoint the anomalous time ticks that led to our decision?
Further challenges are: 1) massive time series can contain few anomalies, which is insufficient and imbalanced for supervised classification; 2) anomalous segments can be very different from one another, e.g. some anomalous heartbeats are never seen in defined categories; 3) even in healthy patients, the time periods involved in various heartbeat characteristics (e.g. P waves, QRS complex, P-R and R-R intervals) vary from one beat to another.
Reconstruction-based anomaly detection generally uses implicit low-dimensional representations of data, e.g. in FBOX [Shah et al., 2014] via SVD decomposition. Autoencoders (AE) [An and Cho, 2015] allow for more complex patterns by applying nonlinear functions for reconstruction and anomaly detection. However, without proper regularization, such a reconstruction easily leads to overfitting, resulting in low accuracy. Generative adversarial networks (GANs) jointly learn to generate realistic synthetic data while learning a discriminator [Goodfellow et al., 2014]: we use this to provide an intuitive approach for regularizing the reconstruction error.
Therefore, we propose an anomaly detection model, BeatGAN, which detects anomalies using adversarially generated time series as shown in Fig 1. The model additionally provides explainable results, pinpointing the time ticks that led to our decision.
BeatGAN reconstructs the data robustly, and performs regularization using an adversarial generation approach. To further improve its accuracy, we exploit the characteristics of rhythmic time series by designing a warping method to augment training data in our proposed BeatGAN method. Experiments show that BeatGAN detects anomalies accurately in both ECG data from the MIT-BIH arrhythmia database, and sensor time series data from the CMU Motion Capture database.
In summary, our main contributions are as follows:
- Anomaly detection from normal time series: We propose BeatGAN, a reconstruction-based method using generative adversarial networks, for detecting anomalous time series. Taking advantage of adversarial regularization, BeatGAN is robust. Moreover, it uses time series warping for data augmentation to improve detection accuracy.
- Effectiveness: BeatGAN far outperforms existing stateof-the-art methods in identifying anomalies in ECG time series, achieving accuracy of nearly 0.95 AUC, and very fast inference (2.6 ms per beat).
- Explainability: BeatGAN pinpoints the time ticks involved in the anomalous patterns, providing interpretable output for visualization and attention routing (see Fig 1).
- Generality: BeatGAN successfully detects unusual motions from multivariate sensor time series from the CMU Motion Capture database.
Reproducibility: BeatGAN is open-sourced 1 .
2 RelatedWork
Time series mining and anomaly detection methods can be categorized into three categories.
Classification-based Methods
Supervised classification approaches require a large amount of labeled data, and either manually defined features or hidden variables learnt from deep models. Given enough labeled data, this method can achieve high accuracy [Rajpurkar et al., 2017]. However, the labeled data is usually difficult to obtain in practice. Furthermore, it has difficulty generalizing to anomalies which differ significantly from those it has seen, e.g. when new types of anomalies appear. Based on these defects, [Sch¨olkopf et al., 2000] proposed One-Class SVM, an unsupervised model which learns from normal data to identify anomalies on unseen data.
Vocabulary-based Methods
Vocabulary-based methods learn a set of models for time series segments, e.g. learning separate models for normal and abnormal heartbeats. Hidden Markov Models (HMMs) [Baum and Petrie, 1966] are classic vocabularybased method. Variants include DynaMMo [Li et al., 2009] which uses Dynamic Bayesian Networks, and AutoPlait [Matsubara et al., 2014] which uses two-level HMMs. Recent work [Hooi et al., 2017] proposed a vocabulary approach named BEATLEX which performs segmentation and forecasting by optimizing minimum description length. The rare patterns in the vocabulary are regarded as anomalies.
Reconstruction-based Methods
Anomalies can be defined as events that deviate significantly from the patterns observed in real data. Thus, many works detect anomalies by computing a synthetic reconstruction of the data, and then measuring the deviation between an observed instance and its reconstruction. Principal Component Analysis (PCA) can be used to reconstruct the data, but only allows for linear reconstruction. Autoencoders can also be used for deep-learning based anomaly detection by inspecting its reconstruction error. [An and Cho, 2015] used autoencoders (AE) and variational autoencoders (VAE) for anomaly detection on several benchmark datasets.
1 https://github.com/Vniex/BeatGAN
| PCA/SVD | OCSVM | AE | FBOX | AnoGAN | Ganomaly | BeatGAN | |
|---|---|---|---|---|---|---|---|
| Non-linear Explains anomalies Robust Fast inference | ✓ ✓ ✓ | ✓ ✓ | ✓ ✓ ✓ | ✓ ✓ | ✓ ✓ ✓ | ✓ ✓ ✓ | ✓ ✓ ✓ ✓ |
Recently, with the growing interest in generative adversarial networks, researchers have proposed anomaly detection using adversarial training. AnoGAN [Schlegl et al., 2017] and Ganomaly [Akcay et al., 2018] are both originally proposed for anomaly detection on visual data, while ours is designed for a series of real numbers which need robustness against speed variations. AnoGAN needs to learn a latent vector for every input for anomaly detection, which is very time consuming and limits its application. Ganomaly uses an encoder-decoder-encoder structure, and identify the anomalies by comparing the latent representations. Our BeatGAN uses data reconstructions, resulting in a more concise model and better performance for time series data. Meanwhile, BeatGAN can give explainable results with such a reconstruction.
Other approaches include [Song et al., 2017; Hooi et al., 2018; Chen et al., 2018], which proposed tensor decomposition based methods for time series forecasting and detecting anomalies based on the forecast. [Le Guennec et al., 2016] proposed a data augmentation method, 'window warping' for time series data.
BeatGAN provides an explainable approach combining autoencoders and generative adversarial networks, incorporating the advantages of both models. Table 1 summarizes existing works related to our problem. Only BeatGAN satisfies all the desired characteristics.
3 ProposedModel
Let T ∈ RM×N be a multivariate time series, which is N time ticks in length, and has M dimensions for each time tick, e.g. reading from M sources. A rhythmic time series T contains sub-series, i.e. beats. For example, a beat in ECG time series consists of a sequence of a P wave followed by a QRS complex, T and U waves. We fix the window size for a beat in time series, and beats are denoted as x ∈ RL×N , where L is large enough for containing a beat. Zero-padding or sampling can be used for fitting irregular beats in such a window if we know the exact length of each beat.
Most beats in time series are normal in practice, and the Input
28.6 million time ticks
Preprocessing
222,440 beats Training on normal beats BeatGAN
Figure 1: BeatGAN successfully detects anomalous rhythms, and explains the results. The size of training input is 28.6 million time ticks,
and inference can be as fast as 2.6 ms per beat. The original beat is shown by solid lines, and the generated beat is shown by dashed lines.
Method G(·)
R(G)
k
SVD/ FBOX ∑pk=1 σkukvT
AE
GD(GE(x))
/
VAE
GD(GE(x)) λDKL[Q(z|x)||P(z)]
BeatGAN GD(GE(x))
adversarial regularization
Table 2: Unifying the reconstruction-based methods for anomaly
detection. G(·) is the reconstruction function, R(G) is the regular-
ization loss
the i-th columns of U and V respectively obtained by sin-
gular value decomposition. FBOX uses the same reconstruc-
tion model as SVD, but uses a different anomalousness score
which applies a threshold based on percentiles of the recon-
structed distribution.
The AE- and VAE-based methods, and BeatGAN recon-
struct data using an encoder network GE(·) and decoder net-
work GD(·). While AE-based methods do not have any ex-
plicit regularization, VAE-based methods use the KL diver-
gence between the approximate posterior distribution Q(z|x)
learned by the encoder, and the prior distribution P(z) of the
latent variable z. Our BeatGAN uses adversarial regulariza-
tion in its training process.
We will show in the following how BeatGAN regularizes
its reconstruction, taking the benefits from generative adver-
sarial networks (GAN).
λ1 ∣∣∣∣I - U T U ∣∣∣∣2 +
λ2 ∣∣∣∣I - V T V ∣∣∣∣2
amount of beats is massive. Our anomaly detection problem
can then be described as follows:
Informal Problem 1 (Anomalous beat detection) Given a
collection of multivariate time series beats X = {xi, i =
1, 2, . . . , } with most of beats in the normal class,
- Detect anomalous beats x in a collection of unseen time
series,
- Such that they deviate significantly from the recon-
structed time series, and can pinpoint anomalous time
ticks in x for explanation.
3.1 General Framework
Fig 1 shows the framework of our proposed method. First,
we preprocess the ECG data and train the model with normal
heartbeats. At test time, for each unseen beat x, we feed it into
the trained model and obtain the generated beat x′ (showed by
dashed lines in Fig. 1). By comparing the residuals between
x and x′ , we capture the anomalies.
In general, the framework for detecting anomalies based on
reconstruction error has two components: reconstruction (or
generation) model optimization, and anomalousness scoring
based on reconstruction.
The optimization objective for learning the reconstruction
model is:
L = ||X - G(X)||2 + R(G)
= ∑
x
where X is a matrix concatenating each beat matrix x ∈ X
along its columns. G(·) is the reconstructed model, and R(G)
is the regularization term for different models (parameters).
Then, the anomalousness score for x is calculated as:
A(x) = ||x - G(x)||2
(2)
This framework is general in that many reconstruction-
based anomaly detection methods can be formalized as ob-
jective (1) for training, and use anomalousness score (2). As
we can see from Table 2, SVD, AE, VAE and our BeatGAN
for anomaly detection have their specific forms of reconstruc-
tion function G(·), and regularization loss R(G) for recon-
struction model optimization. The SVD-based methods re-
construct data using low-rank approximation. ui and vi are
||x - G(x)||2 + R(G)
Evaluation
Unseen beats Ventricular escape beat BeatGAN
0.95AUC
fast inference (2.6ms)
- ori
--- gen
- ori
--- gen abnormal normal
(1)
3.2 ProposedModel with Adversarial Regularization
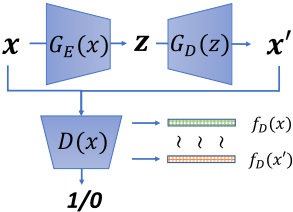
As illustrated in Fig 2, to reconstruct time series x, autoencoders have two components: an encoder GE(x) and a decoder GD(z). GE(x) encodes the input x to a hidden vector z that represents its important features. Then GD(z) generates a time series x′ from the hidden vector z. Thus our reconstruction is G(x) = GD(GE(x)).
As for both encoder and decoder networks, we use the same network structure, i.e. convolutional neural network (CNN) with filters sliding in one dimension along the temporal dimension. We use CNNs because many studies show that CNN networks are more robust than LSTMs for time series [Rajpurkar et al., 2017]. Moreover, with an appropriately-sized CNN reception field, we can also capture long-term dependencies as in LSTMs.
In terms of regularization, we use the GAN framework in our autoencoder. In such a framework, the generator and the discriminator compete in a two-player min-max game. The discriminator tries to distinguish real samples from synthesized samples and the generator tries to generate samples that can fool the discriminator. As we can see from the bottom part in Fig 2, the discriminator D(·) tries to maximize the loss function:
which discriminates the generated x′ from x as different class label 0 and 1. The generator G tries to minimize the following loss function
which makes the generation unable to be discriminated by D(·), i.e. close to class label 1.
In practice, directly using LG as adversarial regularization does not perform well due to the diminished gradient and mode collapse. Thus, instead of having the original x and vector z in hidden space, we have set up the relationship between the original x and reconstructed x′ via an autoencoder. Therefore, we use pairwise feature matching loss which minimizes differences of the statistics between original and generated time series, learned in hidden layers of the discriminator D(·). Letting fD(·) be the activation vector on a hidden layer of the discriminator, pairwise feature matching loss between x and x′ is:
Overall, the objective of reconstruction with adversarial regularization is to minimize the following loss function:
where x′ = G(x), and λ is the weighting parameter adjusting the impact of the adversarial regularization. Meanwhile, the objective of the discriminator is to maximize the following loss function:
Algorithm 1 Training algorithm
- 1: θG, θD← initialize network parameters
- 2: for number of training iterations do
- 3: Sample {x1, ..., xm} ∼ a batch from the normal data
- 4: Generate {x′1 , ..., x′m} by GE and GD
- 5: Compute LD by Eq (7)
- 6: θD ←- θD +α∇θD (LD) // ∇ is the gradient
- 7: Compute LG by Eq (6)
- 8: θG ←- θG +α∇θG (LG)
- 9: end for
Finally, we use the Adam optimization algorithm [Kingma and Ba, 2014] for learning the reconstruction model, as summarized in Alg 1.
To perform anomaly detection, we use the reconstruction model to reconstruct a time series x′ using our model trained on normal data, for given x. We then evaluate the anomalousness score by comparing the difference between x′ and x as in Eq (2). Since anomalies always occur in a portion of time ticks of a beat, the residuals between ticks of x and x′ can indicate where the anomaly occurs, routing users' attention to the anomalous portion and providing an explanation.
3.3 Data Augmentation Using TimeWarping
Time series have a special similarity metric, dynamic time warping (DTW) [Vintsyuk, 1968], which measures similarity in a way that is more robust against variations in speed (i.e. 'time warping'). For example, heartbeats naturally and slightly speed up or slow down. However, since DTW is not differentiable, we cannot directly use it for reconstruction error in objective (6). Instead, we propose a modified time warping for data augmentation to make our model robust against natural variability involving time warping in real time series.
We augment our training data as follows. For each training beat x, we sample uniformly at random a small number k of time ticks to "slow down" and a different k time ticks to "speed up". For each time tick to "speed up", we delete the data value at that time tick. For each time tick to "slow down", we insert a new data value just before that time tick, whose value is set to the average of the data values at the 2 adjacent time ticks. This results in a modified version of x, which we use as additional training data for our model.
4 Experiments
We design experiments to answer the following questions: Q1. Accuracy: How accurate is BeatGAN with/without data augmentation compared with state-of-the-art baselines? Q2. Explainability: How well does BeatGAN pinpoint anomalous portions of input, and route people's attention? Q3. Efficiency: How fast is BeatGAN's inference?
4.1 Data
We evaluate our proposed model on ECG time series from MIT-BIH Arrhythmia Database 2 [Moody and Mark, 2001].
2 https://physionet.org/cgi-bin/atm/ATM?database=mitdb
and motion capture data from the CMU motion capture database 3 .
MIT-BIH ECG dataset. The MIT-BIH arrhythmia dataset contains 48 ECG records from test subjects from Beth Israel Hospital. The ground-truth labels are annotated on the Rpeak of each beat by two or more independent cardiologists indicating positions and types of each heartbeat. As recommended by the AAMI [AAMI, 1998], the normal beats include the beats annotated with label N, L and R 4 , and the records named 102, 104, 107 and 218 are removed due to insufficient signal quality. In total, the dataset contains 97,568 beats, and 28.6 million time ticks.
CMU Motion Capture dataset. The dataset contains motion-captured subjects performing different motions (walking, jogging, running, etc.). We choose 4 dimensions from different sensors on the subject's body, i.e. left-right arms and legs. We select 16 walking records of 6,616 ticks in total, 10 jogging records of 1,608 ticks in total, and 1 jumping record of 2,085 ticks for training and testing separately. Thus we obtain 10,309 time ticks in total. In experiments, we normalize each time series x between -1 and 1 by min-max scaling. 5
4.2 Q1. Accuracy
BeatGAN gives the anomalousness score for each time series, i.e. S = {si : A(xi), xi ∈ Z} for a given evaluation set Z. To calculate metrics, we first standardize the scores between 0 and 1 by min-max scaling. Then we calculate the two metrics, AUC (Area Under ROC Curve) and AP (Average Precision) [Davis and Goadrich, 2006].
Evaluation on ECG Dataset
Experimental setup. We first use a filter [Carreiras et al., 2015 ] to remove the noise in ECG sequences. We choose 320 time ticks as the window size for a beat: 140 time ticks before the given R-peak and 180 ticks after it. We set the dimension size of latent space as 50, λ = 1.0 for objective (6)
3 http://mocap.cs.cmu.edu/
4 N is Normal beat, L is Left bundle branch block beat and R is Right bundle branch block beat
5 https://en.wikipedia.org/wiki/Feature scaling#Rescaling (min-max normalization)
and k = 16 for data augmentation. We also set an experiment of adding anomalous data to training data for evaluating robustness. The structure of GD learns the architecture of the generator from DCGAN [Radford et al., 2015]. We use 5 1D transposed convolutional layers followed by batch-norm and leaky ReLU activation, with slope of the leak set to 0.2. The transposed convolutional kernel's size and number of each layer are 512(10/1)-256(4/2)-128(4/2)-64(4/2)-32(4/2): e.g. 512(10/1) means that the number of filters is 512, the size of filter is 10 and the stride is 1. GE's structure is a mirrored version of GD and D has the same architectural details as GE. We use Adam optimizer with an initial learning rate lr = 0.0001, and momentums β1 = 0.5, β2 = 0.999. Moreover, we use 5-fold cross-validation for each method, and report the averaged metrics and standard deviations (std).
Result. We compare the performance with PCA-based anomaly detection, one-class SVM (OCSVM) for anomalous class (using the top 50 features selected by PCA method), autoencoders (AE), variational AE (VAE), AnoGAN, and Ganomaly as shown in Table 3. The averaged results and std are reported. The results show that both BeatGAN and BeatGAN with data augmentation perform the best among the baselines ( p-value<0.01), and the data augmentation does help BeatGAN achieve more accurate results due to the inclusion of additional training data. Besides, the non-linear methods (AE, VAE, AnoGAN, Ganomaly, and our BeatGANs) generally have better performance in both AUC and AP as compared to PCA and OCSVM, providing evidence that nonlinear models have advantages on the complex ECG time series.
Evaluation on Motion Capture Dataset
Experimental setup. In this experiment, walking is considered as our normal class. We evaluate BeatGAN on detecting unusual motions of jogging and jumping time series. We slide a window of 64 time ticks along the original multivariate time series to generate beats, and the stride size for the sliding window is 5 ticks. Thus we obtain 1,729 beats, with 10,309 time ticks in total, some of which overlap. Since the data is sparse and small, we concatenate the x ∈ R4×64 as a 256-dimensional vector as input. We use the same MLP structure with the sizes in layers as 256-128-32-10 for GE(·), 256-128-32-1 forD(·), and 10-32-128-256 for GD(·). The dimension size of latent space is 10 and λ = 0.01.
| Method | AUC | AP |
|---|---|---|
| PCA OCSVM AE VAE AnoGAN BeatGAN | 0.8164±0.0037 | 0.6522±0.0061 0.7588±0.0027 |
| 0.7917±0.0018 | ||
| 0.8944±0.0128 | 0.8415±0.0163 | |
| 0.8316±0.0025 | 0.7882±0.0024 | |
| 0.8642±0.0100 | 0.8035±0.0069 | |
| Ganomaly | 0.9083±0.0122 | 0.8701±0.0141 |
| 0.9447±0.0053 | 0.9108±0.0049 | |
| BeatGANaug | 0.9475±0.0037 | 0.9143±0.0047 |
| BeatGAN0.1% aug | 0.9425±0.0022 | 0.8973±0.0042 |
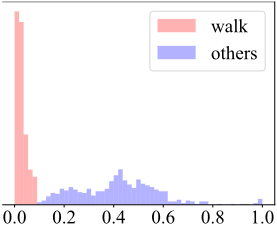
Result. Fig 4 shows the histogram of normalized anomalousness scores on evaluation data. The results show that the score distributions of walking and others are clearly separated. Hence the AUC and AP metrics both achieve 1.0, which means our BeatGAN can perfectly discriminate between unusual motions (jogging/jumping) and usual motions (walking), by only using time series of walking for training.
4.3 Q2. Explainability
Next, we show that BeatGAN can pinpoint the time ticks when the anomalous pattern occurs. In the right part of Fig 1, we compute the residual for each time tick between input beat and generated beat: res(t) = (x(t) - x′ (t))2 at time t , and show the heatmap of residual values. As we observe, our model gives high anomalousness scores for the abnormal beat (top right) and low anomalousness scores for the normal beat (bottom right). This abnormal beat is a 'ventricular escape beat' and our model correctly identifies that the abnormal time ticks occur in its QRS complex (circled region). Besides, our model generates the "normal" generated beat (dashed lines), which provides additional explainability by allowing users to compare the generated beat to the observed beat, to understand how the observed beat differs.
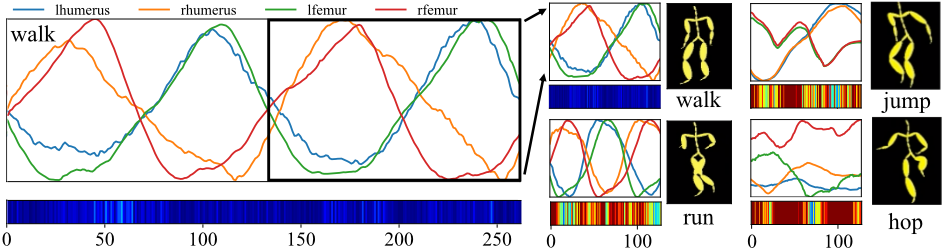
In Fig 3, the left time series is the record of walking. On the right, we illustrate the results of a jogging, jumping or hopping time series, using a heatmap whose color indicates the size of the residual at each time tick. We compute the residual for each time tick by res(t) = max(x(t) - x′ (t))2 , where x(t) is a 4-dimensional vector at time t, and max takes the max value over the 4 dimensions, which we use as the anomalousness score of time tick t. The heatmap shows that BeatGAN cannot well reconstruct the time series of jogging/jumping/hopping, thus correctly assigning them high anomalousness, since we only use walking time series for training.
4.4 Q3. Efficiency
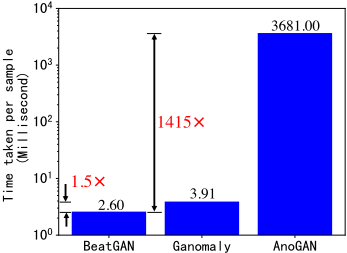
BeatGAN is fast for inference at test time, since the adversarial generation of BeatGAN is one-pass through the feedforward neural network. In contrast, the baseline AnoGAN needs iterative computation to find the corresponding latent vector for given time series, and Ganomaly has another encoder network which is more complex than BeatGAN.
We ran the inferences of BeatGAN, AnoGAN and Ganomaly, which use neural networks, on a server with a Tesla K80 GPU, on ECG data, all implemented in PyTorch. We set the iteration number of AnoGAN as 500 as in [Schlegl et al., 2017]. Fig 5 (the y-axis is a logarithmic scale) shows that BeatGAN only takes 2.6 ms per beat, which is 1.5× faster than Ganomaly and 1415× faster than AnoGAN.
5 Conclusions
We propose an anomaly detection algorithm for anomalous beats based on adversarially generated time series. BeatGAN has the following advantages: 1) Unsupervised: it is applicable even when labels are unavailable; 2) Effectiveness: BeatGAN outperforms baselines in both accuracy and inference speed, achieving accuracy of nearly 0.95 AUC on ECG data and very fast inference (2.6 ms per beat). 3) Explainability: BeatGAN pinpoints the anomalous ticks as shown in Fig 1; 4) Generality: BeatGAN also successfully detects unusual motions in multivariate motion-capture database.
Acknowledgments
This material is based upon work supported by the Strategic Priority Research Program of CAS (XDA19020400), NSF of China (61425016, 61772498, 91746301), and the Beijing NSF (4172059).
@inproceedings{ijcai2019p616,
  title     = {BeatGAN: Anomalous Rhythm Detection using Adversarially Generated Time Series},
  author    = {Zhou, Bin and Liu, Shenghua and Hooi, Bryan and Cheng, Xueqi and Ye, Jing},
  booktitle = {Proceedings of the Twenty-Eighth International Joint Conference on
               Artificial Intelligence, {IJCAI-19}},
  publisher = {International Joint Conferences on Artificial Intelligence Organization},
  editor    = {Sarit Kraus},
  pages     = {4433--4439},
  year      = {2019},
  month     = {8},
  note      = {Main track},
  doi       = {10.24963/ijcai.2019/616},
  url       = {https://doi.org/10.24963/ijcai.2019/616},
}
TY - CPAPER TI - BeatGAN: Anomalous Rhythm Detection using Adversarially Generated Time Series AU - Zhou, Bin AU - Liu, Shenghua AU - Hooi, Bryan AU - Cheng, Xueqi AU - Ye, Jing T2 - Proceedings of the Twenty-Eighth International Joint Conference on Artificial Intelligence, IJCAI-19 PB - International Joint Conferences on Artificial Intelligence Organization PY - 2019 SP - 4433 EP - 4439 DO - 10.24963/ijcai.2019/616 UR - https://doi.org/10.24963/ijcai.2019/616 ER -Copied
Machine-readable versions of this paper, for tools and AI agents:





