
Explainable Deep Neural Networks for Multivariate Time Series Predictions
Proceedings of the Twenty-Eighth International Joint Conference on Artificial Intelligence. Demos. Pages 6488-6490.
https://doi.org/10.24963/ijcai.2019/932
Keywords
- Applications: Energy
- AI: Knowledge Representation and Reasoning
- AI: Machine Learning
Abstract
We demonstrate that CNN deep neural networks can not only be used for making predictions based on multivariate time series data, but also for explaining these predictions.
This is important for a number of applications where predictions are the basis for decisions and actions. Hence, confidence in the prediction result is crucial.
We design a two stage convolutional neural network architecture which uses particular kernel sizes.
This allows us to utilise gradient based techniques for generating saliency maps for both the time dimension and the features.
These are then used for explaining which features during which time interval are responsible for a given prediction, as well as explaining during which time intervals was the joint contribution of all features most important for that prediction.
We demonstrate our approach for predicting the average energy production of photovoltaic power plants and for explaining these predictions.
- [Adebayo et al., 2018] Julius Adebayo, Justin Gilmer, Michael Muelly, Ian Goodfellow, Moritz Hardt, and Been Kim. Sanity checks for saliency maps. In Ad- vances in Neural Information Processing Systems, pages 9505-9515, 2018.
- [Ceci et al., 2017] Michelangelo Ceci, Roberto Corizzo, Fabio Fumarola, Donato Malerba, and Aleksandra Rashkovska. Predictive modeling of pv energy production: How to set up the learning task for a better prediction? IEEE Transactions on Industrial Informatics, 13(3):956- 966, 2017.
- [Fawaz et al., 2018] Hassan Ismail Fawaz, Germain Forestier, Jonathan Weber, Lhassane Idoumghar, and Pierre-Alain Muller. Deep learning for time series classification: a review. arXiv preprint arXiv:1809.04356, 2018.
- [Gilpin et al., 2018] Leilani H Gilpin, David Bau, Ben Z Yuan, Ayesha Bajwa, Michael Specter, and Lalana Ka- gal. Explaining explanations: An approach to evaluat- ing interpretability of machine learning. arXiv preprint arXiv:1806.00069, 2018.
- [LeCun et al., 1995] Yann LeCun, Yoshua Bengio, et al. Convolutional networks for images, speech, and time se- ries. The handbook of brain theory and neural networks, 3361(10):1995, 1995.
- [Lin et al., 2013] Min Lin, Qiang Chen, and Shuicheng Yan. Network in network. arXiv preprint arXiv:1312.4400, 2013.
- [Selvaraju et al., 2017] Ramprasaath R Selvaraju, Michael Cogswell, Abhishek Das, Ramakrishna Vedantam, Devi Parikh, and Dhruv Batra. Grad-cam: Visual explanations from deep networks via gradient-based localization. In 2017 IEEE International Conference on Computer Vision (ICCV), pages 618-626. IEEE, 2017.
- [Szegedy et al., 2015] Christian Szegedy, Wei Liu, Yangqing Jia, Pierre Sermanet, Scott Reed, Dragomir Anguelov, Dumitru Erhan, Vincent Vanhoucke, and Andrew Rabi- novich. Going deeper with convolutions. In Proceedings of the IEEE conference on computer vision and pattern recognition, pages 1-9, 2015.
- [Xing et al., 2010] Zhengzheng Xing, Jian Pei, and Eamonn Keogh. A brief survey on sequence classification. ACM Sigkdd Explorations Newsletter, 12(1):40-48, 2010.
- [Zheng et al., 2014] Yi Zheng, Qi Liu, Enhong Chen, Yong Ge, and J Leon Zhao. Time series classification using multi-channels deep convolutional neural networks. In In- ternational Conference on Web-Age Information Manage- ment, pages 298-310. Springer, 2014.
- [Zheng et al., 2016] Yi Zheng, Qi Liu, Enhong Chen, Yong Ge, and J Leon Zhao. Exploiting multi-channels deep convolutional neural networks for multivariate time series classification. Frontiers of Computer Science, 10(1):96- 112, 2016.
References were extracted automatically from the PDF and may contain errors.
Full text extracted automatically from the PDF; figures, tables and equations may differ. The PDF is the version of record.
1 Introduction
Multivariate time series data are being generated at an ever increasing pace due to ubiquity of sensors and the advancement of IoT technologies. Classifying these multivariate time series is crucial for utilising these data effectively, and is an important research topic in the machine learning community [Xing et al., 2010]. Deep neural networks such as convolutional neural networks (CNNs) [LeCun et al., 1995] are considered state-of-the-art for this task [Fawaz et al., 2018; Zheng et al., 2014; Zheng et al., 2016], this is mainly due to their ability to learn meaningful representations from the data without the need for manual feature engineering. However, these networks are considered as black box models, and suffer from lack of explainability such as understanding the reasons for the model's behaviour [Gilpin et al., 2018].
In this demonstration we present our method for achieving explainable deep neural network predictions that use multivariate time series data. Our explanations can be used for understanding which features during which time interval are responsible for a given prediction, as well as explaining during which time intervals was the joint contribution of all features most important for that prediction.
In order to achieve explainable predictions for both the time dimension and the features of the data, we develop a two stage CNN architecture. The first stage consists of a convolutional layer and utilises a 2D convolution with filter size k×1 which considers k time steps with 1 feature at a the time. This allows us to learn filters which are able to recognise important patterns that occur separately in the different features. This stage is followed by a 1 × 1 convolution [Lin et al., 2013] and is used in state-of-the-art networks such as in the inception module [Szegedy et al., 2015]. This allows us to reduce the number of features maps generated in the first stage down to 1. We do this because we would like to utilise a 1D convolution in the second stage of the architecture. The 1D convolution uses a filter size of k × n where n is the number of features. Using this 1D filter allows to extract important patterns that occur across all features.
It is important to note that by implementing this type of two stage network we preserve both the temporal and spatial dynamics of the multivariate time series throughout the whole network. This is essential since we will rely on gradient based approaches for generating saliency maps, also known as attribution maps, for extracting the attention of the network where it is deemed most relevant for its predictions for both: the time intervals and the features.
We specifically use grad-CAM [Selvaraju et al., 2017] which is considered one of the most successful methods for generating saliency maps [Adebayo et al., 2018]. We apply grad-CAM independently to the last layers of both stages which have produced fmaps = [f2d, f1d] number of feature maps respectively. For each activation unit u at each generic feature map A we obtain an importance weight wc associated to a specific class output c. This is done by computing the gradient of the output score yc with respect to A which is then globally averaged:wc = 1Z ∑u δyc δAu (1)
where Z is the total number of units in A. Note that in the 2D case the activation unit u is has 2D coordinates {i, j}.
We then use wc to compute a weighted combination between all the feature maps for class c. A ReLU is then used to remove the negative contributions as:
| Model | validation testing | Model | validation testing | ||
|---|---|---|---|---|---|
| Proposed net | 87% | 86% | 2D CNN | 84% | 83% |
| 1D CNN | 88% | 87% | MLP | 72% | 67% |
Lc1/2D is used to find the areas in the input data that have mainly contributed to the decision of the network for class c. Specifically, Lc2D will highlight the contribution of the features at different time intervals, while Lc1D will highlight the joint contribution of all features.
3 Predictions and Explanations
Recently, the increased presence of renewable energy sources has given rise to significant distributed power generation. It is therefore crucial to monitor the production and consumption of energy [Ceci et al., 2017]. In this work, we focus our attention on photovoltaic (PV) power plants and use the multivariate time series dataset from the multi-plant PV energy forecasting challenge. This is a multivariate time series where each time step represents an hourly aggregated observations, and each day is represented by 19 time steps (PV plants are active from 02:00 to 20:00). Each time step consists of 7 features related to weather conditions, and 2 features collected from sensors placed on the plants. We use these features to predict the average energy that will be generated over a period of 4 days ( 80 time steps) in kW. The average power output is bucketed into 6 classes, 0-50, 50-100, 100-150, 150-200, 200-250, and 250-300.
First, we report in Table 1 the classification accuracy for both validation and testing and compare the one of our proposed network architecture with 3 other benchmark deep learning models. The proposed model does not sacrifice accuracy. This is important since accuracy is usually sacrificed for explainability [Gilpin et al., 2018].
After computing the predictions, we are able to visualise the network's attention on time and features. Here, a high network attention is visualised in red, and a low attention in blue. Figure 1 shows an example where the network has successfully predicted the energy generation as belonging to class 0-50kW which is the lowest energy generation band. When investigating the explanations, we notice from c) that the network puts considerable attention on the PV plant irradiance feature where it is very low. The network also considers the weather temperature and the wind-speed at a time step where they are low. In b), which corresponds to the joint contribution of all features, the network shows more attention to the first half of the sample (representing two days), which seems to correspond to unfavourable weather conditions for PV energy generation. In another example shown in Figure 2 the network predicted the class 250-300 kW, the highest band for the PV plant under study. We notice that in c) the network's attention is more spread across features when compared to the previous example. However, it also focuses mainly on the spots where the plant irradiance and the plant temperature were high (around time intervals 35-40, 55-60, and 70-75).
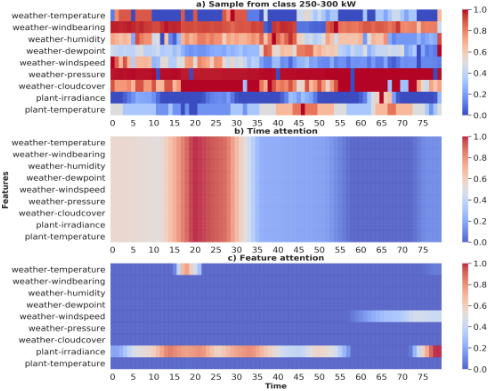
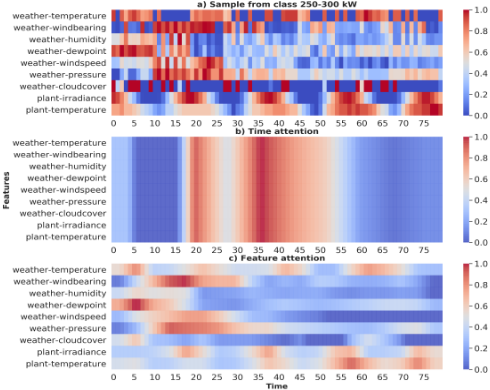
These results show that our proposed approach is able to visualise the network's attention over the time dimension and features of multivariate time series data, all while not hindering prediction performance. These explanations can be easily accessed via a web interface that shows both the classification probability of a multivariate time series and the explanations for the prediction of the class with the highest probability.
Acknowledgements
This work has received funding from the EU H2020 project ROMEO (grant agreement No. 745625), and from SERI (Swiss State Secretariat for Education, Research and Innovation). The dissemination of results herein reflects only the author's view and the European commission is not responsible for any use that may be made of the information it contains).
@inproceedings{ijcai2019p932,
  title     = {Explainable Deep Neural Networks for Multivariate Time Series Predictions},
  author    = {Assaf, Roy and Schumann, Anika},
  booktitle = {Proceedings of the Twenty-Eighth International Joint Conference on
               Artificial Intelligence, {IJCAI-19}},
  publisher = {International Joint Conferences on Artificial Intelligence Organization},
  editor    = {Sarit Kraus},
  pages     = {6488--6490},
  year      = {2019},
  month     = {8},
  note      = {Demos},
  doi       = {10.24963/ijcai.2019/932},
  url       = {https://doi.org/10.24963/ijcai.2019/932},
}
TY - CPAPER TI - Explainable Deep Neural Networks for Multivariate Time Series Predictions AU - Assaf, Roy AU - Schumann, Anika T2 - Proceedings of the Twenty-Eighth International Joint Conference on Artificial Intelligence, IJCAI-19 PB - International Joint Conferences on Artificial Intelligence Organization PY - 2019 SP - 6488 EP - 6490 DO - 10.24963/ijcai.2019/932 UR - https://doi.org/10.24963/ijcai.2019/932 ER -Copied
Machine-readable versions of this paper, for tools and AI agents:





