
Topological Uncertainty: Monitoring Trained Neural Networks through Persistence of Activation Graphs
Proceedings of the Thirtieth International Joint Conference on Artificial Intelligence. Main Track. Pages 2666-2672.
https://doi.org/10.24963/ijcai.2021/367
Keywords
- Machine Learning: Deep Learning
- Uncertainty in AI: Uncertainty Representations
Abstract
Although neural networks are capable of reaching astonishing performance on a wide variety of contexts, properly training networks on complicated tasks requires expertise and can be expensive from a computational perspective. In industrial applications, data coming from an open-world setting might widely differ from the benchmark datasets on which a network was trained. Being able to monitor the presence of such variations without retraining the network is of crucial importance.
In this paper, we develop a method to monitor trained neural networks based on the topological properties of their activation graphs. To each new observation, we assign a Topological Uncertainty, a score that aims to assess the reliability of the predictions by investigating the whole network instead of its final layer only as typically done by practitioners. Our approach entirely works at a post-training level and does not require any assumption on the network architecture, optimization scheme, nor the use of data augmentation or auxiliary datasets; and can be faithfully applied on a large range of network architectures and data types. We showcase experimentally the potential of Topological Uncertainty in the context of trained network selection, Out-Of-Distribution detection, and shift-detection, both on synthetic and real datasets of images and graphs.
- [Akhtar and Mian, 2018] Naveed Akhtar and Ajmal Mian. Threat of adversarial attacks on deep learning in computer vision: A survey. IEEE Access, 6:14410-14430, 2018.
- [Atzmon et al., 2019] Matan Atzmon, Niv Haim, Lior Yariv, Ofer Israelov, Haggai Maron, and Yaron Lipman. Con- trolling neural level sets. In NeurIPS, pages 2034-2043, 2019.
- [Biggio and Roli, 2018] Battista Biggio and Fabio Roli. Wild patterns: Ten years after the rise of adversarial ma- chine learning. Pattern Recognition, 84:317-331, 2018.
- [Carlsson and Gabrielsson, 2020] Gunnar Carlsson and Rickard Brüel Gabrielsson. Topological approaches to deep learning. In Topological Data Analysis, pages 119-146. Springer, 2020.
- [Carrière et al., 2020] Mathieu Carrière, Frédéric Chazal, Yuichi Ike, Théo Lacombe, Martin Royer, and Yuhei Umeda. Perslay: a neural network layer for persistence diagrams and new graph topological signatures. In AIS- TATS, pages 2786-2796. PMLR, 2020.
- [Chen et al., 2020] Jiefeng Chen, Yixuan Li, Xi Wu, Yingyu Liang, and Somesh Jha. Robust out-of-distribution de- tection via informative outlier mining. arXiv preprint arXiv:2006.15207, 2020.
- [DeVries and Taylor, 2018] Terrance DeVries and Gra- ham W Taylor. Learning confidence for out-of- distribution detection in neural networks. arXiv preprint arXiv:1802.04865, 2018.
- [Gebhart and Schrater, 2017] Thomas Gebhart and Paul Schrater. Adversary detection in neural networks via per- sistent homology. arXiv preprint arXiv:1711.10056, 2017.
- [Gebhart et al., 2019] Thomas Gebhart, Paul Schrater, and Alan Hylton. Characterizing the shape of activation space in deep neural networks. In 2019 18th IEEE ICMLA, pages 1537-1542. IEEE, 2019.
- [Guo et al., 2017] Chuan Guo, Geoff Pleiss, Yu Sun, and Kilian Q Weinberger. On calibration of modern neural net- works. In ICML, pages 1321-1330, 2017.
- [Guss and Salakhutdinov, 2018] William H Guss and Ruslan Salakhutdinov. On characterizing the capacity of neu- ral networks using algebraic topology. arXiv preprint arXiv:1802.04443, 2018.
- [Hein et al., 2019] Matthias Hein, Maksym An- driushchenko, and Julian Bitterwolf. Why relu networks yield high-confidence predictions far away from the train- ing data and how to mitigate the problem. In Proceedings of the IEEE Conference on Computer Vision and Pattern Recognition, pages 41-50, 2019.
- [Hendrycks and Dietterich, 2019] Dan Hendrycks and Thomas Dietterich. Benchmarking neural network ro- bustness to common corruptions and perturbations. arXiv preprint arXiv:1903.12261, 2019.
- [Hendrycks and Gimpel, 2017] Dan Hendrycks and Kevin Gimpel. A baseline for detecting misclassified and out- of-distribution examples in neural networks. ICLR, 2017. [Hendrycks et al., 2019] Dan Hendrycks, Mantas Mazeika, and Thomas Dietterich. Deep anomaly detection with out- lier exposure. ICLR, 2019.
- [Kerber et al., 2017] Michael Kerber, Dmitriy Morozov, and Arnur Nigmetov. Geometry helps to compare persistence diagrams. Journal of Experimental Algorithmics (JEA), 22:1-20, 2017.
- [Kumar et al., 2020] Abhishek Kumar, Benjamin Finley, Tristan Braud, Sasu Tarkoma, and Pan Hui. Marketplace for ai models. arXiv preprint arXiv:2003.01593, 2020.
- [Lakshminarayanan et al., 2017] Balaji Lakshminarayanan, Alexander Pritzel, and Charles Blundell. Simple and scal- able predictive uncertainty estimation using deep ensem- bles. NeurIPS, 30:6402-6413, 2017.
- [Nguyen et al., 2015] Anh Nguyen, Jason Yosinski, and Jeff Clune. Deep neural networks are easily fooled: High con- fidence predictions for unrecognizable images. In Pro- ceedings of the IEEE conference on computer vision and pattern recognition, pages 427-436, 2015.
- [Ovadia et al., 2019] Yaniv Ovadia, Emily Fertig, Jie Ren, Zachary Nado, David Sculley, Sebastian Nowozin, Joshua Dillon, Balaji Lakshminarayanan, and Jasper Snoek. Can you trust your model's uncertainty? evaluating predictive uncertainty under dataset shift. In NeurIPS, pages 13991- 14002, 2019.
- [Ramamurthy et al., 2019] Karthikeyan Natesan Rama- murthy, Kush Varshney, and Krishnan Mody. Topological data analysis of decision boundaries with application to model selection. In ICML, pages 5351-5360. PMLR, 2019.
- [Rieck et al., 2019] Bastian Alexander Rieck, Matteo Togni- nalli, Christian Bock, Michael Moor, Max Horn, Thomas Gumbsch, and Karsten Borgwardt. Neural persistence: A complexity measure for deep neural networks using alge- braic topology. In ICLR. OpenReview, 2019.
- [Shorten and Khoshgoftaar, 2019] Connor Shorten and Taghi M Khoshgoftaar. A survey on image data augmen- tation for deep learning. Journal of Big Data, 6(1):60, 2019.
- [Torralba et al., 2008] Antonio Torralba, Rob Fergus, and William T Freeman. 80 million tiny images: A large data set for nonparametric object and scene recognition. IEEE transactions on pattern analysis and machine intelligence, 30(11):1958-1970, 2008.
- [Turner et al., 2014] Katharine Turner, Yuriy Mileyko, Sayan Mukherjee, and John Harer. Fréchet means for distributions of persistence diagrams. Discrete & Computational Geometry, 52(1):44-70, 2014.
- [Van Amersfoort et al., 2020] Joost Van Amersfoort, Lewis Smith, Yee Whye Teh, and Yarin Gal. Uncertainty estima- tion using a single deep deterministic neural network. In ICML, volume 119 of Proceedings of Machine Learning Research, pages 9690-9700. PMLR, 13-18 Jul 2020.
References were extracted automatically from the PDF and may contain errors.
Full text extracted automatically from the PDF; figures, tables and equations may differ. The PDF is the version of record.
1 Introduction
Over the last decade, Deep Learning (DL) has become the most popular approach to tackle complex machine learning tasks, opening the door to a broad range of industrial applications. Despite its undeniable strengths, monitoring the behavior of deep Neural Networks (NN) in real-life applications can be challenging. The more complex the architectures become, the stronger the predictive strengths of the networks, but the looser our grasp on their behaviors and weaknesses.
∗Contact Author
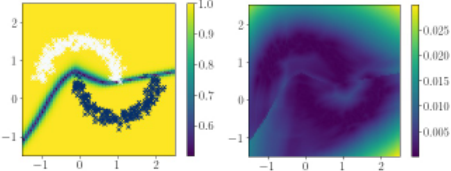
Training a neural network requires task-specific expertise, is time consuming, and requires the use of high-end expensive hardware. With the rise of companies providing model marketplaces (e.g., [Kumar et al., 2020, Table 1] or tensorflow-hub), it is now common that users only have access to fixed trained neural networks, with few information on the training process, and would rather avoid training the networks again.
In practice, a network can perform well on a given learning problem-in the sense that it can achieve high accuracy on the training and test sets-, but lack reliability when used in real-life applications thereafter. One can think of, among other examples, adversarial attacks, that are misinterpreted by neural networks with high confidence levels [Nguyen et al., 2015; Akhtar and Mian, 2018; Biggio and Roli, 2018], calibration issues leading to under- or overconfident predictions [Guo et al., 2017; Ovadia et al., 2019; Hein et al., 2019], lack of robustness to corruption or perturbation of the input data [Hendrycks and Dietterich, 2019].
Related Work
Many techniques have been proposed to improve or monitor the behavior of NN deployed in real-life applications. Most require specific actions taken during the training phase of the network; for instance via data augmentation [Shorten and Khoshgoftaar, 2019]), the use of large auxiliary datasets 1 [Hendrycks et al., 2019], modifications of the network architecture [DeVries and Taylor, 2018] or its objective function [Atzmon et al., 2019; Van Amersfoort et al., 2020], or using several networks at once to produce predictions [Lakshminarayanan et al., 2017]. The approach we introduce in this article focuses on acting at a post-training level only, and since our goal is to benchmark it against the use of confidence alone in a similar setting, we use, in our experimental results, the baseline introduced in [Hendrycks and Gimpel, 2017], which proposes to monitor NNs based on their confidences and on the idea that low-confidence predictions may account for anomalies.
Using topological quantities to investigate NN properties has experienced a growth of interest recently (see for instance [Guss and Salakhutdinov, 2018; Carlsson and Gabrielsson, 2020]). In [Gebhart and Schrater, 2017; Gebhart et al., 2019], the authors introduce the notion of activation graphs and showcase their use in the context of adversarial attacks. We mix this idea with [Rieck et al., 2019], which proposes to investigate topological properties of NN layer-wise 2 . A topological score based on an estimation of the NN decision boundary has been proposed in [Ramamurthy et al., 2019] to perform trained network selection, an idea we adapt in Subsection 4.1.
Contributions
In this work, we propose a new approach to monitor trained NNs by leveraging the topological properties of activation graphs. Our main goal is to showcase the potential benefits of investigating network predictions through the lens of the whole network instead of looking at its confidence encoded by its final layer only as usually done in practice.
To that aim, we introduce Topological Uncertainty (TU), a simple topological quantity that, for a given NN and a new observation, encodes how the network "reacts" to this observation, and whether this reaction is similar to the one on training data. Our approach does not require any assumption on the network training phase nor the type of input data, and can thus be deployed in a wide variety of settings. Furthermore, it only relies on computating maximum spanning trees (MST), leading to a simple and efficient implementation.
Experimentally, we show that TU can be used to monitor trained NNs and detect Out-of-Distribution (OOD) or shifted samples when deployed in real-life applications. Our results suggest that TU can drastically improve on a standard baseline based on the network confidence in different situations. Our implementation will be incorporated in the Gudhi library 3 .
1 In particular, the 80 million tiny images dataset [Torralba et al., 2008], used as an auxiliary dataset in state-of-the-art OOD detection techniques [Chen et al., 2020], has been withdrawn for ethical concerns. This situation illustrates unexpected limitations when relying on such datasets to calibrate neural networks.
2 A detailed comparison is deferred to the supplementary material 3 https://gudhi.inria.fr/
2 Background
2.1 Neural Networks
For the sake of clarity, we restrict our presentation to sequential neural networks, although our approach (detailed in Section 3) can be generalized to more general architectures, e.g., recurrent neural networks. We also restrict to classification tasks; let d denote the dimension of the input space and K be the number of classes. A (sequential) neural network (NN) learns a function F : Rd → RK that can be written as F = fL ◦ · · · ◦ f1, where the (fℓ)Lℓ=1 are elementary blocks defined for ℓ = 1, . . . , L - 1 as
with Wℓ ∈ Rdℓ×dℓ+1 , bℓ ∈ Rdℓ+1 , and (σℓ)ℓ are activation maps 4 , e.g., σℓ = ReLU: x ↦→ max{x, 0}. In classification tasks, the final activation fL = σL is usually taken to be the soft-max function, so that the output xL = F(x) can be understood as a probability distribution on {1, . . . , K} whose entries (F(x)k)k indicate the likelihood that x belongs to class k. The predicted class is thus argmaxk{F(x)k}, while the confidence that the network has in its prediction is maxk{F(x)k} ∈ [0, 1]. Given a training set of observations and labels (Xtrain , Y train ) = (xi, yi)Ntrain i=1 distributed according to some (unknown) joint law (X, Y), the network parameters Wℓ, bℓ are optimized to minimize the loss ∑ L(F(xi), yi) for some loss function L (e.g., the categorical cross-entropy). The (training) accuracy of F is defined as 1 Ntrain ∑Ntrain i=1 1argmax(F(xi))=yi .
2.2 Activation Graphs and Topological Descriptors
Activation graphs. Let us consider a neural network F and two layers of size dℓ and dℓ+1 respectively, connected by a matrix Wℓ ∈ Rdℓ×dℓ+1 . One can build a bipartite graph Gℓ whose vertex set is Vℓ ⊔ Vℓ+1 with |Vℓ| = dℓ and |Vℓ+1| = dℓ+1, and edge set is Eℓ = Vℓ × Vℓ+1. Following [Gebhart et al., 2019], given an instance x ∈ Rd , one can associate to each edge (i, j) ∈ Eℓ the weight |Wℓ(i, j) · xℓ(i)|, where xℓ(i) (resp. Wℓ(i, j)) denotes the i-th coordinate of xℓ ∈ Rdℓ (resp. entry (i, j) of Wℓ ∈ Rdℓ×dℓ+1 ). Intuitively, the quantity |Wℓ(i, j) · xℓ(i)| encodes how much the observation x "activates" the connection between the i-th unit of the ℓ-th layer and the j-th unit of the (ℓ+1)-th layer of F. In this way, we obtain a sequence of bipartite graphs (Gℓ(x, F))ℓ called the activation graphs of the pair (x, F ), whose vertices are Vℓ ⊔ Vℓ+1 and edges weights are given by the aforementioned formula.
Maximum spanning trees and persistence diagrams. To summarize the information contained in these possibly large graphs in a quantitative way, we rely on topological descriptors called persistence diagrams, coming from the Topological Data Analysis (TDA) literature. A formal introduction to TDA is not required in this work (we refer to the supplementary material for a more general introduction): in our specific case, persistence diagrams can be directly defined as the distribution of weights of a maximum spanning tree (MST). We recall that given a connected graph G with N + 1 vertices, a MST is a connected acyclic sub-graph of G sharing the same set of vertices such that the sum of the N edge weights is maximal among such sub-graphs. MST can be computed efficiently, namely in quasilinear time with respect to the number of edges in G. Given the ordered weights w1 ≥ · · · ≥ wN of a MST built on top of a graph G, its persistence diagram is the one-dimensional probability distribution
4 Note that this formalism encompasses both fully-connected and convolutional layers that are routinely used by practitioners.
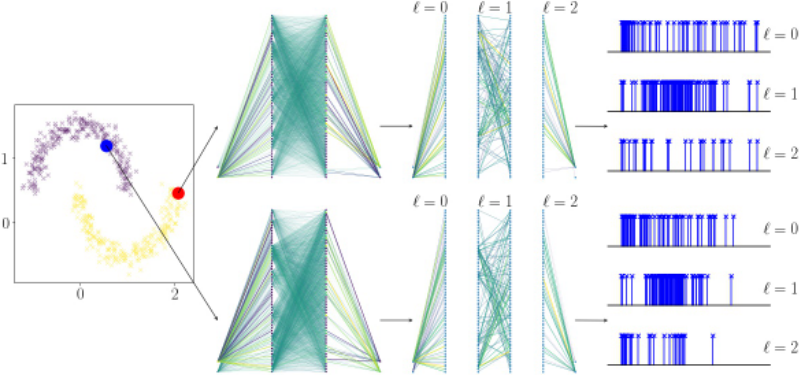
where δwi denotes the Dirac mass at wi ∈ R. See Figure 2 for an illustration.
Comparing and averaging persistence diagrams. The standard way to compare persistence diagrams relies on optimal partial matching metrics. The choice of such metrics is motivated by stability theorems that, in our context, imply that the map x ↦→ µ(Gℓ(x, F)) is Lipschitz with Lipschitz constant that only depends on the network architecture and weights 5 (and not on properties of the distribution of x ∼ X for instance). The computation of these metrics is in general challenging [Kerber et al., 2017]. However, in our specific setting, the distance Dist(µ, ν) between two diagrams µ = 1N ∑Ni=1 δwi and ν = 1N ∑Nj=1 δw′j can be simply obtained by computing a 1D-optimal matching 5 , which in turn only requires to match points in increasing order, leading to the simple formula
where w1 ≥ w2 ≥ · · · ≥ wN and w′1 ≥ w′2 ≥ · · · ≥ w′N . With this metric comes a notion of average persistence diagram, called a Fr´echet mean [Turner et al., 2014]: a Fr´echet mean µ of a set of M diagrams µ1, . . . , µM is a minimizer of ν ↦→ ∑Mm=1 Dist(µm, ν)2 , which in our context simply reads
where ¯wi = 1M ∑Mm=1 w(m) i and w(m) i denotes the i-th point of µm. The Fr´echet mean provides a geometric way to concisely summarize the information contained in a set of persistence diagrams.
3 Topological Uncertainty (TU)
Building on the material introduced in Section 2, we propose the following pipeline, which is summarized in Figure 2. Given a trained network F : Rd → RK and an observation x, we build a sequence of activation graphs G1(x, F), . . . ,GL-1(x, F). We then compute a MST of each Gℓ(x, F), which in turn induces a persistence diagram Dℓ(x, F) := µ(Gℓ(x, F)). Assuming F was trained on a set Xtrain , one can store the corresponding sequence of diagrams (Dℓ(xtrain , F))ℓ for each xtrain ∈ Xtrain . These diagrams summarize how the network is activated by the training data. Thus, given a new observation x with argmax(F(x)) = k, one can compute the sequence (Dℓ(x, F))ℓ and then the quantity
5 We refer to the supplementary material for details and proofs.
that is, comparing Dℓ(x, F ) to the diagrams of training observations that share the same predicted label than x. Figure 1 (right) shows how this quantity evolves over the plane, and how, contrary to the network confidence (left), it allows one to detect instances that are far away from the training distribution.
Since storing the whole set of training diagrams for each class and each layer {Dℓ(xtrain , F) : argmax(F(xtrain )) = k} might be inefficient in practice, we propose to summarize these sets through their respective Fr´echet means Dtrain ℓ,k . For a new observation x ∈ Rd , let k(x) = arg max(F (x)) be its predicted class, and (Dℓ(x, F ))ℓ the corresponding persistence diagrams. The Topological Uncertainty of x is defined to be
which is the average distance over layers between the persistence diagrams of the activation graphs of (x, F) and the average diagrams stored from the training set. Having a low TU suggests that x activates the network F in a similar way to the points in Xtrain whose class predicted by F was the same as x. Conversely, an observation with a high TU (although being possibly classified with a high confidence) is likely to account for an OOD sample as it activates the network in an unusual manner.
Remarks. Our definition of activation graphs differs from the one introduced in [Gebhart et al., 2019], as we build one activation graph for each layer, instead of a single, possibly very large, graph on the whole network. Note also that the definition of TU can be declined in a variety of ways. First, one does not necessarily need to work with all layers 1 ≤ ℓ ≤ L, but can only consider a subset of those. Similarly, one can estimate Fr´echet means Dtrain ℓ,k using only a subset of the training data. These techniques might be of interest when dealing with large datasets and deep networks. One could also replace the Fr´echet mean Dtrain ℓ,k by some other diagram of interest; in particular, using the empty diagram instead allows us to retrieve a quantity analog to the Neural persistence introduced in [Rieck et al., 2019]. On an other note, there are other methods to build persistence diagrams on top of activation graphs that may lead to richer topological descriptors, but our construction has the advantage of returning diagrams supported on the real line (instead of the plane as it usually occurs in TDA) with fixed number of points, which dramatically simplifies the computation of distances and Fr´echet means, and makes the process efficient practically.
4 Experiments
This section showcases the use of TU in different contexts: trained network selection (§4.1), monitoring of trained networks that achieve large train and test accuracies but have not been tweaked to be robust to Out-Of-Distribution observations (§4.2) or distribution shift (§4.3).
Datasets and experimental setting. We use standard, publicly available, datasets of graphs and images. MNIST, Fashion-MNIST, CIFAR-10, SVHN, DTD are datasets of images, while MUTAG and COX2 are datasets of graphs coming from a chemical framework. We also build two OOD image datasets, Gaussian and Uniform, by randomly sampling pixel values following a Gaussian distribution (resp. uniform on the unit cube). A detailed report of datasets and experimental settings (data preprocessing, network architectures and training parameters, etc.) can be found in the supplementary material.
4.1 Trained Network Selection for Unlabeled Data
In this subsection, we showcase our method in the context of trained network selection through an experiment proposed in [Ramamurthy et al., 2019, §4.3.2]. Given a dataset with 10 classes (here, MNIST or Fashion-MNIST), we train 45 NNs on the binary classification problems i vs. j for each pair of classes (i, j) with i > j, and store the average persistence diagrams of the activation graphs for the different layers and classes as explained in Section 3. These networks are denoted by Fij in the following, and consistently reach high accuracies on their respective training and test sets given the simplicity of the considered tasks. Then, for each pair of classes k1 > k2, we sample a set of new observations Xk1,k2 made of 200 instances sampled from the test set of the initial dataset (in particular, these observations have not been seen during the training of any of the (Fij)ij) whose labels are k1 and k2. Assume now that k1, k2 and the labels of our new observations are unknown. The goal is to select a network that is likely to perform well on Xk1,k2 among the (Fij)ij. To that aim, we compute a score for each pairing (k1, k2) ↔ (i, j), which is defined as the average TU (see Eq. (1)) when feeding Fij with Xk1,k2 . A low score between (i, j) and (k1, k2) suggests that Xk1,k2 activates Fij in a "known" way, thus that Fij is likely to be a relevant classifier for Xk1,k2 , while a high score suggests that the data in Xk1,k2 is likely to be different from the one on which Fi,j was trained, making it a less relevant choice. Figure 3 plots the couple (scores, accuracies) obtained on MNIST when taking (k1, k2) = (1, 0), that is, we feed networks that have been trained to classify between i and j handwritten digits with images representing 0 and 1 digits. Not surprisingly, F1,0 achieves both a small TU (thus would be selected by our method) and a high accuracy. On the other hand, using the model F7,6 on X1,0 leads to the highest score and a low accuracy.
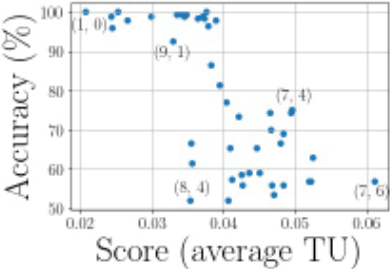
To quantitatively evaluate the benefit of using our score to select a model, we use the the metric proposed by [Ramamurthy et al., 2019]: the difference between the mean accuracy obtained using the 5 models that have the lowest scores and the 5 models that have the highest scores. We obtain a +14.8%-increase on MNIST and a +12.6%-increase on Fashion-MNIST. These positive values indicate that, on average, using low TU as a criterion helps to select a better model to classify our new set of observations. As a comparison, using the average network confidence as a score leads to +6.6% on MNIST and +4.7% on Fashion-MNIST, indicating that using (high) confidence to select a model would be less relevant than using TU, on average. See the supplementary material for a complementary discussion.
Remark. Our setting differs from the one of [Ramamurthy et al., 2019]: in the latter work, the method requires to have access to true labels on the set of new observations Xk1,k2 (which we do not), but do not need to evaluate Fij(x), x ∈ Xk1,k2 on each model Fij (which we do). To that respect, we stress the complementary aspect of both methods.
4.2 Detection of Out-Of-Distribution Samples
The following experiment illustrates the behavior of TU when a trained network faces Out-Of-Distribution (OOD) observations, that is, observations that are not distributed according to the training distribution. To demonstrate the flexibility of our approach, we present the experiment in the context of graph classification, relying on the COX2 and the MUTAG graph datasets. Complementary results on image datasets can be found in Table 1 and in the supplementary material. Working with these datasets is motivated by the possibility of using simple networks while achieving reasonably high accuracies which are near state-of-the-art on these sets. To train and evaluate our networks, we extract 40 spectral features from graphs-thus representing a graph by a vector in R40following a procedure proposed in [Carri`ere et al., 2020]. See the supplementary material for details.
For both datasets, we build a set of 100 fake graphs in the following way. Let N and M be the distributions of number of vertices and number of edges respectively in a given dataset (e.g., graphs in MUTAG have on average 17.9 ± 4.6 vertices and 19.8 ± 5.7 edges). Fake graphs are sampled as Erd˝os-Renyi graphs of parameters (n,m/n2 ), with n ∼ N, m ∼M, thus by construction fake graphs have (on average) the same number of vertices and edges as graphs from the training dataset. These sets are referred to as Fake-MUTAG and Fake-COX2, respectively.
Now, given a network FMUTAG trained on MUTAG (resp. FCOX2 trained on COX2), we store the average persistence diagrams of each classes. It allows us to compute the corresponding distribution of TUs T train = {TU(x, FMUTAG) : x ∈ MUTAG} (resp. TU(x, FCOX2)). Similarly, we evaluate the TUs of graphs from the Fake-MUTAG (resp. Fake-COX2) and from COX2 (resp. MUTAG), see Figure 4 ((a,c), respectively). As expected, the TUs of training inputs T train are concentrated around low values. Conversely, the TUs of OOD graphs (both from the Fake dataset and the second graph dataset) are significantly higher. Despite important differences in terms of TU, the network still shows confidence near 100% ((b,d) plots) for OOD datasets, making this quantity impractical for detecting OOD samples.
| Baseline | Topological Uncertainty | ||||
|---|---|---|---|---|---|
| Training data | OOD data | FPR ↓ | AUC ↑ | FPR ↓ | AUC ↑ |
| MUTAG | Fake-MUTAG | 98.4 | 1.7 | 0.0 | 99.8 |
| COX2 | 93.0 | 31 | 0.0 | 100.0 | |
| COX2 | Fake-COX2 | 91.2 | 1.4 | 0.0 | 99.9 |
| MUTAG | 91.2 | 1.1 | 0.0 | 100.0 | |
| CIFAR-10 | FMNIST | 93.6 | 54.9 | 65.6 | 86.4 |
| MNIST | 94.7 | 58.3 | 25.4 | 94.7 | |
| SVHN | 90.6 | 27.6 | 83.6 | 65.8 | |
| DTD | 90.9 | 32.6 | 90.3 | 57.3 | |
| Uniform | 91.5 | 31.8 | 59.1 | 80.2 | |
| Gaussian | 91.0 | 27.2 | 18.8 | 88.2 | |
To quantify this intuition, we propose a simple OOD detector. Let F be a network trained on MUTAG or COX2, with distribution of training TUs T train . A new observation x is classified as an OOD sample if TU(x, F) is larger than the qth quantile of T train . This classifier can be evaluated with standard metrics used in OOD detection experiments: the False Positive Rate at 95% of True Positive Rate (FPR at 95%TPR), and the Area Under the ROC Curve (AUC). We compare our approach with the baseline introduced in [Hendrycks and Gimpel, 2017] based on confidence only: a point is classified as an OOD sample if its confidence is lower than the q-th quantile of the distribution of confidences of training samples. As recorded in Table 1, this baseline performs poorly on these graph datasets, which is explained by the fact that (perhaps surprisingly) the assumption of loc. cit. that training samples tend to be assigned a larger confidence than OODones is not satisfied in this experiment. In the third row of this Table, we provide similar results for a network trained on CIFAR-10 using other image datasets as OOD sets. Although in this setting TU is not as efficient as it is on graph datasets, it still improves on the baseline reliably.
4.3 Sensitivity to Shifts in Sample Distribution
This last experimental subsection is dedicated to distribution shift. Distribution shifts share similar ideas with OODdetection, in the sense that the network will be confronted to samples that are not following the training distribution. However, the difference lies in the fact that these new observations are shifted instances of observations that would be sampled with respect to the training distribution. In particular, shifted instances still have an underlying label that one may hope to recover. Formally, given a training distribution X and a parametric family of shifts (sγ)γ with the convention that s0 = id, a shifted sample with level of shift γ is a sample sγ(x1), . . . , sγ(xN), where x1, . . . , xN ∼ X with underlying labels y1, . . . , yN. For instance, given an image, one can apply a corruption shift of parameter γ = n ∈ N where sn(x) consists of randomly switching n pixels of the image x (xij ↦→ 1 - xij). See the top row of Figure 5.
Ideally, one would hope a trained network F to be robust to shifts, that is argmax(F(x)) = argmax(F(sγ(x))). However, since the map x ↦→ sγ(x) cannot be inverted in general, one cannot realistically expect robustness to hold for high levels of shift. Here, we illustrate how TU can be used as a way to monitor the presence of shifts that would lead to a dramatic diminution of the network accuracy in situations where the network confidence would be helpless.

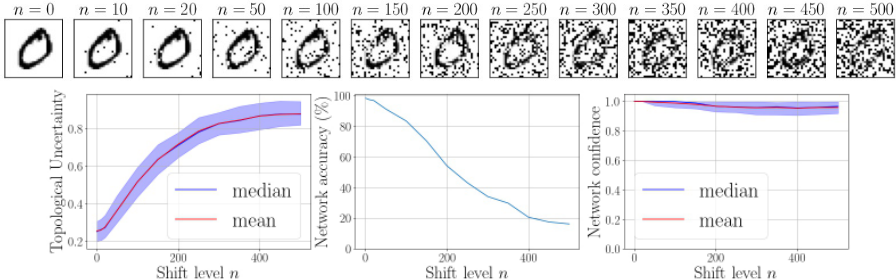
For this, we train a network on MNIST and, following the methodology presented in Section 3, store the corresponding average persistence diagrams for the 10 classes appearing in the training set. We then expose a batch of 1000 observations from the test set containing 100 instances of each class (that have thus not been seen by the network during the training phase) to the corruption shifts with various shift levels n ∈ {0, 10, 20, 50, 100, 150, . . . , 500}. For each shift level, we evaluate the distributions of TUs and confidences attributed by the network to each sample, along with the accuracy of the network over the batch. As illustrated in the second row of Figure 5, as the batch shifts, the TU increases and the accuracy drops. However, the network confidence remains very close to 1, making this indicator unable to account for the shift. In practice, one can monitor a network by routinely evaluating the distribution of TUs of a new batch (e.g., daily recorded data). A sudden change in this 1D distribution is likely to reflect a shift in the distribution of observations that may itself lead to a drop in accuracy (or the apparition of OOD samples as illustrated in Subsection 4.2).
We end this subsection by stressing that the empirical relation we observe between the TU and the network accuracy cannot be guaranteed without further assumption on the law (X, Y). It however occurs consistently in our experiments
(see the supplementary material for complementary experiments involving different types of shift and network architectures). Studying the theoretical behavior of the TU and activation graphs in general will be the focus of further works.
5 Conclusion and Perspectives
Monitoring trained neural networks deployed in practical applications is of major importance and is challenging when facing samples coming from a distribution that differs from the training one. While previous works focus on improving the behavior of the network confidence, in this article we propose to investigate the whole network instead of restricting to its final layer. By considering a network as a sequence of bipartite graphs on top of which we extract topological features, we introduce the Topological Uncertainty, a tool to compactly quantify if a new observation activates the network in the same way as training samples did. This notion can be adapted to a wide range of networks and is independent from the way the network was trained. We illustrate numerically how it can be used to monitor networks and how it turns out to be a strong alternative to network confidence on these tasks. Our implementation will be integrated to the Gudhi library.
We believe that this work will motivate further developments involving Topological Uncertainty, and more generally activation graphs, when it comes to understand and monitor neural networks. In particular, most techniques introduced in recent years to improve confidence-based descriptors may be declined to be used with Topological Uncertainty. These trails of research will be investigated in future work.
@inproceedings{ijcai2021p367,
  title     = {Topological Uncertainty: Monitoring Trained Neural Networks through Persistence of Activation Graphs},
  author    = {Lacombe, Théo and Ike, Yuichi and Carrière, Mathieu and Chazal, Frédéric and Glisse, Marc and Umeda, Yuhei},
  booktitle = {Proceedings of the Thirtieth International Joint Conference on
               Artificial Intelligence, {IJCAI-21}},
  publisher = {International Joint Conferences on Artificial Intelligence Organization},
  editor    = {Zhi-Hua Zhou},
  pages     = {2666--2672},
  year      = {2021},
  month     = {8},
  note      = {Main Track},
  doi       = {10.24963/ijcai.2021/367},
  url       = {https://doi.org/10.24963/ijcai.2021/367},
}
TY - CPAPER TI - Topological Uncertainty: Monitoring Trained Neural Networks through Persistence of Activation Graphs AU - Lacombe, Théo AU - Ike, Yuichi AU - Carrière, Mathieu AU - Chazal, Frédéric AU - Glisse, Marc AU - Umeda, Yuhei T2 - Proceedings of the Thirtieth International Joint Conference on Artificial Intelligence, IJCAI-21 PB - International Joint Conferences on Artificial Intelligence Organization PY - 2021 SP - 2666 EP - 2672 DO - 10.24963/ijcai.2021/367 UR - https://doi.org/10.24963/ijcai.2021/367 ER -Copied
Machine-readable versions of this paper, for tools and AI agents:





