
Ownership Concentration and Wealth Inequality in Russia
Proceedings of the Thirty-First International Joint Conference on Artificial Intelligence. AI for Good. Pages 5136-5142.
https://doi.org/10.24963/ijcai.2022/713
Keywords
- Multidisciplinary Topics and Applications: Databases
- Data Mining: Networks
- Multidisciplinary Topics and Applications: Computational Sustainability
- Multidisciplinary Topics and Applications: Economics
Abstract
Knowledge of beneficial owners of companies is key to monitoring and managing wealth inequality in any country. Here we propose a robust and scalable network-based algorithm to reveal hidden ultimate owners in public ownership data. Our approach is based on the idea of Katz centrality in complex networks and circumvents the problem of cyclic ownership used to obscure effective control
through closed chains of intermediaries. When applied to a country-scale directed ownership network with 6 million nodes, the algorithm identifies ultimate holders of every organisation in 2021’s Russia. The distribution of asset ownership in the country follows a power law, indicating strong wealth inequality with Gini index of 0.93. 51.7% of net assets of non-financial companies are ultimately held by the state and state-owned enterprises, 25.0% — by individuals (incl. 3.4% held by Forbes–200-listed individuals), and 11.3% are owned by foreign entities (incl. 5.7% in tax havens).
- [Alstadsæter et al., 2018] Annette Alstadsæter, Niels Johan- nesen, and Gabriel Zucman. Who owns the wealth in tax havens? Macro evidence and implications for global in- equality. Journal of Public Economics, 162:89-100, 2018.
- [Aykut et al., 2017] Dilek Aykut, Apurva Sanghi, and Gina Kosmidou. What to do when foreign direct investment is not direct or foreign: FDI round tripping. World Bank Policy Research Working Paper 8046, 2017.
- [Batagelj and Zaveršnik, 2002] Vladimir Batagelj and Matjaž Zaveršnik. Generalized cores. mimeo, https://arxiv.org/abs/cs/0202039, 2002. Link
- [Blanchet et al., 2017] Thomas Blanchet, Juliette Fournier, and Thomas Piketty. Generalized Pareto curves: theory and applications. Review of Income and Wealth, 2017.
- [Boycko et al., 1993] Maxim Boycko, Andrei Shleifer, Robert Vishny, Stanley Fischer, and Jeffrey Sachs. Pri- vatizing Russia. Brookings Papers on Economic Activity, (2):139-192, 1993.
- [Brioschi et al., 1989] Francesco Brioschi, Luigi Buzzacchi, and Massimo G Colombo. Risk capital financing and the separation of ownership and control in business groups. Journal of Banking & Finance, 13(4-5):747-772, 1989.
- [Crama and Leruth, 2007] Yves Crama and Luc Leruth. Control and voting power in corporate networks: Concepts and computational aspects. European Journal of Opera- tional Research, 178(3):879-893, 2007.
- [Dang et al., 2018] Hai-Anh Dang, Michael Lokshin, Kseniya Abanokova, and Maurizio Bussolo. Inequality and welfare dynamics in the Russian Federation during 1994-2015. World Bank Policy Research Working Paper 8629, 2018.
- [Davis, 2008] Gerald F Davis. A new finance capital- ism? Mutual funds and ownership re-concentration in the United States. European Management Review, 5(1):11- 21, 2008.
- [de Silanes et al., 1999] Florencio López de Silanes, Rafael La Porta, and Andrei Shleifer. Corporate ownership around the world. Journal of Finance, 54(2):471-517, 1999.
- [Desai et al., 2006] Mihir A Desai, C Fritz Foley, and James R Hines Jr. The demand for tax haven operations. Journal of Public Economics, 90(3):513-531, 2006.
- [Dorogovtsev et al., 2006] Sergey Dorogovtsev, Alexander Goltsev, and Jose Ferreira Mendes. k-core organiza- tion of complex networks. Physical Review Letters, 96(4):040601, 2006.
- [Galeotti and Ghiglino, 2021] Andrea Galeotti and Christian Ghiglino. Cross-ownership and portfolio choice. Journal of Economic Theory, 192:105194, 2021.
- [Gerschgorin, 1931] Semyon Gerschgorin. Über die Ab- grenzung der Eigenwerte einer matrix. Izv. Akad. Nauk. USSR Otd. Fiz.-Mat. Nauk, 7:749-754, 1931.
- [Glattfelder and Battiston, 2009] James B Glattfelder and Stefano Battiston. Backbone of complex networks of corporations: The flow of control. Physical Review E, 80(3):036104, 2009.
- [Gorodnichenko et al., 2010] Yuriy Gorodnichenko, Klara Sabirianova Peter, and Dmitriy Stolyarov. In- equality and volatility moderation in Russia: Evidence from micro-level panel data on consumption and income. Review of Economic Dynamics, 13(1):209-237, 2010.
- [Gumpert et al., 2016] Anna Gumpert, James R Hines Jr, and Monika Schnitzer. Multinational firms and tax havens. Review of Economics and Statistics, 98(4):713-727, 2016.
- [He and Huang, 2017] Jie Jack He and Jiekun Huang. Prod- uct market competition in a world of cross-ownership: Ev- idence from institutional blockholdings. Review of Finan- cial Studies, 30(8):2674-2718, 2017.
- [Hines Jr, 2010] James R Hines Jr. Treasure islands. Journal of Economic Perspectives, 24(4):103-26, 2010.
- [Jia and Barabási, 2013] Tao Jia and Albert-László Barabási. Control capacity and a random sampling method in ex- ploring controllability of complex networks. Scientific Re- ports, 3(1):1-6, 2013.
- [Jones, 2015] Charles I Jones. Pareto and Piketty: The macroeconomics of top income and wealth inequality. Journal of Economic Perspectives, 29(1):29-46, 2015.
- [Karhunen et al., 2021] Päivi Karhunen, Svetlana Ledyaeva, and Keith D Brouthers. Capital round-tripping: Determi- nants of emerging market firm investments into offshore financial centers and their ethical implications. Journal of Business Ethics, pages 1-21, 2021.
- [Katz, 1953] Leo Katz. A new status index derived from so- ciometric analysis. Psychometrika, 18(1):39-43, 1953.
- [Kichikawa et al., 2019] Yuichi Kichikawa, Hiroshi Iyetomi, Takashi Iino, and Hiroyasu Inoue. Community structure based on circular flow in a large-scale transaction network. Applied Network Science, 4(1):1-23, 2019.
- [Ledyaeva et al., 2013] Svetlana Ledyaeva, Päivi Karhunen, John Whalley, et al. If foreign investment is not foreign: round-trip versus genuine foreign investment in Russia. CEPII Working Paper No 2013-05, 2013.
- [Ledyaeva et al., 2015] Svetlana Ledyaeva, Päivi Karhunen, Riitta Kosonen, and John Whalley. Offshore foreign direct investment, capital round-tripping, and corruption: Empir- ical analysis of Russian regions. Economic Geography, 91(3):305-341, 2015.
- [Mizuno et al., 2020] Takayuki Mizuno, Shohei Doi, and Shuhei Kurizaki. The power of corporate control in the global ownership network. PLoS One, 15(8), 2020.
- [Novokmet et al., 2018] Filip Novokmet, Thomas Piketty, and Gabriel Zucman. From Soviets to oligarchs: inequal- ity and property in Russia 1905-2016. Journal of Eco- nomic Inequality, 16(2):189-223, 2018.
- [OECD, 2000] OECD. Report to the 2000 ministerial coun- cil meeting and recommendations by the committee on fis- cal affairs. Progress in Identifying and Eliminating Harm- ful Tax Practices, 2000. [OECD, 2013] OECD. OECD guidelines for micro statistics on household wealth. OECD Publishing, 2013. [Open Ownership, 2020] Open Ownership. Beneficial ownership in law: Definitions and thresholds. Pol- icy briefing, https://www.openownership.org/uploads/ definitions-briefing.pdf, 2020. Link
- [Piketty and Saez, 2003] Thomas Piketty and Emmanuel Saez. Income inequality in the United States, 1913-1998. Quarterly Journal of Economics, 118(1):1-41, 2003.
- [Piketty and Saez, 2014] Thomas Piketty and Emmanuel Saez. Inequality in the long run. Science, 344(6186):838- 843, 2014.
- [Tørsløv et al., 2018] Thomas R Tørsløv, Ludvig S Wier, and Gabriel Zucman. The missing profits of nations. Technical report, National Bureau of Economic Research, 2018. [UNODC, 2021] UNODC. Resolution 9/7. Ninth session of the Conference of the States Parties to the United Nations Convention against Corruption, 2021.
- [Vitali et al., 2011] Stefania Vitali, James Glattfelder, and Stefano Battiston. The network of global corporate con- trol. PloS One, 6(10):e25995, 2011.
References were extracted automatically from the PDF and may contain errors.
Full text extracted automatically from the PDF; figures, tables and equations may differ. The PDF is the version of record.
1 Introduction
In its Resolution 9/7, Parties to the United Nations Convention against Corruption recognised the importance of "adequate and accurate beneficial ownership information on companies." [UNODC, 2021] As developed and developing countries are establishing registers of ultimate beneficial ownership (pioneered by the UK's People with Significant Control register), many nations struggle to find ultimate owners in intricate corporate networks designed to obscure and obfuscate actual control [Open Ownership, 2020]. Knowing beneficial owners is not only crucial for tax and anti-money laundering purposes, but could also help measure, understand, and manage wealth inequality since equity ownership is one of its key components [OECD, 2013].
In this paper we propose an algorithm rooted in network science that determines ultimate owners in country-scale networks with millions of organisation-participant equity ownership links. The key algorithmic challenge is so-called cyclic ownership and cross-ownership [de Silanes et al., 1999; Davis, 2008; He and Huang, 2017; Galeotti and Ghiglino, 2021]. Entities can own other entities and the link can go both ways, with ownership structures resembling rings where it is unclear who the ultimate owner is. In some jurisdictions (e.g. the UK) such cyclical ownership is prohibited as it is notoriously used to hide the ultimate owners. In other jurisdictions - such as Russia - it flourishes, rendering it virtually impossible to determine ultimate owners using the conventional graph-based approaches.
For computation of transitive shares and identification of the ultimate owners of organisations in corporate networks, we propose a network-based algorithm that is robust to the cyclic ownership. For that we link the network control with the Katz centrality measure [Katz, 1953], which is used in network science for evaluation of topological importance of the nodes in complex networks. Thus, we are able to regularize the divergent series appearing in the computation of transitive shares in the case of cyclic ownership, while taking into account all the paths between participant and organisation existing in the ownership network. Implementation of our approach is based on the core decomposition, which builds on an observation of the onion-like topology of ownership networks. For the large-scale analysis our algorithm provides dramatic acceleration of ultimate owners identification and computation of their respective shares.
We take our algorithm to ownership data from a large country where cyclical ownership is allowed - Russia. As Russia transitioned to a market economy in the early 1990s, tens of millions of new equity shareholders emerged after the largest privatization in human history [Boycko et al., 1993]. While this transform aimed at equitable distribution of wealth and formation of a new class of minority shareholders, this process has arguably resulted in increase of wealth inequality in the country. We study ownership concentration in this country today using the administrative data of equity ownership coming from the official business register.
Using the administrative data on ownership coupled with information on the country's wealthiest individuals from the Forbes-200 list and equity ownership by tax havens we are able to estimate the effective share of the country's net assets owned by the state, state-owned enterprises, ultra highnet-worth individuals, and foreign entities. Our results indicate that the majority of net assets in the country (51.7%) are owned by the state itself. It is surprising, though, that 11.3% of net assets are ultimately controlled by foreign entities in the country as of 2018. We explain this by tax haven use of Russian residents to obfuscate the effective ownership [Aykut et al., 2017; Ledyaeva et al., 2013; Ledyaeva et al., 2015]. To the best of our knowledge, we are first to estimate the scope of this process using the administrative data and on the scale of the entire country. Finally, we quantify the size of wealth inequality in the country by estimating the Lorenz curve and Gini coefficient with the aid of our derived effective ownership shares.
| All | SH | ST | I | C | |
|---|---|---|---|---|---|
| # nodes by type: | 5,967,800 | 2,947,953 | 2,960,315 | 58,065 | 1,467 |
| Individual | 48.2% | 97.5% | 0% | 0% | 0% |
| Entity | 49.5% | 1.7% | 96.4% | 86.7% | 91.8% |
| Privately held shares | 0.1% | 0.2% | 0% | 0% | 0% |
| Publicly traded shares | 0.0% | 0% | 0% | 0% | 0% |
| State-owned enterprise | 0.2% | 0% | 0.4% | 3.5% | 5.8% |
| State | 2.0% | 0.5% | 3.2% | 9.9% | 2.5% |
| Foreign-controlled | 1.5% | 0.9% | 2.1% | 0% | 0% |
| Tax haven-controlled | 0.2% | 0.4% | 0% | 0% | 0% |
| # nodes with 2018 financials | 1,810,151 | 12,260 | 1,756,356 | 40,371 | 1,164 |
| Mean total assets, thous 2020 RUB | 165,553 | 6,716,743 | 63,777 | 2,550,970 | 2,002,781 |
| Mean net assets, thous 2020 RUB | 69,609 | 3,339,214 | 19,218 | 1,246,876 | 836,751 |
In the remainder of this paper, we first provide some preliminary definitions and the set up. Then, we introduce the proposed model and describe the computational algorithm in details. Finally, we demonstrate and discuss the results.
2 Preliminaries and Problem Statement
This equity (ownership) data can be represented as an oriented weighted network. In this model organisations and their participants resemble N nodes, while the weights of E edges between them reflect the corresponding equity shares. The edges are essentially directed due to the non-symmetric nature of the organisation-participant relationship: by definition, each edge (i, k) in the network is oriented from a participant i to an organisation k, if the participant i has a non-zero share in the organisation k. The share itself is encoded as the corresponding weight 0 < Wik ≤ 1 of the edge. Thus, by construction, the matrix Wik is the N × N adjacency matrix (non-symmetric) of the ownership network. Absence of the edge between a pair of nodes i, k is equivalent to the zero entry in the matrix, Wik = 0.
Normalisation condition requires that the total sum of shares among the participants of each company should be equal to unity for any organisation k. Importantly, this does not hold for an arbitrary node in the network, since individuals have no shareholders. Also there are no restrictions on the values of the sums over columns in the matrixW and they can take arbitrary values between 0 and N. However, the total weight in the matrixW is equal to ∑Ni=1 ∑Nk=1 Wik = M, where M < N is the total number of organisations in the ownership network.
We build on the data from a company register called the Uniform State Register of Legal Entities (EGRUL). This register has official and legally binding information on equity ownership in every organisation, listing the taxpayer identifiers, names, and countries of origin of individuals or organisations with direct interest in equity of a given organisation in the country. Here we work with the January 1, 2021 snapshot of the register from the Federal Tax Service and construct a list of organisation-participant relationships with equity shares corresponding to every participant. The resulting network consists of N = 5, 967, 800 organisations and their participants in total (nodes). In Tab. 1 (column "All") we report the organisations and participants by their types. The majority of participants are individuals (48.2%) holding interest in LLCs and other types of private entities (49.5%). The state comprises 2.0% of nodes.
Apart from 6 node types, we enriched our ownership network with other non-topological features. For every participant and organisation we determined whether it comes from Russia or a foreign country. Since EGRUL requires organisations to specify the country of origin of their equity interest this data is also available in the register. 1.5% of organisations or participants are determined as being outside Russia. Knowing their country of origin we matched it against one of the three authoritative country lists of tax havens [OECD, 2000; Hines Jr, 2010; Tørsløv et al., 2018] to understand whether a participant comes from a jurisdiction known for beneficial tax regime or secrecy. When it comes to local individuals, we matched our participants with 2021 version of Forbes-200 list of the largest businesspersons in Russia on their taxpayer identifiers or surnames. We also added data on net assets of non-financial firms in the country as of 2018 (this was the latest year with open data available from the Russian Statistical Service). After manual inspection and removal of outliers with unrealistic values or zeroing of negative net assets we were left with 1,810,151 nodes with financial data available. Three-fold decrease in the number of nodes with this information should not be surprising. Many organisations in the country are not commercial organisations or may simply fail to submit the financial reports to the authorities.
3 Methodology
3.1 Transitive Control
It is well-known that direct relationships are not sufficient to reveal hidden participants with ultimate control over organisations. Thus, one should take into account the indirect influence a participant might propagate through the chains of all other nodes in the network. This paradigm is originally known as control by transitivity; the indirect (transitive) control is proportional to the net flow from i to j in the given network connectivity. This net flow can be formally defined as an infinite series of powers of the adjacency matrix W as follows
where the first term is the contribution from the direct control, the second term is the contribution of paths of length 2, the third term is the contribution of paths of length 3, etc. (hence the term "transitive").
Importantly, one immediately notes that the series in Eq. 1 is divergent for matrices with the spectral radius ρ (W) ≥ 1. In particular, this is the case for stochastic matrices, ∀k ∑i Wik = 1, for which the spectral radius is equal to unity. Thus, the series Eq. 1 is divergent for any stochastic connected component of the ownership graph, i.e. where each node has at least one in-going edge. Notably, the whole ownership network is not stochastic, because there are participants that do not belong to anyone (e.g., individuals); the corresponding nodes do not have in-going edges.
Furthermore, as it follows from the Gershgorin circle theorem [Gerschgorin, 1931], the lengths of all eigenvalues λi of the ownership adjacency matrices W do not exceed unity, |λi| ≤ 1. This is a general property of the matrices satisfying two conditions: (a) the column sums of W, reflecting the total in-going ownership weight, can be either 0 (individuals) or 1 (organizations); (b) self-ownership is excluded, ∀i Wii = 0.As the analysis of real ownership networks suggests [Crama and Leruth, 2007; Vitali et al., 2011], typically there is at least one stochastic connected component in a graph. Such components generate unitary eigenvalues in the spectrum of the ownership network. Therefore, in general, the series Eq. 1 is divergent, which poses a serious challenge for computation of the transitive shares across the whole network.
Here we propose a modification of Eq. 1 that resolves the aforementioned issue. We introduce a small parameter ϵ and regularise Eq. 1 as follows
Now the series Eq. 2 is convergent for any α < 1, since αρ (W) < 1. Plugging ϵ = 10-6 in Eq. 2 allows to circumvent the problem of divergence and virtually takes into account an infinite number of all paths existing between participant and organization in cyclic subgraphs.
From physics viewpoint, the measure Eq. 2 is known as Katz centrality. It allows to estimate centrality (or topological importance) of the nodes in a complex network. The Katz measure was initially proposed for sociometric studies in the early 1950s [Katz, 1953]. The Katz centrality provides a natural generalization of the eigenvector centrality by assigning exponential importance to shorter paths.
3.2 Algorithm for Calculation of Transitive Shares
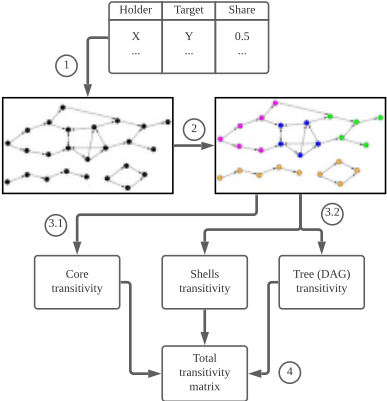
The straightforward matrix inversion in Eq. 2 is not computationally efficient for large-scale ownership networks of several millions of organisations and participants. To this end, we propose an efficient algorithm that is based on the fundamental observation of the onion-like topological structure of ownership networks (see Fig. 1):
1. 1,1-core decomposition
First, we aim to identify the 1,1-core, i.e. the maximal subgraph with at least one in-going and one out-going edge. It is easy to understand that all cyclic paths existing in the network belong to the 1,1-core (we will use the shorter term "core" henceforth). Since the rest of the graph does not have cycles, it forms a forest or a union of disjoint tree-like components. Importantly, the number of first non-vanishing terms in the series Eq. 2 for the forest are bound by the diameter of the corresponding connected components.
In order to compute the transitive shares inside the core one needs to perform matrix inversion in Eq. 2. However, for real ownership networks the size of the core, Nc, turns out to be 3 orders of magnitude smaller than the total size of the network, N. Thus, the 1,1-core decomposition allows to localize the subgraph with cyclic ownership and provides a drastic reduction of the overall computational complexity of the algorithm (see below).
2. Core-shell-forest decomposition
Second, we decompose all connected components of the core into three parts: two shells (in- and out-) and the core itself. This decomposition reflects the bow-tie structure of the ownership network [Glattfelder and Battiston, 2009; Vitali et al., 2011]. By the end of this step, all nodes (participants and organisations) in the network are sorted into several types, depending on the topological structure of the component they belong to: in-shell, out-shell, core, or tree-like component.
3. Transitive shares within the components
Third, we compute the matrix of transitive shares within each component. The core transitivity matrix is computed as the sum of the infinite geometric series, Eq. 2. The other transitivity matrices (in-, out- shells, isolated trees) are computed as sums of finite series bound by the diameter of the corresponding components.
- Decomposition of the transitivity of the entire network At the fourth step the transitivity matrix T of the whole network is expressed through the transitivity matrices of each component from Step 3, according to the "interaction" between the components (see below). This decomposition takes into account all the paths that connect the shells and the core with each other.
1,1-Core Decomposition
For identification of the core containing cyclic ownership, we employ an iterative procedure similar to the 2-core decomposition for non-oriented graphs [Batagelj and Zaverˇsnik, 2002; Dorogovtsev et al., 2006]. Specifically, we iteratively remove the nodes and their incident edges if the node has only ingoing or only out-going edges, i.e. either in-degree kiout = 0 or out-degree ki in = 0, correspondingly. At the very first step we remove the participants that are not owned by anyone (ki in = 0) and organisations that do not own anyone (kiout = 0). We classify such entities as super-holders (SH) and super-targets (ST), respectively. Such removal of nodes at the first step results in formation of new "hanging" vertices with kin ∗ kout = 0, which have been previously linked to super-holders and super-targets. After several iterations we converge to an irreducible subgraph C of nodes that have at least one in-going and at least one out-going edge, i.e. the 1,1-core. Finally, all other nodes in the graph which were removed at step 2 onward are called the intermediaries (I). We note that the core generally consists of several disjoint weakly connected components.
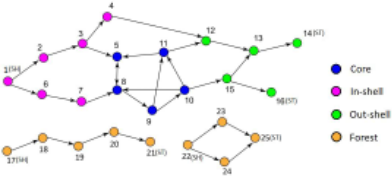
Consider a graph with three connected components in Fig. 2 as an example. At the first iteration all super-holders (nodes 1, 17, 22) and super-targets (nodes 14, 16, 21, 25) are peeled off from the network. Then the nodes 2, 6, 18 become the new super-holders, and nodes 13, 15, 20 become the new super-targets and are to be removed at the second step. Note that this iterative process can lead to the formation of isolated vertices (e.g. nodes 23, 24 after the first peeling iteration). Such nodes are also removed from the network. After four iterations the graph is left with 5 nodes for which kin∗kout ̸= 0 (nodes 5, 8, 9, 10, 11). They form the 1,1-core of the network.
Core-Shell-Forest Decomposition
To implement effective control propagation in each corerelated connected component (CC), we further divide it into three parts: out-going shell (out-shell), core, and in-going shell (in-shell). Out-shell nodes are defined as the nodes which are reachable from the core via paths in the directed ownership graph. In-shell nodes, by definition, is the complementary to the out-shell and the core.
We also isolate the "tree" components of the corporate network, which are a set of directed acyclic graphs (DAG) not connected with the core of the network (i.e. belonging to separate weakly connected components not intersecting with the core). The breadth-first search (BFS) algorithm for undirected networks is used to extract a set of connected components of the core. As a result, each node in the network is labelled as a core-related connected component (CC) node or a tree component (TC) node. Fig. 2 shows the nodes belonging to the tree components (orange). Blue, magenta, and green nodes belong to CC and correspond to the core, in- and out- shells of the core, respectively.
| Rank | Entity | Net Assets | Rank | Entity | Net Assets |
|---|---|---|---|---|---|
| 1 | State-owned | 26,477 | 11 | Sibur Holding | 352 |
| 2 | Non-Forbes-200 individuals | 18,129 | 12 | Inc-Capital | 242 |
| 3 | State-owned enterprises | 16,809 | 13 | EvroKhim | 200 |
| 4 | Tax haven-owned | 4,740 | 14 | TAIF | 168 |
| 5 | Non-tax haven foreign | 4,704 | 15 | NLMK | 135 |
| 6 | Forbes-200 individuals | 2,804 | 16 | EuroSibEnergo | 132 |
| 7 | Lukoil | 2,273 | 17 | Plato | 120 |
| 8 | PIK | 421 | 18 | Riel | 109 |
| 9 | Novatek | 419 | 19 | Severstal | 105 |
| 10 | Rosneft Holding | 390 | 20 | Rusagro | 103 |
Transitive Ownership Calculation
To calculate the transitive ownership matrix T we decompose it into a combination of transitive ownership matrices within each of the structures defined above: the in-shell, the outshell, the core, and the tree connectivity components. The procedure consists of the following steps:
1) The adjacency matrix of each structure is computed. The links projecting to the core and to the out-shell are added to the in-shell adjacency matrix Win. Similarly, the links projecting from the core are added to the out-shell adjacency matrixWout. For direct ownership relations within the core the core adjacency matrix WC is used without additional connections with the shells. The tree components are not connected to the core or to any of the shells, so the corresponding adjacency matrixWTC is constructed independently.
2) Transitive ownership matrices for the out-shell and inshell, as well as for the tree components (matrices Tout, Tin and TTC, respectively) are calculated. The sum of the following finite series is calculated for all three structures:
Here Tx is the transitivity matrix of the corresponding graph component (Tin, Tout, or TTC), Wx is the adjacency matrix of the corresponding graph component and d is upper bound of the maximal possible path length, which is equal to twice the number of steps in the iterative peeling procedure of the graph to the core.
3) The transitive ownership matrix for the core nodes (matrix TC) is calculated using Eq. (2) with replacement of the matrixWwith the core adjacency matrixWC. The ownership relations between holders and targets in the shells and the core can be taken into account by means of the following "interaction" rule between the structures:
Here all transitive ownership matrices (Tin, Tout and TTC) have been grown to the size NCC ×NCC by adding zero rows and columns. The first three summands contain the weights of transitive ownership within each of the structures (in-shell, out-shell and the core), the second three summands account for pairwise relations (paths) of ownership between the structures, and the last one represents the weight on the paths going from in-shell to out-shell through the core. The resulting transitivity matrix of the CC subgraph (the set of weakly connected components containing the core) TCC is then grown to size N ×N by adding zero rows and columns. This is necessary to be able to add up the transitivity matrices relating to non-interacting components.
4) Due to the absence of edges between the core with its shells and the tree components, the total transitive ownership matrix T is the sum of the transitive ownership matrix of the tree components TTC and the transitive ownership matrix of the core with the shells' TCC: T = TCC + TTC.
Complexity
The dominant term in the algorithm has a complexity of O( E2 lnN N + |C|3 ). The first term is connected with raising sparse adjacency matrices to the power of d ≈ lnN. In practice, ownership networks are sparse: E ≈ N, and the core matrix inversion is implemented faster than O(|C|3 ). Combined with the small core size |C| << N , this leads to the overall computational complexity O(N lnN).
Identifying Ultimate Controlling Entities
The ultimate owner, by definition, cannot be controlled by anyone and it resembles a node in the ownership graph with zero in-degree. Therefore, in order to extract the ultimate owners of the company one needs to choose the rows i in the matrix T that correspond to the nodes for which the corresponding columns are empty, Tki = 0, ∀k.
4 Results
We start by examining the core-shell-forest decomposition of Russian ownership network in Tab. 1. Out of 5,967,800 nodes the majority, 2,960,315, are super-targets (column "ST"), i.e. organisations that do not own any other organization. By construction, individuals cannot act as super-targets since nobody could own a physical person. The opposite trend is observed for 2,947,953 super-holders: the lion's share of them (97.5%) are individuals. In fact, the most common network relationship in the data is a SH→ST link where SH is an individual and ST is an LLC. However, over 1.7% of super-holders are entities. This could mean that we are missing the information on their ultimate super-holders that are physical persons (for example, when such entities are located outside Russia and we cannot trace their owners in other jurisdictions). There are 58,065 intermediaries in the data, i.e. organizations that both own and are owned by other entities or individuals.
Now that we know the effective shares controlled by the ultimate owners (UOs) in Russia we can compute the top superholders by their net assets as of 2018. Tab. 2 reports the results of this exercise for top-20 entities or groups of entities. The largest super-holder is the Russian state that owned 26.5 trillion rubles (USD 366 billion, all figures in 2020 rubles) worth of net assets. Another manifestation of state ownership is due to state-owned enterprises that all together controlled RUB 16.8 trillion (USD 232 billion) worth of net assets. A surprising second most prominent owner type are non-billionaire individuals combined (i.e. small and medium business owners). Third and fourth most prominent group of owners are outside Russia, either in tax havens or elsewhere. Finally, in Tab. 2 we list the remaining leading public or private corporations. Their shareholders are not listed in the public register by construction since shareholder equity that is publicly or privately traded is outside the scope of the register.
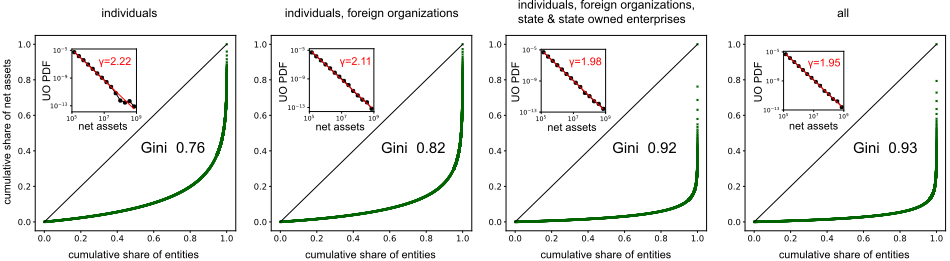
We quantify inequality in Russia by analyzing the distribution of net assets among ultimate owners identified by our algorithm. Only owners with ≥ 10 million rubles in total assets were considered; other holders correspond to a heavy lowwealth tail. In Fig. 3 we demonstrate how the inequality increases upon adding of new types of UOs into the analysis. In accord with increase of the Gini index, we observe a decrease of the power-law exponent of the distribution of net assets in the groups from γ = 2.22 for individuals to γ = 1.95 for all UOs. This trend is clear evidence that addition of foreign organisations and state companies to individuals greatly contribute to increase of inequality. At the same time, transition from the third to the last column, driven by private national organisations, results in only a slight increase of the Gini index by one centesimal point.
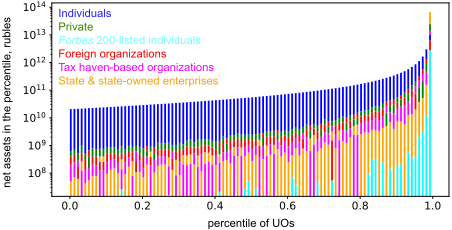
Finally, we examine the net assets composition of each percentile of UO, shown in Fig. 4. In all of the percentiles, but the last one, the leadership belongs to non-Forbes individuals. However, the last percentile contains roughly 50 times more net assets than the previous one and its composition turns out to be drastically different: the leader is the State, which is followed by national private and tax haven-based organizations. Ultra high-net-worth individuals from Forbes200 reside in the top percentiles, as expected. However, we notice that some Forbes-200-listed individuals appear in the lower percentiles. Two explanations are due. First, such individuals can simply own most of their wealth in shareholder equity in public corporations that is not captured in our data. Second, wealthy individuals could exercise control through foreign entities.
5 Discussion
Our findings contribute to three literatures. First, we add to the literature on computation of control in corporate networks [Brioschi et al., 1989; Vitali et al., 2011; Jia and Barab´asi, 2013; Kichikawa et al., 2019; Mizuno et al., 2020]. The proposed algorithm allows us to arrive at a deterministic solution, identifying ultimate control in networks with cyclic ownership. This is done at scale and can be applied to any corporate network. Second, we contribute to the literature studying tax haven use by multinational corporations [Desai et al., 2006; Gumpert et al., 2016; Alstadsæter et al., 2018; Tørsløv et al., 2018] and foreign direct investment round-tripping [Aykut et al., 2017; Karhunen et al., 2021]. To the best of our knowledge, we are first to quantify the scope of tax haven use in the entire country. By relying on administrative data from a business register and network science we are able to infer effective ownership shares of virtually every businessperson in the country.
Knowledge of effective ownership enables us to make our third contribution to the literature on measuring inequality in Russia [Gorodnichenko et al., 2010; Blanchet et al., 2017; Novokmet et al., 2018; Dang et al., 2018] and in general [Piketty and Saez, 2003; Piketty and Saez, 2014; Jones, 2015]. Having proposed a novel method to measure effective private equity ownership, we are able to capture an important component of household wealth [OECD, 2013]. This component was previously underexplored using survey-based methods that permeate wealth inequality studies since any survey relies on self-reported information by individuals.
Despite legal obligation, some organizations may fail to submit their equity ownership data to the register. They may also fail to use taxpayer identifiers of owners, providing their names only instead. Financial data may also be erroneous, driving net asset sums upward or downward. Finally, and most importantly, the business register does not contain information on shareholder capital ownership. We do not observe owners of listed corporations by construction. This should not come as a surprise: when equity is publicly traded no register could store up-to-date information coming from market transactions. However, we do fully observe ownership in LLCs, that is, private equity. The majority of profit is generated by LLCs in the country. Even though all our estimates and results are biased downward due to omission of shareholder equity from consideration we believe that the results are still valid and worth considering since they present the lower bound of asset ownership in the country.
Acknowledgments
The work was supported by the Analytical center under the RF Government (subsidy agreement 000000D730321P5Q0002, Grant No. 70-2021-00145 02.11.2021).
@inproceedings{ijcai2022p713,
  title     = {Ownership Concentration and Wealth Inequality in Russia},
  author    = {Polovnikov, Kirill and Pospelov, Nikita and Skougarevskiy, Dmitriy},
  booktitle = {Proceedings of the Thirty-First International Joint Conference on
               Artificial Intelligence, {IJCAI-22}},
  publisher = {International Joint Conferences on Artificial Intelligence Organization},
  editor    = {Luc De Raedt},
  pages     = {5136--5142},
  year      = {2022},
  month     = {7},
  note      = {AI for Good},
  doi       = {10.24963/ijcai.2022/713},
  url       = {https://doi.org/10.24963/ijcai.2022/713},
}
TY - CPAPER TI - Ownership Concentration and Wealth Inequality in Russia AU - Polovnikov, Kirill AU - Pospelov, Nikita AU - Skougarevskiy, Dmitriy T2 - Proceedings of the Thirty-First International Joint Conference on Artificial Intelligence, IJCAI-22 PB - International Joint Conferences on Artificial Intelligence Organization PY - 2022 SP - 5136 EP - 5142 DO - 10.24963/ijcai.2022/713 UR - https://doi.org/10.24963/ijcai.2022/713 ER -Copied
Machine-readable versions of this paper, for tools and AI agents:





