
Dynamic Structure Learning through Graph Neural Network for Forecasting Soil Moisture in Precision Agriculture
Proceedings of the Thirty-First International Joint Conference on Artificial Intelligence. AI for Good. Pages 5185-5191.
https://doi.org/10.24963/ijcai.2022/720
Keywords
- Multidisciplinary Topics and Applications: Sustainable Development Goals
- Data Mining: Mining Spatial and/or Temporal Data
- Data Mining: Mining Graphs
- Multidisciplinary Topics and Applications: Computational Sustainability
Abstract
Soil moisture is an important component of precision agriculture as it directly impacts the growth and quality of vegetation. Forecasting soil moisture is essential to schedule the irrigation and optimize the use of water. Physics based soil moisture models need rich features and heavy computation which is not scalable. In recent literature, conventional machine learning models have been applied for this problem. These models are fast and simple, but they often fail to capture the spatio-temporal correlation that soil moisture exhibits over a region. In this work, we propose a novel graph neural network based solution that learns temporal graph structures and forecast soil moisture in an end-to-end framework. Our solution is able to handle the problem of missing ground truth soil moisture which is common in practice. We show the merit of our algorithm on real-world soil moisture data.
- [Ahmad et al., 2010] Sajjad Ahmad, Ajay Kalra, and Haroon Stephen. Estimating soil moisture using remote sensing data: A machine learning approach. Advances in Water Resources, 33(1):69-80, 2010.
- [Bandyopadhyay and Peter, 2021] Sambaran Bandyopad- hyay and Vishal Peter. Unsupervised constrained community detection via self-expressive graph neural network. In Uncertainty in Artificial Intelligence, pages 1078-1088. PMLR, 2021.
- [Castro et al., 2012] Marisol Castro, Rajesh Paleti, and Chandra R Bhat. A latent variable representation of count data models to accommodate spatial and temporal depen- dence: Application to predicting crash frequency at inter- sections. Transportation research part B: methodological, 46(1):253-272, 2012.
- [Chen et al., 2020] Weiqi Chen, Ling Chen, Yu Xie, Wei Cao, Yusong Gao, and Xiaojie Feng. Multi-range atten- tive bicomponent graph convolutional network for traffic forecasting. In The Thirty-Fourth AAAI Conference on Ar- tificial Intelligence, AAAI 2020, pages 3529-3536, 2020.
- [Chung et al., 2014] Junyoung Chung, Caglar Gulcehre, Kyunghyun Cho, and Yoshua Bengio. Empirical evalua- tion of gated recurrent neural networks on sequence mod- eling. In NIPS 2014 Workshop on Deep Learning, Decem- ber 2014, 2014.
- [Dasgupta et al., 2019] Kalyan Dasgupta, Kamal Das, and Manikandan Padmanaban. Soil moisture evaluation using machine learning techniques on synthetic aperture radar (sar) and land surface model. In IGARSS 2019-2019 IEEE International Geoscience and Remote Sensing Sym- posium, pages 5972-5975. IEEE, 2019.
- [Drucker et al., 1997] Harris Drucker, Christopher JC Burges, Linda Kaufman, Alex J Smola, and Vladimir Vapnik. Support vector regression machines. In Advances in neural information processing systems, pages 155-161, 1997.
- [Fatemi et al., 2021] Bahare Fatemi, Layla El Asri, and Seyed Mehran Kazemi. Slaps: Self-supervision improves structure learning for graph neural networks. Advances in Neural Information Processing Systems, 34, 2021.
- [Hannan and Rissanen, 1982] Edward J Hannan and Jorma Rissanen. Recursive estimation of mixed autoregressive- moving average order. Biometrika, 69(1):81-94, 1982.
- [Hou et al., 2020] Yifan Hou, Jian Zhang, James Cheng, Kaili Ma, Richard T. B. Ma, Hongzhi Chen, and Ming- Chang Yang. Measuring and improving the use of graph information in graph neural networks. In International Conference on Learning Representations, 2020.
- [Hummel et al., 2001] John W Hummel, Kenneth A Sud- duth, and Steven E Hollinger. Soil moisture and organic matter prediction of surface and subsurface soils using an nir soil sensor. Computers and electronics in agriculture, 32(2):149-165, 2001.
- [Jha et al., 2019] Kirtan Jha, Aalap Doshi, Poojan Patel, and Manan Shah. A comprehensive review on automation in agriculture using artificial intelligence. Artificial Intelli- gence in Agriculture, 2:1-12, 2019.
- [Jin et al., 2020] Wei Jin, Yao Ma, Xiaorui Liu, Xianfeng Tang, Suhang Wang, and Jiliang Tang. Graph structure learning for robust graph neural networks. In Proceed- ings of the 26th ACM SIGKDD international conference on Knowledge discovery and data mining, KDD '20, page 66-74, 2020.
- [Karrer and Newman, 2011] Brian Karrer and Mark EJ New- man. Stochastic blockmodels and community structure in networks. Physical review E, 83(1):016107, 2011.
- [Kingma and Ba, 2014] Diederik P Kingma and Jimmy Ba. Adam: A method for stochastic optimization. arXiv preprint arXiv:1412.6980, 2014.
- [Kipf and Welling, 2017] Thomas N. Kipf and Max Welling. Semi-supervised classification with graph convolutional networks. In International Conference on Learning Rep- resentations (ICLR), 2017.
- [Li et al., 2018] Yaguang Li, Rose Yu, Cyrus Shahabi, and Yan Liu. Diffusion convolutional recurrent neural net- work: Data-driven traffic forecasting. In International Conference on Learning Representations, 2018.
- [Liaghat et al., 2010] Shohreh Liaghat, Siva Kumar Bala- sundram, et al. A review: The role of remote sensing in precision agriculture. American journal of agricultural and biological sciences, 5(1):50-55, 2010.
- [Pareja et al., 2020] Aldo Pareja, Giacomo Domeniconi, Jie Chen, Tengfei Ma, Toyotaro Suzumura, Hiroki Kaneza- shi, Tim Kaler, Tao B Schardl, and Charles E Leiserson. Evolvegcn: Evolving graph convolutional networks for dynamic graphs. In AAAI, pages 5363-5370, 2020.
- [Pettorelli, 2013] Nathalie Pettorelli. The normalized differ- ence vegetation index. Oxford University Press, 2013.
- [Rui and Beaudoing, 2011] Hualan Rui and Hiroko Beaudo- ing. Readme document for global land data assimilation system version 2 (gldas-2) products. GES DISC, 2011, 2011.
- [Sanchez et al., 2012] Nilda Sanchez, José Martínez- Fernández, Anna Scaini, and Carlos Perez-Gutierrez. Validation of the smos l2 soil moisture data in the remed- hus network (spain). IEEE Transactions on Geoscience and Remote Sensing, 50(5):1602-1611, 2012.
- [Selvan et al., 2020] Raghavendra Selvan, Thomas Kipf, Max Welling, Antonio Garcia-Uceda Juarez, Jesper H Pedersen, Jens Petersen, and Marleen de Bruijne. Graph refinement based airway extraction using mean-field net- works and graph neural networks. Medical Image Analy- sis, page 101751, 2020.
- [Shang et al., 2021] Chao Shang, Jie Chen, and Jinbo Bi. Discrete graph structure learning for forecasting multiple time series. In International Conference on Learning Rep- resentations, 2021.
- [Veličković et al., 2018] Petar Veličković, Guillem Cucurull, Arantxa Casanova, Adriana Romero, Pietro Liò, and Yoshua Bengio. Graph Attention Networks. International Conference on Learning Representations, 2018.
- [Wu et al., 2019] Zonghan Wu, Shirui Pan, Fengwen Chen, Guodong Long, Chengqi Zhang, and Philip S Yu. A comprehensive survey on graph neural networks. arXiv preprint arXiv:1901.00596, 2019.
- [Zhang et al., 2002] Naiqian Zhang, Maohua Wang, and Ning Wang. Precision agriculture-a worldwide overview. Computers and electronics in agriculture, 36(2-3):113- 132, 2002.
- [Zhang et al., 2017] Junbo Zhang, Yu Zheng, and Dekang Qi. Deep spatio-temporal residual networks for citywide crowd flows prediction. In Thirty-first AAAI conference on artificial intelligence, 2017.
- [Zhu et al., 2021] Yanqiao Zhu, Weizhi Xu, Jinghao Zhang, Qiang Liu, Shu Wu, and Liang Wang. Deep graph struc- ture learning for robust representations: A survey. arXiv preprint arXiv:2103.03036, 2021.
References were extracted automatically from the PDF and may contain errors.
Full text extracted automatically from the PDF; figures, tables and equations may differ. The PDF is the version of record.
1 Introduction
Precision agriculture [Zhang et al., 2002] is the science of observing, assessing and controlling agricultural practices such as monitoring soil, crop and climate in a field; detection and prevention of pest and disease attacks; providing a decision support system. It can help optimizing the natural resources needed for agricultural activities and thus ensures an efficient, sustainable and environment friendly development of agriculture. Remote sensing and IoT technology [Liaghat et al., 2010] can be used as effective tools in precision agriculture by providing high resolution satellite imagery data with rich information about crop status, crop and water stresses, and ground truth agricultural information from local sensors and agricultural drones. Thus, availability of historical and realtime data has significantly improved the scope of applying artificial intelligence for precision agricultural practices [Jha et al., 2019].
Soil moisture is an important component of precision agriculture [Zhang et al., 2002] for crop health and stress management, irrigation scheduling, food quality and supply chain. Soil moisture measures the amount of water stored in various depths of soil. Forecasting high resolution and accurate soil moisture well ahead of time helps to save natural resources such as water. Soil moisture can be measured by soil sensors in the field [Hummel et al., 2001] or by physics based land surface models [Rui and Beaudoing, 2011]. However, deploying soil moisture sensors on a vast region is expensive. They also cannot provide forecasts. Physics based soil moisture estimation can be quite accurate, but they need extremely rich set of input features such as different soil properties, landscape information, crop information which are difficult to obtain. These physical models are also computationally heavy, making them infeasible to scale over a larger region.
∗The work was done when Anoushka was an intern at IBM Research and Sambaran was affiliated to IBM Research prior to joining Amazon
†Both Anoushka and Sambaran contributed equally
Soil moisture is also directly related to weather parameters such as temperature, precipitation, and vegetation condition of the field such as Normalized Difference Vegetation Index (NDVI) [Pettorelli, 2013]. There are data driven and machine learning approaches present for soil moisture estimation. Conventional techniques such as Bayesian estimation, random forest and support vector regression are commonly used in industry for their simplicity to model soil moisture with respect to these flexible set of input features [Dasgupta et al., 2019; Ahmad et al., 2010]. However, these approaches essentially treat different locations independently while modeling soil moisture and fail to exploit the rich spatial dependency that soil moisture values over a region exhibit. For example, if there is a rainfall, soil moisture values over the whole region increases. In an agricultural region, soil moisture values exhibits similar patterns with varying crop cycles. There exist methods in machine learning to capture such spatial dependencies through latent variable models [Castro et al., 2012] and supervised deep learning architectures [Zhang et al., 2017]. But they are complex in nature (with large number of parameters) and difficult to apply for soil moisture estimation as getting ground truth soil moisture data is expensive because of the cost of deploying physical sensors.
In this paper, we propose soil moisture forecasting as a semi-supervised learning problem on dynamic graphs (also known as temporal graphs or sequence of graphs) where the structure of the graph and node attributes change over time to capture the spatio-temporal variation of soil moisture. In contrast to existing supervised techniques, please note that semisupervised nature of our solution enables us to train the network on both labeled (data points with ground truth soil moisture) and unlabeled (data points with missing soil moisture) data. This is important because (i) obtaining ground truth soil moisture is expensive and (ii) there can be large amount of missing ground truth soil moisture values because of device and communication failures. A graph can be visualized as a connected (by edges) set of entities (nodes). Intuitively, more the correlation between the soil moisture values in two locations more should be the chance of them to be connected in the graph. Recently, graph representation learning, or more specifically graph neural networks (GNNs) [Wu et al., 2019; Kipf and Welling, 2017; Bandyopadhyay and Peter, 2021] are able to achieve state-of-the-art performance on several learning tasks on graph. GNNs are also proposed to operate on dynamic graphs for traffic forecasting [Li et al., 2018; Chen et al., 2020] and social networks [Pareja et al., 2020]. However, these GNN based approaches cannot be used directly for modeling soil moisture. Unlike social networks where the graph structure is explicitly given [Karrer and Newman, 2011], there is no ground truth graph structure given as an input for the problem of spatio-temporal data modeling. As discussed before, it is possible that the correlation between soil moisture values in two nearby locations is negligible due to multiple hidden factors. Thus, we also need to learn the graph structure of the problem along with the prediction of soil moisture. Recently, research is conducted on graph structure learning using GNNs [Zhu et al., 2021]. However, those approaches are often limited to graphs without any temporal aspect and parameterized over the entries of the discrete adjacency matrix which make the optimization computationally expensive. As discussed in Section 3.3, we tackle these problems in a simple and effective way by introducing multiple regularizers. Following are the novel contributions we make in this paper:
- We pose the problem of soil moisture forecasting as a semi-supervised learning problem on dynamic graphs to jointly capture the varying degrees of spatial and temporal dependencies. As no ground truth graph structure is given as an input, we learn and update the sequence of graph structures in an end-to-end fashion.
- We propose a novel dynamic graph neural network, which is referred as DGLR (Dynamic Graph Learning through Recurrent graph neural network).
- We curate two real world soil moisture datasets. The source code of DGLR and the datasets are available at https://github.com/AnoushkaVyas/DGLR.
2 ProblemFormulation
We are given a set of N locations indexed by the set [N] = {1, 2, · · · ,N} from a geographic region. There are [T] = {1, 2, · · · , T} time steps. For each time step t, ground truth soil moisture (SM) values are given for a subset of locations N t tr ⊆ [N]. Please note that N t1 tr may be different fromN t2 tr for t1 ̸= t2 because of the presence of missing SM values.
We use sti ∈ R to denote the soil moisture at location i and time step t. For each location i and time step t, there are some D input features (such as temperature, relative humidity, precipitation, NDVI, etc.) available which might be useful to predict soil moisture. Let us denote those feature by an attribute vector xti ∈ RD , ∀i ∈ [N], t ∈ [T]. We also assume that the geographic distance between any two locations are given. Let us use dij to denote the distance between two locations i and j. Given all these information, our goal is to predict (forecast) the soil moisture at time step T +1 for each location i ∈ [N], such that the forecasting model considers both past soil moisture and input feature values, and also able to learn and exploit the relation between different locations in their soil moisture values.
In practice, retraining the model for forecasting soil moisture for every time step in future is expensive. So for our experiments in Section 4, we train (including validation) the models roughly on the first 70% to 80% of the time interval and predict soil moisture on the rest.
3 Solution Approach
There are multiple components of our integrated solution DGLR. Please note that all the parameters are trained in an end-to-end fashion. We explain each component below.
3.1 Initial Dynamic Graph Formulation
As explained in Section 1, there is no explicit graph structure given for the problem of soil moisture forecasting. To apply graph neural network in the first iteration, we use the following heuristic to form an initial graph structure. First, for each location i ∈ [N], we form a node (indexed by i) in the graph. Intuitively, if two locations are very close by, there soil moisture values can be more correlated compared to the points which are far away (there are exceptions to this and our learning algorithm is going to handle those). So, we connect any two nodes by an undirected and unweighted edge in the graph if the distance between the two corresponding locations dij is less than some pre-defined threshold θ. We also create a self-loop for every node in the graph. We assign attribute vector xti ∈ RF (as discussed in Section 2) to node i at time t. According to this construction, the link structure of the graph is same across different time steps, but node features are changing. Thus, the constructed graph is dynamic in nature 1 . Let us denote the set of graphs as {G1 , · · · ,GT }, where Gt = (V,Et ,Xt ) is the graph 2 at time step t and V = [N]. We denote the adjacency matrix of Gt as At . We also row-normalize the adjacency matrix by dividing each row with the degree of the corresponding node.
3.2 Temporal Graph Neural Network
Given a dynamic graph, we develop a temporal graph neural network which can generate embedding of a node in each time step and also use that to forecast soil moisture. Each layer of the proposed temporal graph neural network has two major components. There is a self-attention based GNN (with shared parameters) similar to [Veliˇckovi´c et al., 2018] which works on each graph, thus capturing the spatial dependency between the nodes. The updated node embeddings from the GNN is fed to a RNN which connects graphs over different time steps to capture the temporal dependency of soil moisture. The layer is formally discussed below.
1 A dynamic or temporal graph is a sequence of (correlated) graphs over time.
2 Initially, the edge set is same for all the graphs, but they will change during the course of learning.
For a graph Gt , we use a trainable parameter matrix W (shared over graphs ∀t ∈ [T]) to transform the initial feature vector xti as Wxti . As different neighboring locations may have significantly different impact on the soil moisture of a location, we use a trainable attention vector a ∈ R2K to learn the importance αij for any two neighboring nodes in a graph as follows:
where NGt (i) is the neighboring nodes of i (including i itself) in the graph Gt , · represents dot product between the two vectors and || is the vector concatenation. These normalized importance parameters are used to update the node features as:
where Atij is the (i, j)the element of At , i.e., weight of the edge (i, j) in Gt .
The sequence of updated node embeddings hti of a node i over different time steps are fed to a Gated Recurrent Unit (GRU) [Chung et al., 2014], which is a popularly used recurrent neural network. The GRU unit for ith node at time step t takes the GNN output hti (from Equation 2) and the GRU output ht-1 i to update hti , as shown below 3 .
where are update and reset gates of GRU at time t, respectively. W iU ,W iR,W iH , P iU , P iR, P iH ,BiU ,BiR,BiH are trainable parameters of GRU for the node i. Please note that we have not shared the parameters of GRUs for different nodes. This helps to boost the performance as the temporal trend of soil moisture values are quite different in different locations. The above completes the description of a GNN+GRU layer of our temporal graph neural network. The output of the GRU of a layer is fed as input to the next layer of GNN. Two such layers of GNN-GRU pair are used for all our experiments. We denote Ht = [ht1 · · · htN ]Trans , ∀t ∈ [T ].
For soil moisture prediction at time t, node embeddings from the final layer GRU are used. The node embeddings from t - w to t - 1 are used where w is a window of time steps. We concatenate ht-w i , · · · , ht-1 i and pass the vector to a fully connected layer with ReLU activation to predict the soil moisture of ith node at time t, which is denoted as ˆ sti . The window w is a sliding window with stride 1. The loss of soil moisture prediction is calculated as:
3 We use the same notation hti as the output of both GNN and GRU. But they update it sequentially.
3.3 Updating the Dynamic Graph Structures
In Section 3.1, we use a simple heuristic to form the initial graph which may not always reflect the actual spatial dependency of soil moisture values. In this section, we try to learn the link structure between different nodes to improve the quality of the graph such that it facilitates soil moisture prediction. Graph structure learning has received attention in recent literature. But a wide varieties of approaches are only limited to static graphs without temporal aspects and parameterize all the entries of the adjacency matrix (i.e., learning edges between the nodes) which makes the optimization combinatorial in nature [Fatemi et al., 2021; Selvan et al., 2020; Shang et al., 2021]. Our approach is quite feasible as we learn the temporal graph structures via node embeddings by introducing simple regularizers as discussed below.
First, we reconstruct the adjacency matrix ˆ At of the graph Gt by the similarity of the node embeddings. Formally, we obtain ˆ At from the node embedding matrix Ht as:
Thus, Atij (weight of an edge) is the dot product of the two corresponding node embeddings hti = Ht i: and htj = Ht j: . The element-wise use of activation function ReLU(·) ensures that reconstructed edge weights are non-negative and thus can be used in the message passing framework of GNN. Similar to At , we also row-normalize ˆ At by degrees of the nodes. However, the reconstructed graph can be noisy if the initially obtained node embeddings are erroneous. To avoid that, we use following regularization terms.
Graph Closeness. Initially constructed graph with adjacency structure At , ∀t ∈ [T], though not perfect, is easy to explain and intuitive as soil moisture values in close by regions tend to be correlated. So we want the reconstructed graph ˆ At not to move very far away fromAt . To ensure that, we use the following graph closeness regularization:
One can use any distance function between the matrices such as KL divergence or any matrix norms. We use binary cross entropy between At and ˆ At as that produces better results.
Feature Smoothness. As explained in Section 1, features like weather parameters, vegetation type of the field have significant impact on soil moisture. So, locations having similar features often exhibit similar soil moisture values. It is not necessary that these locations have to be close to each other through geographic distance. Thus, we aim to connect such locations in the link structure of the graphs by using the feature smoothness regularizer as shown below:
Minimizing above ensures that for any time step t ∈ [T], if feature vectors for two nodes i and j are similar, i.e., ||xti -xtj ||22 is less, the optimization would try to assign higher values to ˆ Atij . Similarly, if ||xti - xtj ||22 is high for two locations i and j at time step t, feature smoothness would try to lower the weight of the edge (i, j) even if their geographic distance dij is low.
Target Smoothness. Finally, if two nodes have similar target variable (which is soil moisture for this work), message passing between them improves the performance of graph neural network, as observed in [Hou et al., 2020]. For example in a graph dataset, if nodes which are directly connected by an edge also share same node labels, it helps the performance of node classification via message passing GNNs. As soil moisture is continuous in nature, we use the square of the difference of two soil moisture values to find their similarity. We calculate this regularization term only on the training set N t tr for each time step t, where ground truth soil moisture is available.
Again, minimizing target smoothness ensures that less edge weights are assigned to a node pair where nodes have very different soil moisture values. Thus, during the application of GNN, it avoids mixing features which lead to different types of soil moisture values.
3.4 Joint Optimization and Training
There are multiple loss components in the overall solution of DGLR. So, we form the final loss function of DGLR by taking a linear combination of all as shown below.
where α1, α2, α3, α4 ∈ R+ are hyperparameters. WG and ΘR contain the trainable parameters of GNN and RNN layers respectively. In contrast to existing works which solve graph structure learning as an expensive approximation of a combinatorial optimization problem [Jin et al., 2020; Selvan et al., 2020], the variables in the optimization problem in Equation 12 are only the parameters of GNN and RNNs. Please note that we do not minimize Equations 9-11 directly with respect to the reconstructed adjacency matrix ˆ A, rather it is always calculated as ˆ At = ReLU(HtHtTrans) (Equation 8) (followed by row normalisation). Thus, instead of solving task learning (which in this case is predicting soil moisture) and graph structure learning as alternating minimization, we jointly solve both in the framework of neural networks using ADAM [Kingma and Ba, 2014].
Once we obtain the reconstructed adjacency matrix ˆ At after optimizing Equation 12, we use ˆ At , along with node feature matrices Xt , ∀t ∈ [T] for the next iteration of DGLR. The pseudo code of DGLR is presented in Algorithm 1.
Please note that DGLR is semi-supervised in nature. For example, there can be examples in the training where soil moisture value is not present due to some loss of information or faulty sensors, but other feature information is present. In a conventional supervised setup, such unlabeled examples (without ground truth) are ignored in the training. But in DGLR, both labeled and unlabeled examples are used to propagate information through the graph neural networks (Equation 2). Unlabeled examples can also contribute in the training loss function components such as Equations 9 and 10. Because of the semi-supervised nature, DGLR can work well even with lesser amount of labeled data or missing data, as shown in Section 4.3.
Computation of the GNNs takes O(MTDK) time, where M is the average number of edges in the initial and reconstructed graphs over time. GRU takes another O(NTK) time to generate embeddings. Finally, the loss components collectively takes O(N 2TK) time. Hence, each iteration of DGLR takes O((N 2 + MD)TK) time. One can reduce the runtime of graph update regularizers by adding restriction on two nodes to get connected by an edge if their physical distance is more than some threshold, particularly for larger datasets. Besides, forming a graph across locations which are very far from each other does not make sense because of the significant change of input features, landscape, soil types, etc. Hence, DGLR can be used for real-world soil moisture prediction.
4 Experimental Section
4.1 Datasets and Experimental Setup
In this section, we summarize the datasets, baselines and the setup used for experiments 4 . Obtaining ground truth soil moisture is expensive due to the cost of physical sensors and most of the existing works from agriculture use their private and often interpolated datasets. So, we have curated two soil moisture datasets and the associated features from multiple sources. We refer them as Spain and USA. We use 6 input features to each location for each time step for Spain and 15 input features for USA. For Spain, they are NDVI obtained from MODIS, SAR back scattering coefficients VV and VH from Sentinel 1, weather parameters consisting of temperature, relative humidity and precipitation. Locally sensed soil moisture is collected from REMEDHUS [Sanchez et al., 2012] for Spain. For USA, the features (soil temperature, weather data, etc.) and soil moisture data are obtained from the SCAN network.
We have used a diverse set of baselines algorithms like SVR [Drucker et al., 1997] and SVR-Shared (for all the Shared models the parameters being shared for all the stations
4 More details can be found in the longer version of the work at https://arxiv.org/abs/2012.03506
Algorithm 1 DGLR
Input: Soil moisture locations [N] and distances dij, ∀i, j ∈ [N] between them. Temporal attribute matrix Xt = {xti | ∀i ∈ [N]} for each time step t ∈ [T +L]. Ground truth soil moisture values for (a subset of) locations from time 1, · · · , T. Window length w.
Output: Predict soil moisture values of all the locations from T +1, · · · , T +L.
Training
- 1: Construct an initial attributed graph Gt with normalized adjacency matrix At and node attribute matrix Xt for each time t ∈ [T ] where each node represents one location (Section 3.1).
- 2: Set ˜ At = At , ∀t ∈ [T ]
- 3: for pre-defined number of iterations do
- 4: Pass ˜ At and Xt to two layers of GNN+RNN pairs (Section 3.2) to generate all the node embeddings, ∀t ∈ [T ].
- 5: Concatenate ht-w i , · · · , ht-1 i and pass it to a fully connected layer to predict soil moisture ˆ sti, ∀i and ∀t ∈ {w + 1, · · · , T}
- 6: Update the parameters of GNN and RNNs by minimizing the losses at Equation 12.
- 7: Obtain ˆ At by Equation 8, followed by row normalization and set ˜ At = ˆ At , ∀t ∈ [T ]
- 8: end for Soil Moisture Prediction
- 9: Pass the reconstructed graph from the last time step of training, along with attribute matrices Xt-w · · · Xt-1 to the trained GNN+RNN model to predict soil moisture at time t, t = T +1, · · · , T +L.
in a dataset), Spatial-SVR where spatial information in SVR is used by concatenating a node's feature with the features of its nearest k neighbors, ARIMA [Hannan and Rissanen, 1982], RNN [Chung et al., 2014] and RNN-Shared, popular spatio-temporal GNN algorithms like DCRNN [Li et al., 2018] and EvolveGCN [Pareja et al., 2020].
Hyperparameters are tuned by using the validation set and test results are reported at the best validation epoch. The embedding dimension is set to 10 for Spain and 20 for USA. We run the algorithms for 2000 epochs on Spain and 500 epochs on USA. We used three different metrics during the test period of each time series. They are Root Mean Square Error (RMSE), Symmetric Mean Absolute Percentage Error (SMAPE) and Correlation Coefficient.
4.2 Results and Analysis
We run each algorithm 10 times on each dataset and reported the average metrics over all the locations. Table 1 shows the performance of all the baselines, along with DGLR and its variants. First, we can see that algorithms with non-shared parameters across the locations in a dataset performs better than their counterparts with shared parameters. This is because soil moisture patterns in a dataset varies significantly from one location to other. Next, the performance of dynamic GNN based baselines like DCRNN and EvolveGCN are not always better than a deep sequence modeling technique like RNN. This shows that using spatial information (via graph) may not always lead to a better performance, especially when the initially constructed graph is noisy. Finally, we find that
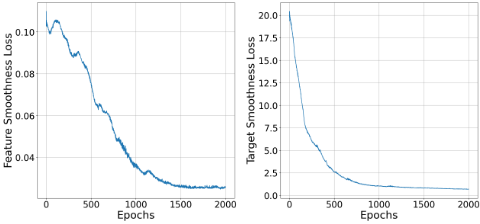
- (a) Feature Smoothness
- (b) Target Smoothness
Figure 1: 1a and 1b show loss components to depict the evolution of the graph structure of Spain over the iterations of DGLR (best seen in color).
DGLR is able to achieve better performance than all the baseline algorithms considered.
Comparing the performance of DGLR with its variants, we can see the importance of different components of DGLR such as non-shared parameters of the GRU layers across locations, the importance of learning the graph structure and the role of feature and target smoothness regularizers.
4.3 Sensitivity toMissing Soil Moisture Values
The datasets that we used here do not have any missing soil moisture values. But for real-world applications, it is possible to have missing soil moisture values in between due to problem in the local sensors or in the communication networks. DGLR, being a semi-supervised approach due to use of graph neural networks, can be trained on labeled and unlabeled data points together. To see the impact of missing ground truth values in the training, we randomly remove p% soil moisture values from the training data, where p ∈ {10, 20, 30}. Table 2 shows the test set performance of DGLR with different proportions of missing soil moisture values in the training. Please note that we still use the input features from those locations with missing soil moisture values and they do participate in the message passing framework of GNN. From Table 2, the performance of DGLR drops very slowly with more amount of missing soil moisture values in the training. In fact, its performance with 20% missing values is still better than most of the baselines in Table 1 with no missing values. So, it is clear that DGLR is quite robust in nature, and thus can be applicable for real-world soil moisture prediction.
4.4 Sensitivity to Initially Constructed Graph Structure
We use a simple heuristic to construct an initial graph in Section 3.1 on which we apply the proposed dynamic GNN to forecast soil moisture and update the graph structures over the iterations. In this section, we check the sensitivity of DGLR on different initially constructed graph. To do this, we vary the threshold parameter θ (Section 3.1). As the value of θ increases, nodes with larger distance will get connected in the initial graph, increasing the overall density. Interestingly, Table 3 shows that the performance of DGLR does not change much with different values of θ. This happens because DGLR also learns the optimal graph structure for soil moisture prediction. Thus, it is less sensitive to the heuristic-based initially constructed graph.
| Spain | USA | |||||
|---|---|---|---|---|---|---|
| Algorithms | RMSE (↓) | SMAPE% (↓) | Correlation (↑) | RMSE (↓) | SMAPE% (↓) | Correlation (↑) |
| SVR-Shared | 0.061 ± 0.004 | 33.654 ± 1.236 | 0.020 ± 0.001 | 12.332 ± 0.848 | 39.013 ± 3.395 | 0.287 ± 0.031 |
| SVR | 0.052 ± 0.005 | 23.840 ± 2.453 | 0.083 ± 0.002 | 10.461 ± 0.718 | 27.377 ± 3.314 | 0.354 ± 0.031 |
| Spatial-SVR | 0.052 ± 0.007 | 23.752 ± 1.562 | 0.150 ± 0.013 | 10.245 ± 1.567 | 26.710 ± 4.049 | 0.351 ± 0.049 |
| ARIMA | 0.041 ± 0.008 | 19.002 ± 0.872 | 0.010 ± 0.001 | 9.290 ± 1.110 | 27.785 ± 1.306 | 0.159 ± 0.016 |
| RNN-Shared | 0.039 ± 0.003 | 23.443 ± 1.996 | 0.585 ± 0.048 | 7.814 ± 0.442 | 30.880 ± 2.355 | 0.191 ± 0.041 |
| RNN | 0.039 ± 0.003 | 21.722 ± 1.385 | 0.529 ± 0.049 | 7.338 ± 0.346 | 27.833 ± 1.812 | 0.273 ± 0.046 |
| DCRNN | 0.061 ± 0.003 | 31.832 ± 2.363 | 0.588 ± 0.062 | 8.161 ± 0.762 | 25.213 ± 1.762 | 0.393 ± 0.015 |
| EvolveGCN | 0.061 ± 0.004 | 31.789 ± 2.554 | 0.731 ± 0.022 | 8.526 ± 0.519 | 27.717 ± 1.919 | 0.415 ± 0.038 |
| DGLR (Shared) | 0.037 ± 0.003 | 17.533 ± 1.000 | 0.752 ± 0.020 | 7.526 ± 0.519 | 20.700 ± 1.210 | 0.493 ± 0.031 |
| DGLR (w/o SL) | 0.035 ± 0.003 | 15.599 ± 0.940 | 0.753 ± 0.017 | 6.970 ± 0.356 | 18.360 ± 0.987 | 0.517 ± 0.023 |
| DGLR (w/o Sm) | 0.033 ± 0.002 | 19.835 ± 1.005 | 0.759 ± 0.018 | 6.721 ± 0.176 | 17.991 ± 1.211 | 0.533 ± 0.013 |
| DGLR (full model) | 0.031 ± 0.001 | 15.583 ± 1.008 | 0.764 ± 0.017 | 6.454 ± 0.111 | 17.002 ± 0.987 | 0.566 ± 0.008 |
| Missing | Spain | ||
|---|---|---|---|
| SM% | RMSE (↓) | SMAPE% (↓) | Correlation (↑) |
| 0% | 0.031 ± 0.001 | 15.583 ± 1.008 | 0.764 ± 0.017 |
| 10% | 0.035 ± 0.004 | 18.121 ± 1.430 | 0.750 ± 0.033 |
| 20% | 0.039 ± 0.002 | 18.864 ± 1.516 | 0.738 ± 0.027 |
| 30% | 0.039 ± 0.006 | 18.962 ± 1.112 | 0.661 ± 0.047 |
| Distance | Spain | ||
|---|---|---|---|
| Threshold (km) | RMSE (↓) | SMAPE% (↓) | Correlation (↑) |
| 8 | 0.034 ± 0.002 | 16.418 ± 0.810 | 0.752 ± 0.042 |
| 12 | 0.032 ± 0.003 | 16.441 ± 1.106 | 0.752 ± 0.028 |
| 16 | 0.031 ± 0.001 | 15.583 ± 1.008 | 0.764 ± 0.017 |
| 20 | 0.032 ± 0.004 | 16.556 ± 1.099 | 0.754 ±0.054 |
4.5 Evolution of Graph Structure
One key component of DGLR is to learn and update the graph structure as it predicts the soil moisture values (Section 3.3). Feature Smoothness (FS) loss (Eq. 10) measures if nodes having dissimilar features are connected. Target Smoothness (TS) loss (Eq. 11) measures if nodes having dissimilar soil moisture values are connected. For Spain, these losses over different iterations (Step 3 of Alg. 1) of DGLR are shown in Figure 1. Both FS loss and TS loss decrease significantly after the initial iterations and stabilize during the end of training. Thus, DGLR is able to connect nodes with similar features and similar soil moisture values by edges over the training such a way that it also helps to predict the soil moisture better.
5 Discussion and Conclusion
In this work, we have addressed the problem of soil moisture modeling and prediction which is of immense practical importance. We propose a semi-supervised dynamic graph neural network which also learns the temporal graph structures iteratively to predict soil moisture. Our solution is robust in nature with respect to missing ground truth soil moisture values and also able to achieve state-of-the-art performance for data driven soil moisture prediction on real-world soil moisture datasets. We hope that our solution along with the publicly available source code and datasets would help further AI research in this direction. In future, we want to apply this solution for other types of spatio-temporal data with different types of domain specific challenges. We will also check the impact of our solution in broader sustainability aspects such as improving production and quality of crops, preserving natural resources, etc.
@inproceedings{ijcai2022p720,
  title     = {Dynamic Structure Learning through Graph Neural Network for Forecasting Soil Moisture in Precision Agriculture},
  author    = {Vyas, Anoushka and Bandyopadhyay, Sambaran},
  booktitle = {Proceedings of the Thirty-First International Joint Conference on
               Artificial Intelligence, {IJCAI-22}},
  publisher = {International Joint Conferences on Artificial Intelligence Organization},
  editor    = {Luc De Raedt},
  pages     = {5185--5191},
  year      = {2022},
  month     = {7},
  note      = {AI for Good},
  doi       = {10.24963/ijcai.2022/720},
  url       = {https://doi.org/10.24963/ijcai.2022/720},
}
TY - CPAPER TI - Dynamic Structure Learning through Graph Neural Network for Forecasting Soil Moisture in Precision Agriculture AU - Vyas, Anoushka AU - Bandyopadhyay, Sambaran T2 - Proceedings of the Thirty-First International Joint Conference on Artificial Intelligence, IJCAI-22 PB - International Joint Conferences on Artificial Intelligence Organization PY - 2022 SP - 5185 EP - 5191 DO - 10.24963/ijcai.2022/720 UR - https://doi.org/10.24963/ijcai.2022/720 ER -Copied
Machine-readable versions of this paper, for tools and AI agents:





