
TFLOP: Table Structure Recognition Framework with Layout Pointer Mechanism
Proceedings of the Thirty-Third International Joint Conference on Artificial Intelligence. Main Track. Pages 947-955.
https://doi.org/10.24963/ijcai.2024/105
Keywords
- Computer Vision: CV: Applications
- Natural Language Processing: NLP: Applications
- Computer Vision: CV: Recognition (object detection, categorization)
Abstract
Table Structure Recognition (TSR) is a task aimed at converting table images into a machine-readable format (e.g. HTML), to facilitate other applications such as information retrieval.
Recent works tackle this problem by identifying the HTML tags and text regions, where the latter is used for text extraction from the table document. These works however, suffer from misalignment issues when mapping text into the identified text regions. In this paper, we introduce a new TSR framework, called TFLOP (TSR Framework with LayOut Pointer mechanism), which reformulates the conventional text region prediction and matching into a direct text region pointing problem. Specifically, TFLOP utilizes text region information to identify both the table's structure tags and its aligned text regions, simultaneously. Without the need for region prediction and alignment, TFLOP circumvents the additional text region matching stage, which requires finely-calibrated post-processing. TFLOP also employs span-aware contrastive supervision to enhance the pointing mechanism in tables with complex structure. As a result, TFLOP achieves the state-of-the-art performance across multiple benchmarks such as PubTabNet, FinTabNet, and SynthTabNet. In our extensive experiments, TFLOP not only exhibits competitive performance but also shows promising results on industrial document TSR scenarios such as documents with watermarks or in non-English domain. Source code of our work is publicly available at: https://github.com/UpstageAI/TFLOP.
- [Carion et al., 2020] Nicolas Carion, Francisco Massa, Gabriel Synnaeve, Nicolas Usunier, Alexander Kirillov, and Sergey Zagoruyko. End-to-end object detection with transformers. In European conference on computer vision, pages 213-229. Springer, 2020.
- [Deng et al., 2019] Yuntian Deng, David Rosenberg, and Gideon Mann. Challenges in end-to-end neural scientific table recognition. In 2019 International Conference on Document Analysis and Recognition (ICDAR), pages 894- 901. IEEE, 2019.
- [Guo et al., 2022] Zengyuan Guo, Yuechen Yu, Pengyuan Lv, Chengquan Zhang, Haojie Li, Zhihui Wang, Kun Yao, Jingtuo Liu, and Jingdong Wang. Trust: An accurate and end-to-end table structure recognizer using splitting-based transformers. arXiv preprint arXiv:2208.14687, 2022.
- [He et al., 2017] Kaiming He, Georgia Gkioxari, Piotr Dollár, and Ross Girshick. Mask r-cnn. In Proceedings of the IEEE international conference on computer vision, pages 2961-2969, 2017.
- [Huang et al., 2023] Yongshuai Huang, Ning Lu, Dapeng Chen, Yibo Li, Zecheng Xie, Shenggao Zhu, Liangcai Gao, and Wei Peng. Improving table structure recog- nition with visual-alignment sequential coordinate mod- eling. In Proceedings of the IEEE/CVF Conference on Computer Vision and Pattern Recognition, pages 11134- 11143, 2023.
- [Khosla et al., 2020] Prannay Khosla, Piotr Teterwak, Chen Wang, Aaron Sarna, Yonglong Tian, Phillip Isola, Aaron Maschinot, Ce Liu, and Dilip Krishnan. Supervised con- trastive learning. Advances in neural information process- ing systems, 33:18661-18673, 2020.
- [Kim et al., 2022] Geewook Kim, Teakgyu Hong, Moonbin Yim, JeongYeon Nam, Jinyoung Park, Jinyeong Yim, Wonseok Hwang, Sangdoo Yun, Dongyoon Han, and Se- unghyun Park. Ocr-free document understanding trans- former. In European Conference on Computer Vision, pages 498-517. Springer, 2022.
- [Lewis et al., 2019] Mike Lewis, Yinhan Liu, Naman Goyal, Marjan Ghazvininejad, Abdelrahman Mohamed, Omer Levy, Ves Stoyanov, and Luke Zettlemoyer. Bart: De- noising sequence-to-sequence pre-training for natural lan- guage generation, translation, and comprehension. arXiv preprint arXiv:1910.13461, 2019.
- [Lin et al., 2022] Weihong Lin, Zheng Sun, Chixiang Ma, Mingze Li, Jiawei Wang, Lei Sun, and Qiang Huo. Tsr- former: Table structure recognition with transformers. In Proceedings of the 30th ACM International Conference on Multimedia, pages 6473-6482, 2022.
- [Liu et al., 2021a] Hao Liu, Xin Li, Bing Liu, Deqiang Jiang, Yinsong Liu, Bo Ren, and Rongrong Ji. Show, read and reason: Table structure recognition with flexible con- text aggregator. In Proceedings of the 29th ACM Interna- tional Conference on Multimedia, pages 1084-1092, 2021.
- [Liu et al., 2021b] Ze Liu, Yutong Lin, Yue Cao, Han Hu, Yixuan Wei, Zheng Zhang, Stephen Lin, and Baining Guo. Swin transformer: Hierarchical vision transformer using shifted windows. In Proceedings of the IEEE/CVF in- ternational conference on computer vision, pages 10012- 10022, 2021.
- [Liu et al., 2022] Hao Liu, Xin Li, Bing Liu, Deqiang Jiang, Yinsong Liu, and Bo Ren. Neural collaborative graph ma- chines for table structure recognition. In Proceedings of the IEEE/CVF Conference on Computer Vision and Pat- tern Recognition, pages 4533-4542, 2022.
- [Lu et al., 2021] Ning Lu, Wenwen Yu, Xianbiao Qi, Yihao Chen, Ping Gong, Rong Xiao, and Xiang Bai. Master: Multi-aspect non-local network for scene text recognition. Pattern Recognition, 117:107980, 2021.
- [Lysak et al., 2023] Maksym Lysak, Ahmed Nassar, Niko- laos Livathinos, Christoph Auer, and Peter Staar. Opti- mized table tokenization for table structure recognition. arXiv preprint arXiv:2305.03393, 2023.
- [Lyu et al., 2023] Pengyuan Lyu, Weihong Ma, Hongyi Wang, Yuechen Yu, Chengquan Zhang, Kun Yao, Yang Xue, and Jingdong Wang. Gridformer: Towards accurate table structure recognition via grid prediction. In Proceed- ings of the 31st ACM International Conference on Multi- media, pages 7747-7757, 2023.
- [Ma et al., 2023] Chixiang Ma, Weihong Lin, Lei Sun, and Qiang Huo. Robust table detection and structure recogni- tion from heterogeneous document images. Pattern Recog- nition, 133:109006, 2023.
- [Nassar et al., 2022] Ahmed Nassar, Nikolaos Livathinos, Maksym Lysak, and Peter Staar. Tableformer: Table struc- ture understanding with transformers. In Proceedings of the IEEE/CVF Conference on Computer Vision and Pat- tern Recognition, pages 4614-4623, 2022.
- [OpenAI, 2023] OpenAI. Gpt-4v(ision) system card. 2023.
- [Paliwal et al., 2019] Shubham Singh Paliwal, D Vish- wanath, Rohit Rahul, Monika Sharma, and Lovekesh Vig. Tablenet: Deep learning model for end-to-end table detec- tion and tabular data extraction from scanned document images. In 2019 International Conference on Document Analysis and Recognition (ICDAR), pages 128-133. IEEE, 2019.
- [Qiao et al., 2021] Liang Qiao, Zaisheng Li, Zhanzhan Cheng, Peng Zhang, Shiliang Pu, Yi Niu, Wenqi Ren, Wenming Tan, and Fei Wu. Lgpma: Complicated table structure recognition with local and global pyramid mask alignment. In International conference on document anal- ysis and recognition, pages 99-114. Springer, 2021.
- [Raja et al., 2020] Sachin Raja, Ajoy Mondal, and CV Jawa- har. Table structure recognition using top-down and bottom-up cues. In Computer Vision-ECCV 2020: 16th European Conference, Glasgow, UK, August 23-28, 2020, Proceedings, Part XXVIII 16, pages 70-86. Springer, 2020.
- [Schreiber et al., 2017] Sebastian Schreiber, Stefan Agne, Ivo Wolf, Andreas Dengel, and Sheraz Ahmed. Deepdesrt: Deep learning for detection and structure recognition of tables in document images. In 2017 14th IAPR interna- tional conference on document analysis and recognition (ICDAR), volume 1, pages 1162-1167. IEEE, 2017.
- [Shen et al., 2023] Huawen Shen, Xiang Gao, Jin Wei, Liang Qiao, Yu Zhou, Qiang Li, and Zhanzhan Cheng. Divide rows and conquer cells: Towards structure recognition for large tables. In Proceedings of the Thirty-Second Inter- national Joint Conference on Artificial Intelligence, pages 1369-1377, 2023. IJCAI
- [Tensmeyer et al., 2019] Chris Tensmeyer, Vlad I Morariu, Brian Price, Scott Cohen, and Tony Martinez. Deep split- ting and merging for table structure decomposition. In 2019 International Conference on Document Analysis and Recognition (ICDAR), pages 114-121. IEEE, 2019.
- [Wang et al., 2019a] Wenhai Wang, Enze Xie, Xiang Li, Wenbo Hou, Tong Lu, Gang Yu, and Shuai Shao. Shape robust text detection with progressive scale expansion net- work. In Proceedings of the IEEE/CVF conference on computer vision and pattern recognition, pages 9336- 9345, 2019.
- [Wang et al., 2019b] Yue Wang, Yongbin Sun, Ziwei Liu, Sanjay E Sarma, Michael M Bronstein, and Justin M Solomon. Dynamic graph cnn for learning on point clouds. ACM Transactions on Graphics (tog), 38(5):1-12, 2019.
- [Ye et al., 2021] Jiaquan Ye, Xianbiao Qi, Yelin He, Yihao Chen, Dengyi Gu, Peng Gao, and Rong Xiao. Pingan- vcgroup's solution for icdar 2021 competition on scientific literature parsing task b: table recognition to html. arXiv preprint arXiv:2105.01848, 2021.
- [Zhang et al., 2022] Zhenrong Zhang, Jianshu Zhang, Jun Du, and Fengren Wang. Split, embed and merge: An accurate table structure recognizer. Pattern Recognition, 126:108565, 2022.
- [Zheng et al., 2021] Xinyi Zheng, Douglas Burdick, Lucian Popa, Xu Zhong, and Nancy Xin Ru Wang. Global table extractor (gte): A framework for joint table identification and cell structure recognition using visual context. In Pro- ceedings of the IEEE/CVF winter conference on applica- tions of computer vision, pages 697-706, 2021.
- [Zhong et al., 2020] Xu Zhong, Elaheh ShafieiBavani, and Antonio Jimeno Yepes. Image-based table recognition: data, model, and evaluation. In European conference on computer vision, pages 564-580. Springer, 2020.
References were extracted automatically from the PDF and may contain errors.
Full text extracted automatically from the PDF; figures, tables and equations may differ. The PDF is the version of record.
1 Introduction
Tables are prevalent across a wide spectrum of documents (e.g. business documents, academic papers) for their compact and efficient representation. Such compact representation, however, presents a significant challenge for direct machine parsing. Table Structure Recognition (TSR) aims to digitize table images into machine-readable format (e.g. HTML) representing their structure and text, allowing for various downstream applications such as information retrieval or table QA.
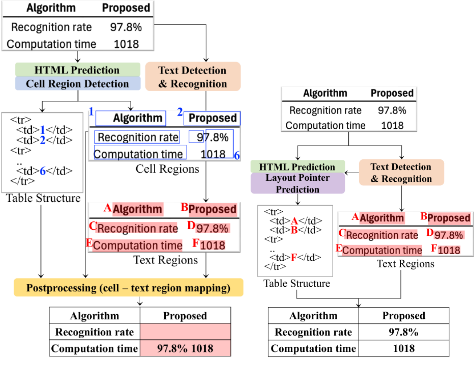
(a) Dual decoder framework
(b) TFLOP
Figure 1: Overview of two TSR frameworks. The dual decoder identifies table cell regions and their HTML structure, requiring further cell and text region mapping for the final output. In contrast, TFLOP utilizes text region information and directly identifies the HTML structure with its corresponding text region relations.
TSR often comprises of predicting two sets of structures before constructing the full table structure: logical and physical [Huang et al., 2023]. Logical structure represents the semantic organization and relational information between table cells, often represented in the form of HTML or LaTeX. Physical structure, on the other hand, represents the layout information of table cells such as their bounding boxes.
Recent works take on the image-to-text approach where both the logical and physical structures are predicted with the latter conditioning on the former. The physical structures (cell bounding boxes) are first mapped to text regions of the table, obtained using OCR engine or through PDF parsing, before combining the matched texts with the logical structure to form the full table. Despite its strong performance in logical structure prediction, these frameworks often suffer from misalignment issues where erroneous texts are matched due to imperfect alignment between the table text regions and the predicted cell bounding boxes. Such approaches require finely-calibrated post-processing during the matching of text regions for satisfactory results.
This work, TFLOP, aims to eliminate the need for heuristic-based bounding box matching by leveraging table text regions directly in the framework through layout pointer mechanism. TFLOP reformulates the original bounding box prediction problem to a bounding box pointing problem. In particular, instead of predicting the cell bounding boxes conditioned on the logical structure, it predicts the associations between the bounding boxes and logical sequence through pointer mechanism. TFLOP's pointer mechanism not only serves as a remedy to the misalignment issue but also eliminates the need for heuristics-based bounding box matching.
On top of misalignment issues, recognizing structures of tables with row or column spans (i.e. complex tables) is one of the key challenges of TSR. Capitalizing on the flexibility of our framework, TFLOP employs span-aware contrastive supervision when processing the table text regions to improve its recognition of complex tables. Based on the proposed pointer mechanism and span-aware contrastive supervision, TFLOP achieves state-of-the-art performance across popular TSR benchmarks.
In this work, we move beyond the benchmark datasets, and explore the versatility of TFLOP from the industrial perspective. We conduct extensive experiments and show that TFLOP not only has competitive performance but also the versatility in handling industrial document TSR scenarios such as watermarked documents or even non-English tables despite being trained exclusively on English tables.
The key contributions of our work are as follows:
- We propose a novel TSR framework with layout pointer mechanism which not only remedies the text region misalignment issue but also eliminates the necessity for post-processing when mapping text regions into the predicted cell bounding boxes.
- We also present span-aware contrastive supervision in our framework. This supervision enhances the model's ability in recognizing structures of complex tables involving row or column spans.
- TFLOP achieves the state-of-the-art performance across multiple popular TSR benchmarks.
- Beyond the benchmark performance, TFLOP has also shown competitive performance and versatility when dealing with industrial TSR document scenarios such as tables with watermark or in non-English domain.
2 RelatedWork
TSR methods cover different variations of handling both logical and physical structure of tables. These methods can be largely categorised into two groups: detection-based and image-to-text methods.
2.1 Detection-based TSRMethods
Detection-based TSR is one of the common approaches that recognizes the table structure by leveraging on the table features detected such as separation lines or cell-level features. These methods typically proceed with physical structure understanding first before reasoning with the corresponding logical structure for TSR.
Grid-based approach represents methods which utilise the grid representation based on the detected table features. Earlier works [Schreiber et al., 2017; Paliwal et al., 2019] detects row and column masks through segmentation-based methods before aggregating them to form the table structure. SPLERGE [Tensmeyer et al., 2019] then proposed split-andmerge pipeline which first detects the grid structure matching the table before merging adjacent cells to handle spanning entries. Follow-up works improved on top of this grid representation such as TRUST [Guo et al., 2022] which proposed query-based splitting and vertex-based merging modules to improve spanning cell prediction, while SEM [Zhang et al., 2022] proposed aggregation of both visual and textual features in table grid generation. RobusTabNet [Ma et al., 2023] proposed a spatial CNN module which improved physical structure reasoning when predicting separation lines prior to cell grid detection. Follow-up work TSRFormer [Lin et al., 2022] reformulated the line prediction task as a regression problem instead of image segmentation through a two-stage DETR [Carion et al., 2020] based approach. Recent work, GridFormer [Lyu et al., 2023], proposed a new method which directly predicts the vertexes and edges of the table grid (logical structure) from the table image.
Cell-based approach is another type of detection-based methods where cell-level features (physical structure) are first detected, before classifying the relation between cells (logical structure) to form the full table structure. Some of the representative works include TabStructNet [Raja et al., 2020] and FLAG-Net [Liu et al., 2021a] which are end-to-end frameworks utilizing DGCNN architecture [Wang et al., 2019b] to model the relation between the detected cell-level features. More recently, Hetero-TSR [Liu et al., 2022] proposed NCGM which is designed to improve the cross-modality collaboration when handling complex TSR scenarios.
2.2 Image-to-Text based TSRMethods
Image-to-Text methods reformulate the TSR task as an image-to-sequence translation task where the table structure is represented as a text sequence (e.g HTML, LaTeX, etc.). Recent methods typically predict the logical structure of the table first before conditioning on it for physical structure prediction. The two predictions are then aggregated to form the full table structure.
Earlier image-to-text TSR works directly produced the full table structure such as the work [Deng et al., 2019] which modeled a LSTM-based table-to-LaTeX framework. Recent works on the other hand, transitioned to Transformer based sequence generation models which produced logical and physical structures separately before aggregating them for full table structure.
Notable examples of such works include [Ye et al., 2021; Nassar et al., 2022] which proposed Image Encoder Dual Decoder (IEDD) approach. In these works, after encoding the table image, HTML structure tags (logical structure) are first predicted by one of the decoders while the other conditioned on these tags to generate the cell bounding boxes (physical structure). These cell bounding boxes are subsequently mapped to text regions of tables obtained using OCR engines or through PDF parsing, before aggregating with the logical structure to complete the HTML sequence.
Follow-up works proposed different means to improve the dual decoder framework. VAST [Huang et al., 2023] proposed visual alignment loss to improve the physical structure prediction by enforcing detailed visual information in the decoding stage. Meanwhile, DRCC [Shen et al., 2023] proposed a semi-autoregressive approach which reduced the effect of error accumulation in both logical and physical structure generation.
While both of these works' contributions do improve the structure predictions, they both suffer from the inherent issue of bounding box misalignment. When mapping the predicted cell bounding boxes for text retrieval, misalignment between the bounding boxes and text regions of tables could result in erroneous table structure. As such, physical structure prediction based frameworks are susceptible to bounding box misalignment issues and require heuristic post-processing for satisfactory results.
3 Method
3.1 Overall Architecture
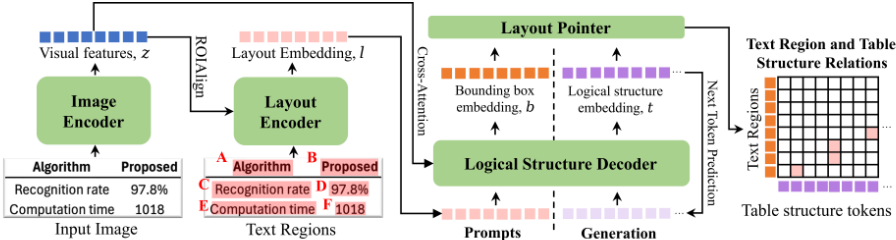
TFLOP comprises of four modules: image encoder, layout encoder, logical structure decoder, and layout pointer. Our framework receives a table image and its corresponding text regions which are either provided in cell-level annotations or obtained using off-the-shelf OCR engines.
TFLOP first extracts the visual features from the table image using the image encoder while embedding the text region bounding boxes with the layout encoder. The generated visual features and layout embedding are then processed by the logical structure decoder. The visual features are provided to the decoder in a cross-attention mechanism while the layout embedding is processed as context prompt for generating the logical structure sequence.
On top of generating the logical structure (e.g. HTMLtags) auto-regressively, the decoder's last hidden state is further processed by the layout pointer module, which associates the predicted table data tags (e.g. <td> for HTML, C for OTSL) with the corresponding text regions to form the full table structure. TFLOP architecture is illustrated in Figure 2.
3.2 Image Encoder
Motivated by the Donut architecture [Kim et al., 2022], we use Swin Transformer [Liu et al., 2021b] as TFLOP's image encoder. All table images are preprocessed into a fixed resolution and embedded into visual features, {zi|zi ∈ Rd , 1 ≤ i ≤ P}, where P is the number of image patches and d is the latent vector dimension.
3.3 Layout Encoder
Layout encoder comprises of MLP modules which embeds both the text region bounding boxes and the corresponding 2 x 2 ROIAlign [He et al., 2017] applied on the visual features, {zi}. These embeddings are aggregated to form the layout embeddings, {lj|lj ∈ Rd , 1 ≤ j ≤ B}, where B is the context length for layout embedding.
3.4 Logical Structure Decoder
Logical structure decoder generates sequence of table tags conditioned on the visual features, {zi}, and layout embedding, {lj}. TFLOP utilizes BART [Lewis et al., 2019] architecture and follows configurations similar to that of Donut [Kim et al., 2022]. TFLOP's decoder outputs a sequence of {yk|yk ∈ Rv , 1 ≤ k ≤ T} where T is the total number of table tags and v is the token vocabulary size. Cross-entropy loss, Lcls, is employed to supervise the decoder's tag classification.
Prior works' decoders [Shen et al., 2023; Huang et al., 2023; Nassar et al., 2022] generate logical structure sequence in the HTML format. Despite its long sequence, HTML representation is often used for its flexibility and wide coverage of tabular layouts. To reduce its long sequence length, [Huang et al., 2023; Ye et al., 2021] merged specific tags (e.g. <td></td>). TFLOP achieves similar effect by generating OTSL-tag sequences [Lysak et al., 2023] which have 1-to-1 mapping with the target HTML sequence.
3.5 Layout Pointer
Apart from generating a sequence of table tags, the decoder's last hidden state features, {hi|hi ∈ Rd , 1 ≤ i ≤ N}, are used in our layout pointer module. N is the sum of the number of bounding boxes (B) and the number of table tags (T).
Specifically, the feature sequence, {hi}Ni=1 , is first split into two sub-sequences: {bj}Bj=1 and {tk}Tk=1 . {bj}Bj=1 is a sequence of fixed-length B, representing the last hidden state features of the bounding boxes. {tk}Tk=1 , on the other hand, is a sequence of length T, representing the last hidden state features of the predicted table tags. These two sequence of features are then projected into {¯bj} and {¯ tk} through linear transformation (Equation 1). Among the table tag features, {¯ tk}, we define the indices of those which correspond to table data tags as set D. Layout pointer supervision is then applied as in Equation 2.
Lptr represents the loss for layout pointer supervision where ¯bj represents the projected feature of the j th bounding box and k∗ is the index of the table data tag corresponding to the j th bounding box. · and τ denote the dot product and the temperature hyper-parameter, respectively. It is worth noting that, the bounding box and the table tags have a one-to-one or a many-to-one relation as there could be one or more text bounding boxes present within a single table cell. As such, in Equation 2, Lptr is calculated by evaluating the negative loglikelihood for each of the B bounding boxes before taking their arithmetic mean.
It should also be noted that, it is possible for table data tags to not have any corresponding bounding boxes (i.e. empty table cell). To ensure provision of pointer supervision for all table data tags, a separate loss supervision Lempty ptr is applied to those without any corresponding bounding boxes as following:
¯b0 is the linear projection of a special embedding dedicated to empty table data tags. σ() and BCE() represents sigmoid activation function and Binary Cross-Entropy, respectively, while I(k′ ) represents binary label indicating whether k′ data tag is empty.
3.6 Span-aware Contrastive Supervision
To better address complex table structures (with rowspan or colspan), TFLOP adopts span-aware contrastive supervision across the bounding box embeddings, {bj}, to improve its tabular layout understanding. While prior works provide contrastive supervision on table elements both row-wise and column-wise, TFLOP takes a step further by introducing span-aware adjustments to this supervision.
Given a j th bounding box embedding bj , it is first projected using a linear layer to formˆbj (Equation 4), before evaluating its span-aware contrastive loss as shown in Equation 5.
| Target | Partial-Positive | �(�) = | + | |
| Positive | Negative | �(�) = | + | + |
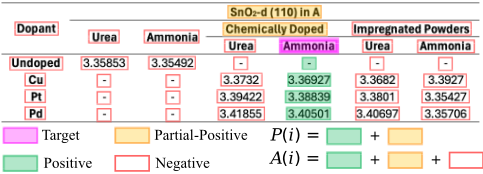
Lcontr,j represents the span-aware contrastive loss for the j th bounding box. This formulation is applicable to both rowspan and column-span supervision. Here, A(j) represents all the bounding boxes except the j th , P(j) represents all the bounding boxes of A(j) that are positive samples (i.e. either same row or column as the j th bounding box), and ˆbp and ˆba represent the projected bounding box embedding of P (j) and A(j), respectively. The above formulation follows similar to that of Supervised Contrastive Loss [Khosla et al., 2020] except for the span-coefficient cp(j).
Span-coefficient cp(j) denotes the degree of proximity between j th and p based on the span overlap between the two bounding boxes. For example, with reference to Figure 3, in column-wise contrastive supervision, the span-coefficient between the j th bounding box (pink) and a positive bounding box (green or yellow) can be formulated as:
Here, span() denotes the span count (either row or column) for the given bounding box, while overlap(x, y) denotes the number of overlap cells between the bounding box x and y. For example, span-coefficient of the bounding box of "Ammonia" against that of "Chemically Doped" in Figure 3 would be 1/(2 × 1).
It is worth noting that, when the span-coefficient is set to a constant value of 1 (i.e. uniform contrastive supervision), Lcontr,j reduces to the standard supervised contrastive loss formulation [Khosla et al., 2020].
3.7 Loss Function
TFLOP's training objective is composed of tag classification loss, layout pointer loss, and span-aware contrastive loss. Tag classification loss (Lcls) is evaluated using the negative-log likelihood of the table tag predictions, while layout pointer loss is a linear combination of Lptr and Lempty ptr . Span-aware contrastive loss is also a linear combination of Lrow contr,j and Lcol contr,j which denote row-wise and column-wise contrastive loss for the j th bounding box respectively.
| Methods | PubTabNet.Val | PubTabNet.Test | ||
|---|---|---|---|---|
| TEDS-S | TEDS | TEDS-S | TEDS | |
| TableMaster [2021] | - | - | - | 96.32 |
| LGPMA [2021] | 96.7 | 94.6 | - | - |
| TableFormer [2022] | 97.5 | - | 96.75 | 93.60 |
| VAST [2023] | - | - | 97.23 | 96.31 |
| RobusTabNet [2023] | 97.0 | - | - | - |
| DRCC [2023] | 98.9 | 97.8 | - | - |
| TFLOPBASE | 98.1 | 97.8 | 98.25 | 96.42 |
| TFLOPFULL | 98.3 | 98.0 | 98.38 | 96.66 |
4 Experiments
4.1 Datasets
To validate the effectiveness of our framework, experiments are conducted against three popular TSR benchmark datasets: PubTabNet [Zhong et al., 2020], FinTabNet [Zheng et al., 2021], and SynthTabNet [Nassar et al., 2022].
PubTabNet is one of the large-scale TSR datasets containing HTML annotations of tables extracted from scientific articles. It is composed of 500,777 training and 9,115 validation table images. Annotated test dataset comprising of 9,064 images was subsequently released, and TFLOP's TSR performance against both the validation and test datasets are reported in this work. It should be noted that for PubTabNet test dataset, no cell-level annotation (i.e. text region bounding box) is provided and off-the-shelf OCR engine was used to obtain these annotations.
FinTabNet is one of the popular TSR benchmarks composed of single-page PDF documents from financial reports. This dataset comprises of 112,887 tables extracted from the documents along with the cell-level annotations. FinTabNet facilitates the evaluation of TFLOP's performance in tables where the text regions are not obtained using OCR engines (i.e. free from OCR-related noise similar to PDF parsing).
SynthTabNet was introduced by [Nassar et al., 2022] as a benchmark dataset that is not only large-scale but also diverse in table appearances and content. SynthTabNet is composed of 600,000 table images across different styles and provides cell-level annotation similar to that of FinTabNet.
4.2 Experimental Settings
In training of TFLOP, input image resolution is set to 768 × 768 across all benchmark datasets. The output sequence length, N, is fixed at 1,376 to allow sufficient length for the layout embedding and generation of the table tags. Feature dimension d of the framework is set to 1,024 and the hyper-parameters of the loss formulation Equation 7 are: λ1 = λ2 = λ3 = 1 and λ4 = λ5 = 0.5. The temperature value τ is set to 0.1. All experiments were conducted with 4×A100 GPUs at 250K training steps.
| Methods | FinTabNet | SynthTabNet | ||
|---|---|---|---|---|
| TEDS-S | TEDS | TEDS-S | TEDS | |
| TableFormer [2022] | 96.80 | - | 96.70 | - |
| GridFormer [2023] | 98.63 | - | - | - |
| VAST [2023] | 98.63 | 98.21 | - | - |
| DRCC [2023] | - | - | 98.70 | - |
| TFLOPBASE | 99.43 | 99.22 | 99.42 | 99.34 |
| TFLOPFULL | 99.56 | 99.45 | 99.42 | 99.40 |
4.3 EvaluationMetrics
To evaluate TFLOP's performance, we utilize Tree-EditDistance-Based Similarity, TEDS [Zhong et al., 2020], and TEDS-Struct [Huang et al., 2023; Nassar et al., 2022] which computes the TEDS score between the predicted and ground truth HTML table structure with and without table text content, respectively.
In Equation 8, T and |T | represent the HTML structure and number of nodes in T , respectively, while EditDist() indicates tree-edit distance between the HTML structures.
4.4 Results
We benchmarked TFLOP against three popular datasets as shown in Tables 1 and 2. For all benchmarks, we not only report the results of TFLOPFULL, but also TFLOPBASE to better evaluate the effectiveness of our layout pointer mechanism. TFLOPBASE differs from TFLOPFULL with the absence of image ROIAlign and span-aware contrastive supervision.
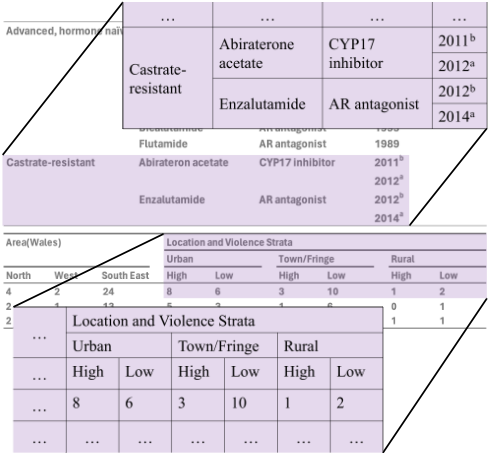
Table 1 results show that TFLOP outperforms prior works in recognition of full table structure across the validation and test splits of PubTabNet. Evaluation across PubTabNet's validation dataset was conducted to ensure fair comparisons against prior works which only reported results on the validation set. For the test dataset, where cell-level annotations are not provided, text region bounding box annotations were obtained using PSENet [Wang et al., 2019a] and Master [Lu et al., 2021] similar to prior works [Ye et al., 2021; Guo et al., 2022; Huang et al., 2023] for fair comparisons. TFLOP's state-of-the-art performance on PubTabNet's test dataset clearly demonstrates our framework's efficacy when using text regions derived from off-the-shelf OCR engines. Visualisations in Figure 4 illustrate TFLOP's ability to recognize tables with complex structures such as hierarchical rowspans (top) and hierarchical column-spans (bottom).
Results in Table 2 also substantiate TFLOP's superior performance over various prior works by achieving state-of-theart recognition results for both FinTabNet and SynthTabNet. FinTabNet being table extracts from financial reports, TFLOP's state-of-the-art performance (99.45 TEDS) has significant implications in the context of industrial applications where the margin for error is exceedingly narrow. SynthTabNet, on the other hand, comprises of table structures of various styles and TFLOP's state-of-the-art performance (99.40
| Methods | Simple | Complex | All |
|---|---|---|---|
| TFLOPBASE | 97.92 | 94.85 | 96.42 |
| TFLOPBASE + I | +0.04 | +0.14 | +0.08 |
| TFLOPBASE + I + U | +0.01 | +0.12 | +0.06 |
| TFLOPBASE + I + S | +0.14 | +0.35 | +0.24 |
| TFLOPFULL | 98.06 | 95.20 | 96.66 |
TEDS) clearly demonstrates that the framework is not restrictive to specific tabular format or style.
In both Tables 1 and 2, it can be noted that TFLOP also achieves significant improvement in terms of TEDS-Struct metric (HTML table tags only). We posit that this is a sideeffect of layout embedding in our framework. Provision of layout embedding is essential for our framework's layout pointer mechanism as it serves as the pointing target from the generated table tags. Incidentally, this layout embedding could also improve the framework's understanding of the table's layout, resulting in improved table tag generation as shown by TFLOP's TEDS-Struct results.
On top of achieving the state-of-the-art TEDS score across benchmark datasets, it is also worth noting of the gap between TEDS-Struct and TEDS scores of our framework in comparison to prior works. While the TEDS metric evaluates the accuracy of the full table structure, the gap between TEDSStruct and TEDS serves as an indirect indication for significance of bounding box misalignments (for prior works) or significance of layout pointer mechanism (for TFLOP). Aside from PubTabNet test dataset where the TEDS metric is also affected by the OCR error of PSENet [Wang et al., 2019a] and Master [Lu et al., 2021], TFLOP consistently achieves the smallest gap between TEDS-Struct and TEDS across remaining benchmarks (e.g. 0.11 vs 0.42 in FinTabNet). This clearly shows the effectiveness of layout pointer mechanism in addressing bounding box misalignments faced by prior works.
4.5 Ablation Study
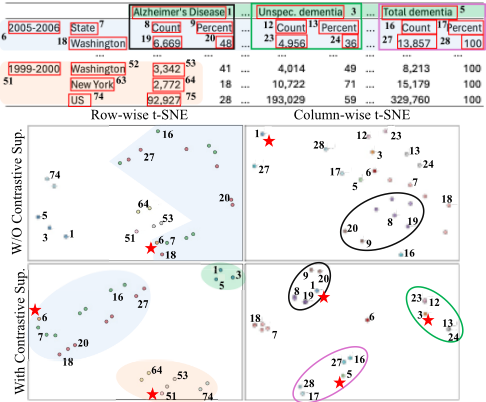
Aside from layout pointer mechanism, we analyzed the effectiveness of other components in our framework by comparing between TFLOPBASE and TFLOPFULL in Table 3. Firstly, for image ROI alignment, consistent with [Huang et al., 2023; Shen et al., 2023], it is evident from Table 3 that incorporating RoI aligned visual features into layout embedding is also beneficial for recognizing table structures in our framework. Secondly, Table 3 shows clear performance improvement through span-aware contrastive supervision over other method configurations. The performance gain is most noticeable for tables with complex structure, showing that our spanaware contrastive supervision benefits the framework with improved recognition of tables with row or column spans. This can also be observed in t-SNE visualisation of bounding box embedding space (Figure 5) where, embeddings are distinctly structured into clusters of row or column spans.
5 TFLOP Versatility
On top of its strong TSR performance, we further explore the versatility of our framework in two scenarios commonly encountered during industrial application of TSR: tables with
Methods IOU TEDS-Struct (%) TEDS (%) TableMaster - 82.18 72.83 Goldgreedy 0.0 - 96.45 Goldselective 0.5 - 98.16 TFLOPFULL - 99.54 99.41 Table 4: TSR performance on watermarked FinTabNet dataset. watermark and non-English texts. 5.1 Watermark TSRUnlike the benchmark dataset tables, tables in real industrial documents often contain unwanted texts such as watermark. These unwanted texts could result in recognition of erroneous table structure if not filtered accurately.
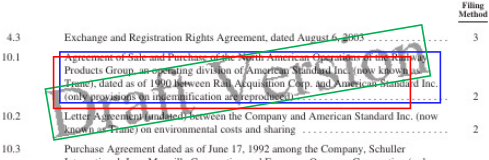
Prior works based on the dual-decoder framework are not optimal in handling tables with watermark as they require complex bounding box matching heuristics to properly distinguish wanted text region bounding boxes from those of watermark (as illustrated in Figure 6). Our work, TFLOP, on the contrary, has the versatility to be trained to ignore these watermark bounding boxes prior to layout pointing.
To support this, we first prepared watermark table dataset by inpainting watermarks into the FinTabNet [Zheng et al., 2021] dataset. We then trained TFLOP with this dataset, requiring only a minor addition of a two-layer MLP with a binary cross-entropy loss function. In brief, prior to predicting pointer associations between bounding boxes and table tags, a binary classifier is trained to filter watermark bounding boxes. More details can be found in supplementary material.
In Table 4, we compare TFLOP's TSR on watermark dataset against TableMaster and variations of gold annotation which assume error-free logical structure. Goldgreedy constructs full table structure by including all watermarks that has any bounding box IOU with the text bounding boxes, while Goldselective filters watermarks with IOU threshold of 0.5. Table 4 shows promising result where TFLOP filters out most of the watermark texts with just a simple addition of two-layer MLP, showcasing the versatility of our framework.
5.2 Cross-lingual TSR
Another important aspect for industrial TSR applications lies in the performance across non-English tables. TSR on nonEnglish tables is a challenging task due to limited availability of data and thus, we examine the versatility of TFLOP in performing TSR on non-Engligh tables despite having only been trained on English tables. For this purpose, we self-annotated 30 Korean table images (15 simple & 15 complex tables) extracted from real Korean financial reports, including both the HTML sequence and cell-level annotations of tabular images.
| Methods | TEDS (%) | QAAcc. (%) | |
|---|---|---|---|
| Simple | Complex | ||
| Image-only | - | - | 56.00 |
| GPT-4V | 79.43 | 68.39 | 78.86 |
| TableMaster | 89.96 | 83.94 | 82.86 |
| TFLOP | 95.76 | 89.41 | 92.00 |
We benchmarked our framework against TableMaster [Ye et al., 2021] and GPT-4V [OpenAI, 2023]. It should be noted that both TFLOP and TableMaster were trained on PubTabNet dataset prior to evaluating on the Korean table dataset. Results in Table 5 show promising results demonstrating the cross-lingual versatility of TFLOP by outperforming both TableMaster and GPT-4V consistently across simple and complex Korean tables by a significant margin.
To better under the industrial implications of TSR results in Table 5, we conducted an additional Question-Answering (QA) assessment on top of the generated table structures. For the assessment, we built 175 unique question-answer pairs where the questions require clear understanding of the table provided to answer accurately. In the assessment, both the question and table structure generated (HTML) are provided to GPT-4V along with the tabular image, before comparing its output with the answer label. Each of the 175 answers were evaluated manually for the QA accuracy shown in Table 5.
QA accuracy results in Table 5 not only show the importance of HTML sequence for Table QA in non-English domain for GPT-4V, but also highlight how the difference in TEDS score could translate into the real industrial application of table QA in cross-lingual setting. Details of the dataset and qualitative results can be found in supplementary material.
6 Conclusion
In this work, we proposed TFLOP, a TSR framework leveraging on layout pointer mechanism with span-aware contrastive supervision, which not only remedies the bounding box misalignment issues, but also recognizes tables with complex structures accurately without the need for finely-calibrated post-processing. With these features, TFLOP achieves the new state-of-the-art performance across the three popular TSR benchmarks. In addition to its strong TSR performance, TFLOP has also shown significant versatility and promising performance in industrial application contexts, namely: tables in documents with watermark or in non-English domain.
Acknowledgements
We would like to express our sincere appreciation to our colleagues at Upstage, especially Sungrae Park, for their insightful discussions, unwavering support, and encouragement throughout this research.
@inproceedings{ijcai2024p105,
  title     = {TFLOP: Table Structure Recognition Framework with Layout Pointer Mechanism},
  author    = {Khang, Minsoo and Hong, Teakgyu},
  booktitle = {Proceedings of the Thirty-Third International Joint Conference on
               Artificial Intelligence, {IJCAI-24}},
  publisher = {International Joint Conferences on Artificial Intelligence Organization},
  editor    = {Kate Larson},
  pages     = {947--955},
  year      = {2024},
  month     = {8},
  note      = {Main Track},
  doi       = {10.24963/ijcai.2024/105},
  url       = {https://doi.org/10.24963/ijcai.2024/105},
}
TY - CPAPER TI - TFLOP: Table Structure Recognition Framework with Layout Pointer Mechanism AU - Khang, Minsoo AU - Hong, Teakgyu T2 - Proceedings of the Thirty-Third International Joint Conference on Artificial Intelligence, IJCAI-24 PB - International Joint Conferences on Artificial Intelligence Organization PY - 2024 SP - 947 EP - 955 DO - 10.24963/ijcai.2024/105 UR - https://doi.org/10.24963/ijcai.2024/105 ER -Copied
Machine-readable versions of this paper, for tools and AI agents:





