
Reconstruction Weighting Principal Component Analysis with Fusion Contrastive Learning
Proceedings of the Thirty-Third International Joint Conference on Artificial Intelligence. Main Track. Pages 5091-5098.
https://doi.org/10.24963/ijcai.2024/563
Keywords
- Computer Vision: CV: Recognition (object detection, categorization)
- Machine Learning: ML: Feature extraction, selection and dimensionality reduction
- Machine Learning: ML: Classification
- Computer Vision: CV: Representation learning
Abstract
Principal component analysis (PCA) is a popular unsupervised dimensionality reduction method to extract the principal components of data. However, there are two problems with the existing PCA: (1) Traditional PCA methods treat each sample equally and ignore sample differences. (2) They fail to extract the discriminative features required by recognition tasks. To overcome these problems, we incorporate contrastive learning to develop a novel weighted PCA algorithm. Specifically, our method weights the reconstruction error of individual samples to reduce the influence of outliers. Besides, it integrates contrastive learning into PCA to increase inter-class distances and reduce intra-class distance, which helps to improve PCA's discriminative capability. We further develop an unsupervised strategy to select positive and negative samples, which eliminates pseudo-negative samples guided by clustering labels. Specifically, it employs confidence level to distinguish positive and negative samples. Consequently, our method achieves higher recognition accuracy on benchmark datasets.
- [Abdi and Williams, 2010] Hervé Abdi and Lynne J Williams. Principal component analysis. Wiley interdisci- plinary reviews: computational statistics, 2(4):433-459, 2010.
- [Arora et al., 2019] Sanjeev Arora, Hrishikesh Khande- parkar, Mikhail Khodak, Orestis Plevrakis, and Nikunj Saunshi. A theoretical analysis of contrastive unsupervised representation learning. arXiv preprint arXiv:1902.09229, 2019.
- [Belhumeur et al., 1997] Peter N. Belhumeur, Joao P Hes- panha, and David J. Kriegman. Eigenfaces vs. fisherfaces: Recognition using class specific linear projection. IEEE TPAMI, 19(7):711-720, 1997.
- [Ding et al., 2006] Chris Ding, Ding Zhou, Xiaofeng He, and Hongyuan Zha. R 1-pca: rotational invariant l 1-norm principal component analysis for robust subspace factor- ization. In ICML, pages 281-288, 2006.
- [Doersch et al., 2015] Carl Doersch, Abhinav Gupta, and Alexei A Efros. Unsupervised visual representation learn- ing by context prediction. In IEEE ICCV, pages 1422- 1430, 2015.
- [Georghiades et al., 2001] Athinodoros S. Georghiades, Pe- ter N. Belhumeur, and David J. Kriegman. From few to many: Illumination cone models for face recognition un- der variable lighting and pose. IEEE TPAMI, 23(6):643- 660, 2001.
- [He and Niyogi, 2003] Xiaofei He and Partha Niyogi. Lo- cality preserving projections. NeurIPS, 16, 2003.
- [He et al., 2005] Xiaofei He, Deng Cai, Shuicheng Yan, and Hong-Jiang Zhang. Neighborhood preserving embedding. In IEEE ICCV, volume 2, pages 1208-1213. IEEE, 2005.
- [He et al., 2011] Ran He, Bao-Gang Hu, Wei-Shi Zheng, and Xiang-Wei Kong. Robust principal component analy- sis based on maximum correntropy criterion. IEEE TIP, 20(6):1485-1494, 2011.
- [Jin et al., 2001] Zhong Jin, Jing-Yu Yang, Zhong-Shan Hu, and Zhen Lou. Face recognition based on the uncorrelated discriminant transformation. PR, 34(7):1405-1416, 2001.
- [Ke and Kanade, 2005] Qifa Ke and Takeo Kanade. Robust l/sub 1/norm factorization in the presence of outliers and missing data by alternative convex programming. In IEEE CVPR, volume 1, pages 739-746. IEEE, 2005.
- [Kwak, 2008] Nojun Kwak. Principal component anal- ysis based on l1-norm maximization. IEEE TPAMI, 30(9):1672-1680, 2008.
- [Li et al., 2018] Xuelong Li, Han Zhang, Rui Zhang, Yun Liu, and Feiping Nie. Generalized uncorrelated regres- sion with adaptive graph for unsupervised feature selec- tion. IEEE TNNLS, 30(5):1587-1595, 2018.
- [Martinez and Benavente, 1998] Aleix Martinez and Robert Benavente. The ar face database: Cvc technical report, 24. CVC, 1998.
- [Nie et al., 2014] Feiping Nie, Jianjun Yuan, and Heng Huang. Optimal mean robust principal component anal- ysis. In ICML, pages 1062-1070. PMLR, 2014.
- [Nie et al., 2020] Feiping Nie, Danyang Wu, Rong Wang, and Xuelong Li. Truncated robust principle component analysis with a general optimization framework. IEEE TPAMI, 44(2):1081-1097, 2020.
- [Sim et al., 2002] Terence Sim, Simon Baker, and Maan Bsat. The cmu pose, illumination, and expression (pie) database. In IEEE international conference on automatic face gesture recognition, pages 53-58. IEEE, 2002.
- [Sun et al., 2019] Zhiqing Sun, Zhi-Hong Deng, Jian-Yun Nie, and Jian Tang. Rotate: Knowledge graph embedding by relational rotation in complex space. arXiv preprint arXiv:1902.10197, 2019.
- [Turk and Pentland, 1991] Matthew Turk and Alex Pentland. Eigenfaces for recognition. Journal of cognitive neuro- science, 3(1):71-86, 1991.
- [Wang et al., 2014] Rong Wang, Feiping Nie, Xiaojun Yang, Feifei Gao, and Minli Yao. Robust 2dpca with non-greedy ℓ 1 -norm maximization for image analysis. IEEE TC, 45(5):1108-1112, 2014.
- [Wang et al., 2017a] Qianqian Wang, Quanxue Gao, Xinbo Gao, and Feiping Nie. Angle principal component analy- sis. In IJCAI, pages 2936-2942, 2017. IJCAI
- [Wang et al., 2017b] Qianqian Wang, Quanxue Gao, Xinbo Gao, and Feiping Nie. ℓ 2,p -norm based pca for image recognition. IEEE TIP, 27(3):1336-1346, 2017.
- [Wang et al., 2020] Xudong Wang, Ziwei Liu, and X Yu Stella. Unsupervised feature learning by cross-level dis- crimination between instances and groups. arXiv preprint arXiv:2008.03813, 1(2):4, 2020.
- [Wei et al., 2020] Chen Wei, Huiyu Wang, Wei Shen, and Alan Yuille. Co2: Consistent contrast for unsuper- vised visual representation learning. arXiv preprint arXiv:2010.02217, 2020.
- [Ye et al., 2019] Mang Ye, Xu Zhang, Pong C Yuen, and Shih-Fu Chang. Unsupervised embedding learning via in- variant and spreading instance feature. In IEEE CVPR, pages 6210-6219, 2019.
- [Zhang and Tong, 2019] Rui Zhang and Hanghang Tong. Robust principal component analysis with adaptive neigh- bors. NeurIPS, 32, 2019.
- [Zhang et al., 2020] Rui Zhang, Yunxing Zhang, and Xue- long Li. Unsupervised feature selection via adaptive graph learning and constraint. IEEE TNNLS, 33(3):1355-1362, 2020.
- [Zhang et al., 2022] Hongjie Zhang, Wenwen Qiang, Jinxin Zhang, Yingyi Chen, and Ling Jing. Unified fea- ture extraction framework based on contrastive learning. Knowledge-Based Systems, 258:110028, 2022.
References were extracted automatically from the PDF and may contain errors.
Full text extracted automatically from the PDF; figures, tables and equations may differ. The PDF is the version of record.
1 Introduction
Feature dimensionality reduction is a crucial tool in analyzing complex high-dimensional data [Doersch et al., 2015]. Current feature dimensionality reduction methods are roughly divided into the following types: principal component analysis (PCA) [Abdi and Williams, 2010] and linear discriminant analysis (LDA) [Belhumeur et al., 1997], as well as structure preservation methods such as local preserving projection (LPP) [He and Niyogi, 2003] and neighborhood preserving embedding (NPE) [He et al., 2005]. Among these methods, PCA has gained significant attention as a well-established feature extraction approach and has been widely applied in various scenarios.
∗Corresponding Author
To overcome the influence of outliers and improve the robustness of PCA, several robust metric PCA has been proposed [Ke and Kanade, 2005; Nie et al., 2014; Ding et al., 2006; Wang et al., 2017b; Wang et al., 2017a]. They replace the squared L2-norm by new distance metric to weaken the influence of noise. Therefore, several studies leverage L1norm, F-norm, and L21-norm to obtain robust projection vectors [Ding et al., 2006]. For example, Ke and Kanade [2005] proposed L1-PCA that uses L1-norm to measure reconstruction error in the objective function; Kwak [2008] proposed a robust principal component analysis based on L1-norm maximization, which is robust to outliers. However, L1-norm maximization problem is difficult to be solved directly and thus has to be optimized with a greedy strategy. Specifically, the projection direction is sequentially optimized, and the greedy algorithm is easy to fall into the local solution. To mitigate this issue, Wang et al. [2014] developed an optimization algorithm that solves the maximization problem of L1-norm directly with the non-greedy strategy.
However, L1-norm does not satisfy rotational invariance which is an important property in learning methods. To address this problem, Ding et al. [2006] used R1-norm to extract features and proposed a rotational invariant L1-norm PCA (R1-PCA). He et al. [2011] introduced a Half-Quadratic PCA (HQ-PCA), which uses the maximum correntropy criterion to realize rotational invariant PCA. Zhang et al. [2019] proposed an algorithm named Robust Principal Component Analysis with Adaptive Neighbors (RPCA-AN). In this method, the idea of adaptive weight learning is applied to robust principal component analysis. Nie et al. [2014] proposed an algorithm called Optimal Mean Robust Principal Component Analysis (RPCA-OM). The robust PCA objective function of this method can automatically remove the optimal mean value.
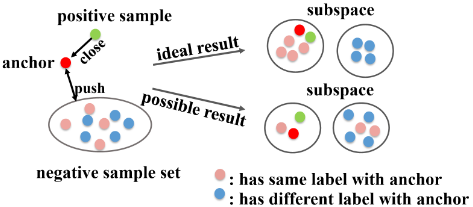
Although the above algorithms effectively suppress the influence of outliers and retain rotational invariance, they do not consider the class structure relationships among samples in the embedding space. However, extracting discriminative features is undoubtedly beneficial to downstream classification tasks [Zhang et al., 2022; Arora et al., 2019]. As a result, contrastive learning has been widely applied to various models and has shown promising results [Ye et al., 2019]. By reducing the distance between positive pairs and increasing the distance between negative pairs, contrastive learning effectively enhances the discriminative capacities of features. Nevertheless, the issue of pseudo-negative samples has consistently influenced its performance [Wang et al., 2020; Wei et al., 2020; Sun et al., 2019], as shown in Figure 1.
Inspired by the capability of contrastive learning to capture sample differences, we apply contrastive learning to the weighted PCA and propose a novel strategy to tackle the "pseudo-negative samples" problem, which helps to enhance the discriminability of the features extracted by PCA. Besides, the connection between PCA and contrastive learning can be established through the projection matrix. Specifically, we first employ the original sample as the anchor point and reconstruct it with the projection matrix generated by PCA, which is treated as a positive sample. For negative samples, we utilize the labels acquired by clustering to remove pseudo-negative samples. Finally, we calculate the confidence level of each pseudo-negative sample and iteratively eliminate those with a high confidence level. Our contributions can be summarized as follows:
- We consider the diversity of the samples by assigning a small weight to the reconstruction error of outliers, which enhances the robustness of PCA and effectively resists the impact of outliers.
- We integrate contrastive learning into weighted PCA, and with the pseudo-labels generated by K-means, we remove the pseudo-negative samples belonging to the same class as the anchors, which improves the discriminative capacity of the features extracted by the PCA algorithm.
- We conduct experiments on six datasets to evaluate the performance of our method, which indicates our method greatly improves the classification accuracy and demonstrates its effectiveness in capturing more information about sample differences.
2 RelatedWork
In this section, we briefly introduce two related works about our proposed model, i.e., optimal mean principal component analysis and instance-level contrastive learning.
2.1 Optimal Mean Principal Component Analysis
PCA is a well-known unsupervised dimension reduction method that uses a projection matrix to reduce the dimension of data features. To adjust the features on the same scale, PCA needs to center the features with a mean matrix. [Nie et al., 2014] proposed an optimal mean PCA where the mean matrix is optimized during training to mitigate the sensitivity of PCA to noise.
Let X = [x1, ......, xN] ∈ Rd×N be a data matrix. N is the number of data points. xi ∈ Rd×1 denotes the ith data point. W ∈ Rd×c is the projection matrix. m is the mean matrix. The reconstruction error in the form of the optimal mean PCA loss function is as follows:
where WWT (xi - m) is the reconstructed data matrix; WT W= I is the constraint term.
2.2 Instance Level Contrastive Learning
The goal of instance-level contrastive learning is to minimize the distance between positive pairs while maximizing the distance between negative pairs. The contrastive learning crossentropy loss function is defined as follows:
Definition 1. For the two descriptions A and B, where A ∈ RN×d , B ∈ RN×d , the number of samples is N and the dimension is d. ai and bi respectively represent the i-th line of A and B, i.e., the i-th sample. Suppose s (a, b) = a·bT ∥a∥∥b∥ represents the cosine similarity of the sample a and the sample b, and then the contrastive loss can be defined as below:
where,
ai = xi; bi = WWT xi; s(·, ·) is the cosine similarity function; τ ∈ (0, 1] is the monitoring temperature.
3 The ProposedMethod
In this section, we provide a detailed discussion of our model. We start with our motivation and objective function. Subsequently, we explain our reconstruction-weighted PCA and instance-level contrastive learning implementation. Furthermore, we introduce the process of using the clustering results to compute the confidence level of each sample and selectively eliminate pseudo-negative samples.
3.1 Motivation and Objective Function
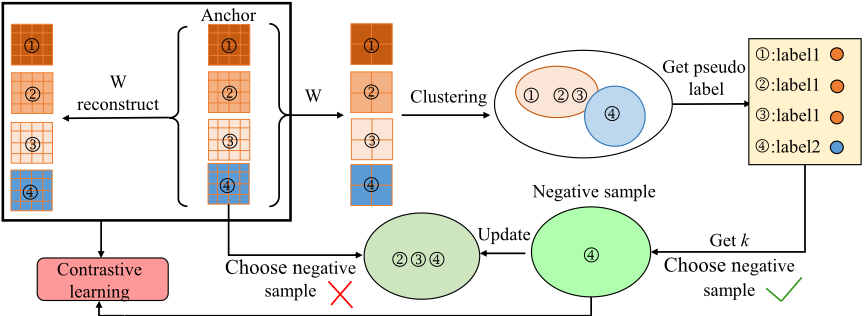
To enhance the robustness of PCA, we incorporate a reconstruction error approach. Simultaneously, we combine contrastive learning with PCA to ensure that the projected features retain more class information. Moreover, we use clustering labels to compute each sample's confidence level. Then, we eliminate pseudo-negative samples with high confidence levels. The rate of eliminated samples will increase with the number of iterations.
Specifically, we perform contrastive learning between real and reconstructed samples. The connection between PCA loss and contrastive learning loss is established through the projection matrix W. To keep similar samples from being pushed far away, we use clustering labels to guide contrastive learning to exclude pseudo-negative examples. The block diagram of our model is shown in Figure 2. Our objective function can be written as follows:
where W is the projection matrix of PCA; L is the contrastive learning function; λ is the weight of contrastive learning loss; xi is the i-th row of X; m is the mean matrix; ri is the reconstructed weight, which will be discussed later.
In Eq.(2), bi represents the i-th reconstructed sample, and ai represents its corresponding original sample. Other original samples and reconstructed samples that are not pseudonegative samples are treated as negative samples. It can then be considered that LA = LB, and L in our model can be rewritten as:
Therefore, the objective function of our model in Eq.(5) can be rewritten as:
s.t.r ⩾ 0, rT 1 = 1, WT W = I
Where s1 = s (bi, ai), s2 = s (bi, bj); s3 = s (bi, aj); k is the index of the pseudo-negative sample, which will be discussed later; τ ∈ (0, 1] is the monitoring temperature.
3.2 Weighting the Reconstruction Error of Each Sample
The presence of outliers can significantly impact the projection direction of PCA since their reconstruction errors tend to be much larger compared to normal values. To address this issue, we propose a novel weighted PCA. To be specific, we weight the reconstruction error of each sample instead of weighting the samples directly. This approach allows for a more direct reduction of the reconstruction error of outliers, and the weights are taken in a larger range. The reconstruction weights in our method are as defined follows:
where g(xi) is the reconstruction error of xi, denoted by gi in the following derivation; ri is the reconstruction weight.
We use the Lagrange multiplier method to solve the reconstruction weights ri.
where β, γi are Lagrange multipliers. The KKT conditions are as follows:
Then the optimal solution of the weights ri is below:
Thus, the reconstruction weighting PCA loss is as follows:
where r = [r1, r2, ..., rN]T is the vector of reconstruction weights ri; m is the mean matrix; W is the projection matrix.
3.3 Removing Pseudo-Negative Samples During Contrastive Learning
Considering the low complexity of the K-means algorithm, we first utlize K-means to obtain the pseudo-labels of each projected sample. Next, the confidence level is obtained by calculating the cosine similarity between each sample and the cluster centroid. A high confidence level means that the sample is close to the cluster center, indicating the sample is more likely to be a pseudo-negative example of its corresponding class. The confidence level of xi is calculated as follows:
Where zi = WT (xi -m); cyi is the cluster center of zi; p is the class number of X; cj is the cluster center except cyi; sim is the cosine similarity function.
Pseudo-negative examples are selected according to the confidence level. First, we rank the confidence levels of each sample in descending order. Then, we select the pseudonegative example with the highest confidence level and exclude it from the denominator of the contrastive learning objective function. The proportion of choices is constantly increasing with each iteration. The subscript of the selected pseudo-negative example can be expressed as follows:
where η = 0 ∼ 100% is the rate of selected pseudo-negative samples; con = [con1, ......, conN] ∈ [0, 1] is the sorted confidence level of all samples; Index is a function that can get the subscript of zi corresponding to the confidence level coni.
Our method prevents similar samples from being projected to greater distances by deleting pseudo-negative examples with the subscript k in contrastive learning. It is worth noting that the acquisition of pseudo-negative examples and the extraction of PCA features are carried out alternately and enhance each other, thereby improving the discriminative quality of the recovered features. The detailed optimization can be found in the Supplementary material 1 .
| Dataset | Quantity | Dimension | Class Number |
|---|---|---|---|
| Extended Yale B | 2144 | 1024 | 38 |
| CMU PIE | 2856 | 1024 | 68 |
| AR | 3120 | 2000 | 120 |
| ORL | 400 | 1024 | 40 |
| Lung | 203 | 3312 | 5 |
4 Experiment
4.1 Experiment Setting
All our experiments were conducted on the Windows 10 operating system using Python 3.7. The recognition accuracy follows the 1-nearest neighbor approach. To prevent significant differences in clustering outcomes during iterations, we use the K-means and fix random seed as 4 in the training process. Furthermore, for fairness, we run each method for 10,000 epochs and set the algorithm parameters in accordance with the specifications in their papers.
4.2 Datasets Information
Extended Yale B:[Georghiades et al., 2001] The Yale B dataset comprises 5850 facial images from 10 individuals, later expanded and renamed the Extended YaleB dataset. It encompasses 2144 frontal images of 38 subjects captured under diverse lighting setups. Images were resized to 32×32 dimensions and noise blocks with ratios ranging from 0.05 to 0.15 were applied to 14 images per person. From each individual, 32 images were randomly chosen, with 7 noisy images assigned for training, totaling 1216 images. The remaining 1198 images were allocated for testing purposes.
CMU PIE:[Sim et al., 2002] The CMU PIE database was created by Carnegie Mellon University. It contains 4,400 frontal faces of 68 people. These images were taken under 43 kinds of light, 13 kinds of postures, and 4 kinds of expressions. Our experiment adopts the No. 27 posture, which contains 2856 positive images, 42 for each person. We also add random noise to 10 images of each person, and the noise ratio is 0.05 to 0.15. We selected 1428 for training and the rest for testing.
AR: [Martinez and Benavente, 1998] The AR dataset comprises 4,000 color facial images from 56 females and 70 males, featuring diverse lighting conditions, expressions, poses, and occlusions. Biweekly image capture resulted in 26 images per subject. Experimentation involved a subset of 120 subjects, with varying occluded, unobstructed, and subsequent session images. Images were resized to 50x40 pixels, with 1560 images designated for training and the remainder for testing. Occluded images were deemed noisy samples. Two categories emerged: (1) AR+all, using initial session images for training and subsequent session images for testing; (2) AR+glass, employing non-disguised subjects' initial session images along with one glass-wearing image for training, while two additional glass-wearing images were incorporated from both initial and subsequent sessions for testing.
1 https://github.com/lml314159/IJCAI2024
| Method | CMU PIE | Extended Yale B | AR+All | AR+glass | ORL | Lung |
|---|---|---|---|---|---|---|
| L2-PCA | 82.65±0.77 | 52.25±0.69 | 59.38±0.72 | 67.00±0.13 | 83.50±1.35 | 92.23±0.53 |
| GreedyL1-PCA | 84.52±0.73 | 54.64±0.64 | 59.24±1.02 | 67.50±1.43 | 85.50±1.53 | 92.23±1.12 |
| Non-greedyL1-PCA | 82.06±0.70 | 49.95±0.90 | 59.11±0.53 | 67.00±0.54 | 85.50±0.89 | 92.23±0.75 |
| HQ-PCA | 83.28±0.89 | 53.15±0.77 | 59.96±0.57 | 68.00±0.57 | 86.00±1.04 | 92.32±1.20 |
| R1-PCA | 85.23±0.67 | 55.57±0.51 | 60.08±0.51 | 67.50±0.53 | 84.50±0.86 | 93.20±0.30 |
| RPCA-OM | 85.18±0.65 | 55.48±0.58 | 60.24±0.68 | 69.00±0.56 | 83.00±1.56 | 92.23±0.64 |
| RPCA-AN | 85.47±0.60 | 56.21±0.68 | 60.13±0.59 | 68.50±0.35 | 84.50±1.11 | 93.20±0.76 |
| TRPCA | 85.59±0.64 | 54.97±0.75 | 60.21±0.74 | 68.50±0.76 | 85.76±0.75 | 93.32±0.74 |
| EGCFS | 85.69±0.54 | 52.56±0.66 | 58.87±1.35 | 66.00±0.85 | 87.50±0.54 | 92.23±1.20 |
| PCA-CL(ours) | 86.27±0.64 | 57.60±0.75 | 60.83±0.74 | 70.28±0.76 | 90.50±0.75 | 93.32±0.74 |
| PCA | RW | CL | k CMU PIE | Extended Yale B | AR+ALL | AR+glass | ORL | Lung |
|---|---|---|---|---|---|---|---|---|
| ✓ | ✓ | 82.65 | 52.25 | 60.13 | 64.67 | 85.45 | 89.32 | |
| ✓ | 83.43 | 53.32 | 60.32 | 65.13 | 86.67 | 90.42 | ||
| ✓ | ✓ | ✓ | 84.22 | 55.22 | 60.54 | 66.22 | 87.72 | 91.43 |
| ✓ | ✓ | 85.96 | 56.50 | 60.77 | 68.14 | 88.34 | 91.67 | |
| ✓ | ✓ | ✓ | ✓ 86.27 | 57.60 | 60.83 | 70.28 | 90.50 | 93.32 |
ORL:[Jin et al., 2001] The ORL dataset includes 400 grayscale frontal facial images of 40 subjects, showcasing variations in shooting time, posture (frontal, lateral), expression (open eyes, closed eyes, smiling), lighting conditions, occlusion (presence of sunglasses), and environmental factors. Images were resized uniformly to 32x32 dimensions for experimentation. Half of each subject's images were randomly assigned for training, with the other half reserved for testing. Images with shading or occlusions were classified as noisy samples.
Lung:[Li et al., 2018] The Lung dataset constitutes a biological repository comprising 203 samples categorized into five distinct classes. Our experimental protocol entails randomly partitioning 50% of the images, totaling 539 samples per category, for the training subset, while the residual samples are earmarked for the test subset. This partitioning procedure is iterated tenfold to yield ten independent sets of randomized datasets.
4.3 Comparison Algorithms
We compare our method with L2-PCA [Turk and Pentland, 1991], GreedyL1-PCA [Kwak, 2008], Non-greedyL1-PCA [Wang et al., 2014], HQ-PCA [He et al., 2011], R1-PCA [Ding et al., 2006], RPCA-OM [Nie et al., 2014], RPCAAN [Zhang and Tong, 2019], TRPCA [Nie et al., 2020], and a feature extraction method based on graph structure: EGCFS
[Zhang et al., 2020]. Then we carry out experiments on Extended Yale B [Georghiades et al., 2001], CMU PIE [Sim et al., 2002], AR [Martinez and Benavente, 1998], AR+glass, ORL, and Lung datasets. We will briefly introduce the above comparison methods:
L2-PCA: It uses L2-norm to constrain reconstruction error, which is a traditional PCA algorithm.
Greedy-L1PCA: It uses the L1-norm to measure reconstruction error, which has the advantage of satisfying rotation invariance.
Non-greedy-L1PCA: It proposes a non-greedy algorithm to solve the L1-norm maximization problem, which ensures that the algorithm converges to the global optimal solution.
HQ-PCA: It's based on the maximum entropy criterion and has rotation invariance.
R1-PCA: It uses the R1 norm to replace the traditional F norm, which has rotation invariance, and uses the subspace iteration method to solve the model.
RPCA-OM: It uses the optimal mean to replace the fixed mean so that the mean matrix is optimized during the iteration. This approach effectively reduces the sensitivity of PCA to noise.
RPCA-AN: It introduces the adaptive weight into PCA, effectively eliminates outliers in the training process and enhances the robustness of PCA.
TRPCA: It ignores outliers by truncation and minimizes the reconstruction error in ℓ2,1-norm.
EGCFS: A graph structure-based feature extraction method.
4.4 Recognition Accuracy
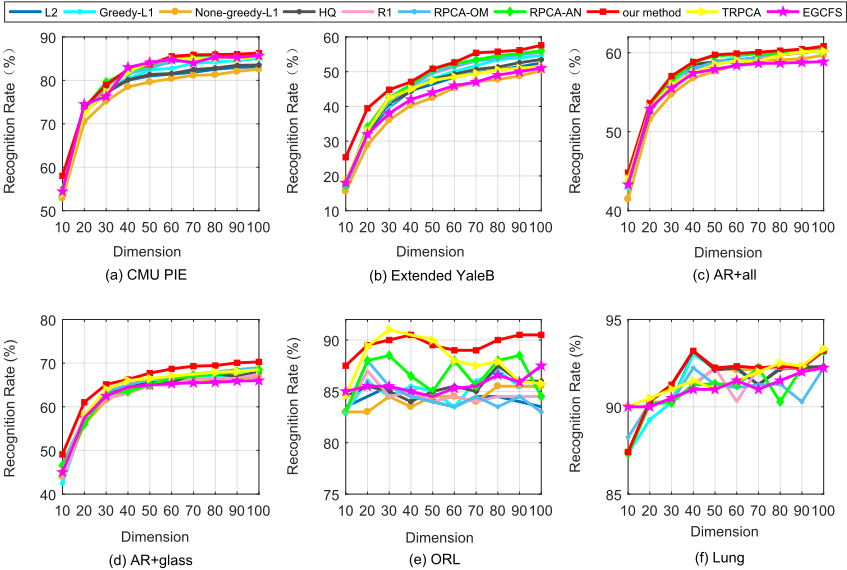
In this section, we compare the recognition accuracy of our method with the mentioned comparison methods. We conduct feature extraction on six datasets with these six methods and analyze the recognition rate curves across different dimensions, as illustrated in Figure 3. Subsequently, we present the average recognition rates of all methods at a fixed dimension of 100, as summarized in Table 2. The experimental results reveal that our proposed approach initially exhibits commendable performance and surpasses other PCA techniques as dimensionality increases, indicating its robustness against outliers. Furthermore, we conduct ten iterations of experiments and maintain a constant projection dimension of 100 across three datasets. Our method consistently outperforms the compared methods in terms of accuracy, which demonstrates its effectiveness in extracting discriminative features and consequently enhancing classification accuracy. In summary, our method shows its superiority in capturing discriminative features for accuracy improvement.
4.5 Low-dimensional Data Visualization
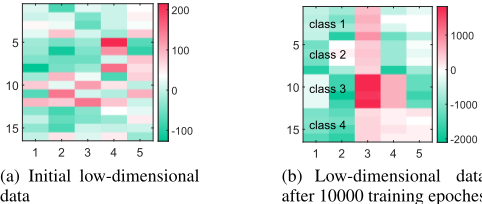
Figure 4 illustrates that the low-dimensional features obtained by applying the proposed PCA method are more discriminative, which indicates that features within the same category exhibit higher similarity. The figure consists of 16 samples displayed along the vertical axis from the four categories in the AR dataset. Each set of four consecutive samples corresponds to the same category and includes five selected attributes per sample, displayed along the horizontal axis. Figure 4(a) depicts the digitized features before PCA dimensionality reduction, in which different colors represent different digitized features whose values are up to four decimal places. It is evident that the feature values before PCA reduction are ambiguous, posing challenges in distinguishing between classes. Figure 4(b) depicts the visualized features after PCA reduction, which reveals that the feature values of four consecutive samples within the same category exhibit higher similarity, as indicated by color consistency. This observation provides evidence that the PCA method proposed in this paper effectively extracts the discriminative features present in the dataset.
4.6 Ablation Experiment
We conducted the ablation experiments to assess the efficacy of each component of our method. Table 3 presents its recognition outcomes across different configurations. The experimental results indicate that contrastive learning notably enhances recognition accuracy across six different datasets, demonstrating its capacity to extract discriminative features. Specifically, after the elimination of pseudo-negative instances, the proposed method achieves improvement of 0.31%, 1.1%, 0.06%, 2.14%, 2.16%, and 1.65% on the CMU PIE, Extended YaleB, AR+all, AR+glass, ORL, and Lung datasets, respectively. The efficacy of the pseudo-negative elimination strategy is particularly effective on Yale B, ORL, and Lung datasets, potentially owing to their reduced category diversity and consequent heightened clustering accuracy. Consequently, the removal of pseudo-negative instances yields more precise representations and hence strengthens the efficacy of contrastive learning mechanisms.
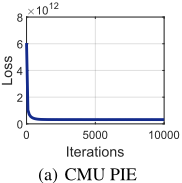
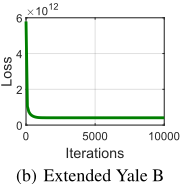
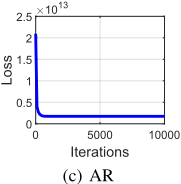
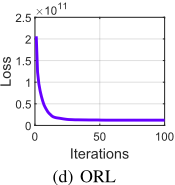
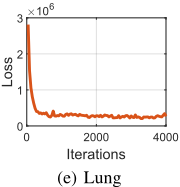
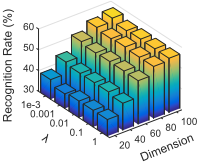
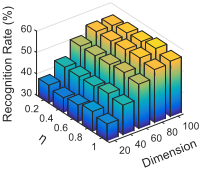
Figure 6: Parametric analysis on the Extended Yale B dataset
4.7 Parametric Analysis
Figure 6 illustrates the effect of two hyperparameters on the Extended Yale B dataset in each dimension. When the hyperparameter η is fixed as 0.8, the recognition rate under each dimension reaches its highest value when the weight λ of contrastive learning is set to around 0.0001. When setting λ with different values, the resulting changes in recognition accuracy are not significant. When fixing λ to 0.0001, it is found that the recognition accuracy under each dimension reaches its highest value when η is set to around 0.8, while the recognition accuracy does not change much when it is set to other values. Therefore, when λ is set to 0.0001 and η is set to 0.8, this method has the highest recognition accuracy.
4.8 Time Complexity Analysis
The time complexity of our method is comparable to the compared methods since they all rely on the SVD decomposition of the projection matrix W. Specifically, when applied to a dataset of dimension N ×d (N is sample number, d is feature dimension), PCA has a complexity of O(Nd2 ). The detailed optimization can be seen in the Supplementary material 2 .
4.9 Convergence Analysis
We analyze the convergence of our optimization algorithm with an extra experiment on these datasets. Figure 5 depicts the objective value with regard to the iteration number. The objective value decreases as the iteration number increases, and eventually, it converges to a constant value. It indicates that our algorithm successfully minimizes the objective function and achieves good convergence.
5 Conclusion
This work presents a novel weighted PCA method that aims to enhance feature discriminability and mitigate the influence of outliers. The weight assigned to each sample is determined based on its reconstruction error, with higher weights assigned to samples with lower reconstruction errors, which reduces the impact of outliers on the algorithm. It further improves discriminability by leveraging contrastive learning, which removes pseudo-negative samples to enhance the separability between low-dimensional features of different categories. Experiments on six datasets demonstrate the effectiveness and superiority of our method.
Acknowledgments
This work is supported by the National Natural Science Foundation of China under Grant 62176203 and Grant 62102306, the Fundamental Research Funds for the Central Universities, the Natural Science Basic Research Program of Shaanxi Province (Grant 2023-JC-YB-534), Shanghai Municipal Science and Technology Major Project (No.2018SHZDZX01), Key Laboratory of Computational Neuroscience and BrainInspired Intelligence (LCNBI) and ZJLab, and the Science and technology project of Xi'an (Grant 2022JHJSYF-0009), Initiative Postdocs Supporting Program (Grant BX20190262), the Fundamental Research Funds for the Central Universities(2242024k30038).
@inproceedings{ijcai2024p563,
  title     = {Reconstruction Weighting Principal Component Analysis with Fusion Contrastive Learning},
  author    = {Wang, Qianqian and Liu, Meiling and Feng, Wei and Jiang, Mengping and Xu, Haiming and Gao, Quanxue},
  booktitle = {Proceedings of the Thirty-Third International Joint Conference on
               Artificial Intelligence, {IJCAI-24}},
  publisher = {International Joint Conferences on Artificial Intelligence Organization},
  editor    = {Kate Larson},
  pages     = {5091--5098},
  year      = {2024},
  month     = {8},
  note      = {Main Track},
  doi       = {10.24963/ijcai.2024/563},
  url       = {https://doi.org/10.24963/ijcai.2024/563},
}
TY - CPAPER TI - Reconstruction Weighting Principal Component Analysis with Fusion Contrastive Learning AU - Wang, Qianqian AU - Liu, Meiling AU - Feng, Wei AU - Jiang, Mengping AU - Xu, Haiming AU - Gao, Quanxue T2 - Proceedings of the Thirty-Third International Joint Conference on Artificial Intelligence, IJCAI-24 PB - International Joint Conferences on Artificial Intelligence Organization PY - 2024 SP - 5091 EP - 5098 DO - 10.24963/ijcai.2024/563 UR - https://doi.org/10.24963/ijcai.2024/563 ER -Copied
Machine-readable versions of this paper, for tools and AI agents:





