
Long-term Detection and Monitory of Chinese Urban Village Using Satellite Imagery
Proceedings of the Thirty-Third International Joint Conference on Artificial Intelligence. AI for Good. Pages 7349-7357.
https://doi.org/10.24963/ijcai.2024/813
Keywords
- Data Mining: General
- Computer Vision: General
- Multidisciplinary Topics and Applications: General
- Machine Learning: General
Abstract
Urban villages are areas filled with rural-like improvised structures in Chinese cities, usually housing the most vulnerable groups.
Under the guidance of the Sustainable Development Goals (SDGs), the Chinese government initiated renewal and redevelopment projects, underscoring the meticulous mapping and segmentation of urban villages.
Satellite imagery is advanced and efficient in identifying urban villages and monitoring changes, but traditional methods neglect the morphological diversity in season, shape, size, spacing, and layout of urban villages, which is not satisfying for long-term wide-range data.
Here, we design a targeted approach based on Tobler’s First Law of Geography, using curriculum labeling to solve morphological diversity and semi-automatically generate segmentation for urban village boundaries.
Specifically, we use manually labeled data as seeds for pre-trained SegFormer models and incrementally fine-tune the model based on geographical proximity.
The rigorous experimentation across five diverse cities substantiates the commendable efficacy of our methodology. IoU metric demonstrates a noteworthy improvement of over 119% to baseline.
Our final results cover 265,050 urban villages across 433 cities in China over the past 10 years, and the analysis reveals the uneven redevelopment by geography and city scale. We further examine the within-city distribution and verify the urban scaling law associated with several socio-economic factors.
Our method can be used nationwide to decide redevelopment priority and resource tilt, contributing to SDG 11.1 on affordable housing and upgrading slums. The code and dataset are available at https://github.com/tsinghua-fib-lab/LtCUV.
- [Arvidsson et al., 2023] Martin Arvidsson, Niclas Lovsjö, and Marc Keuschnigg. Urban scaling laws arise from within-city inequalities. Nature Human Behaviour, 7(3):365-374, 2023.
- [Baidu, 2023] Baidu. Easydata intelligent data service plat- form, 2023.
- [Bettencourt et al., 2007] Luís M. A. Bettencourt, José Lobo, Dirk Helbing, Christian Kühnert, and Geoffrey B. West. Growth, innovation, scaling, and the pace of life in cities. Proceedings of the National Academy of Sciences, 104(17):7301-7306, 2007.
- [Bettencourt, 2013] Luís M. A. Bettencourt. The origins of scaling in cities. Science, 340(6139):1438-1441, 2013.
- [Bikis and Pandey, 2023] Addis Bikis and Digvijay Pandey. Squatter settlement and informal urbanization: causes and consequences. Environmental Science and Pollution Re- search, 30(9):23276-23294, 2023.
- [Cascante-Bonilla et al., 2021] Paola Cascante-Bonilla, Fuwen Tan, Yanjun Qi, and Vicente Ordonez. Curriculum labeling: Revisiting pseudo-labeling for semi-supervised learning. AAAI, 35(8):6912-6920, May 2021.
- [Cavalcanti et al., 2019] Tiago Cavalcanti, Daniel Da Mata, and Marcelo Santos. On the determinants of slum forma- tion. The Economic Journal, 129(621):1971-1991, 2019.
- [Chen et al., 2020] Ting Chen, Simon Kornblith, Moham- mad Norouzi, and Geoffrey Hinton. A simple framework for contrastive learning of visual representations. In ICML, Vienna, Austria, 2020. JMLR.org.
- [Chen et al., 2021] Longbiao Chen, Chenhui Lu, Fangxu Yuan, Zhihan Jiang, Leye Wang, Daqing Zhang, Ruixi- ang Luo, Xiaoliang Fan, and Cheng Wang. Uvlens: Ur- ban village boundary identification and population estima- tion leveraging open government data. UbiComp/IMWUT, 5(2):1-26, 2021.
- [Chen et al., 2022a] Boan Chen, Quanlong Feng, Bowen Niu, Fengqin Yan, Bingbo Gao, Jianyu Yang, Jianhua Gong, and Jiantao Liu. Multi-modal fusion of satellite and street-view images for urban village classification based on a dual-branch deep neural network. International Jour- nal of Applied Earth Observation and Geoinformation, 109:102794, 2022.
- [Chen et al., 2022b] Dongsheng Chen, Wei Tu, Rui Cao, Yatao Zhang, Biao He, Chisheng Wang, Tiezhu Shi, and Qingquan Li. A hierarchical approach for fine-grained ur- ban villages recognition fusing remote and social sensing data. International Journal of Applied Earth Observation and Geoinformation, 106:102661, 2022. [China Daily, 2023] China Daily. Urban villages to receive makeovers, 2023.
- [Crivellari et al., 2023] Alessandro Crivellari, Hong Wei, Chunzhu Wei, and Yuhui Shi. Super-resolution gans for upscaling unplanned urban settlements from remote sensing satellite imagery-the case of chinese urban vil- lage detection. International Journal of Digital Earth, 16(1):2623-2643, 2023.
- [Dovey and King, 2011] Kim Dovey and Ross King. Forms of informality: Morphology and visibility of informal set- tlements. Built environment, 37(1):11-29, 2011.
- [Ersi, 2023] Ersi. World imagery, 2023. Accessed: 2023-11- 02.
- [Fan et al., 2022] Runyu Fan, Jun Li, Fengpeng Li, Wei Han, and Lizhe Wang. Multilevel spatial-channel feature fusion network for urban village classification by fusing satellite and streetview images. IEEE Transactions on Geoscience and Remote Sensing, 60:1-13, 2022.
- [Gillam and Charles, 2019] Cintia Gillam and Anthony Charles. Community wellbeing: The impacts of inequal- ity, racism and environment on a brazilian coastal slum. World Development Perspectives, 13:18-24, 2019.
- [Gram-Hansen et al., 2019] Bradley J. Gram-Hansen, Patrick Helber, Indhu Varatharajan, Faiza Azam, Alejan- dro Coca-Castro, Veronika Kopackova, and Piotr Bilinski. Mapping informal settlements in developing countries using machine learning and low resolution multi-spectral data. In AAAI, AIES '19, page 361-368, New York, NY, USA, 2019. Association for Computing Machinery.
- [Hachmann et al., 2018] Samyra Hachmann, Jamal Jokar Arsanjani, and Eric Vaz. Spatial data for slum upgrading: Volunteered geographic information and the role of citizen science. Habitat international, 72:18-26, 2018.
- [Han et al., 2023] Zhenyu Han, Tong Xia, Yanxin Xi, and Yong Li. Healthy cities, a comprehensive dataset for envi- ronmental determinants of health in england cities. Scien- tific Data, 10(1):165, 2023.
- [He et al., 2017] Sylvia Y He, Jeongwoo Lee, Tao Zhou, and Dan Wu. Shrinking cities and resource-based econ- omy: The economic restructuring in china's mining cities. Cities, 60:75-83, 2017.
- [Helber et al., 2018] Patrick Helber, Bradley Gram-Hansen, Indhu Varatharajan, Faiza Azam, Alejandro Coca-Castro, Veronika Kopacková, and Piotr Bilinski. Generating material maps to map informal settlements. CoRR, abs/1812.00786, 2018.
- [Henderson et al., 2016] J. Vernon Henderson, Anthony J. Venables, Tanner Regan, and Ilia Samsonov. Building functional cities. Science, 352(6288):946-947, 2016.
- [Huang et al., 2015] Xin Huang, Hui Liu, and Liangpei Zhang. Spatiotemporal detection and analysis of urban vil- lages in mega city regions of china using high-resolution remotely sensed imagery. IEEE Transactions on Geo- science and Remote Sensing, 53(7):3639-3657, 2015.
- [Kim et al., 2019] Hye-Sung Kim, Yong Yoon, and Mary Mutinda. Secure land tenure for urban slum-dwellers: A conjoint experiment in kenya. Habitat International, 93:102048, 2019.
- [Kirillov et al., 2023] Alexander Kirillov, Eric Mintun, Nikhila Ravi, Hanzi Mao, Chloe Rolland, Laura Gustafson, Tete Xiao, Spencer Whitehead, Alexander C Berg, Wan-Yen Lo, et al. Segment anything. In ICCV, pages 4015-4026, 2023.
- [Labs, 2022] Dymaxion Labs. Ap latam website, 2022.
- [Li et al., 2014] Ling Hin Li, Jie Lin, Xin Li, and Fan Wu. Redevelopment of urban village in china-a step towards an effective urban policy? a case study of liede village in guangzhou. Habitat International, 43:299-308, 2014.
- [Li et al., 2021] Jianwei Li, Shengju Sun, and Jingang Li. The dawn of vulnerable groups: The inclusive reconstruc- tion mode and strategies for urban villages in china. Habi- tat International, 110:102347, 2021.
- [Liu et al., 2014] Yansui Liu, Fang Fang, and Yuheng Li. Key issues of land use in china and implications for policy making. Land Use Policy, 40:6-12, 2014.
- [Liu et al., 2020] Yufei Liu, Beiru Lv, Ling Peng, Tong Wu, and Sai Liu. Training samples dataset for building identi- fication in urban village. Journal of Global Change Data & Discovery, 4(2):181-187, 2020.
- [Miller, 2004] Harvey J Miller. Tobler's first law and spatial analysis. Annals of the association of American geogra- phers, 94(2):284-289, 2004.
- [Pan and Du, 2021] Wenjian Pan and Juan Du. Towards sus- tainable urban transition: A critical review of strategies and policies of urban village renewal in shenzhen, china. Land Use Policy, 111:105744, 2021.
- [Pan et al., 2020] Zhuokun Pan, Jiashu Xu, Yubin Guo, Yueming Hu, and Guangxing Wang. Deep learning seg- mentation and classification for urban village using a worldview satellite image based on u-net. Remote Sens- ing, 12(10):1574, 2020.
- [Planning and Bureau, 2014] Shanghai Municipal Planning and Natural Resources Bureau. Implementation opinions on the city's "urban village" land renovation, 2014.
- [Planning and Bureau, 2019] Shenzhen Municipal Planning and Natural Resources Bureau. Master plan of shenzhen urban village (old village) comprehensive improvement (2019-2025), 2019.
- [Sachs et al., 2022] Jeffrey D Sachs, Christian Kroll, Guil- lame Lafortune, Grayson Fuller, and Finn Woelm. Sus- tainable development report 2022. Cambridge University Press, 2022.
- [Source et al., 2022] Microsoft Open Source, Matt McFar- land, Rob Emanuele, Dan Morris, and Tom Augspurger. microsoft/planetarycomputer: October 2022, October 2022.
- [Sun et al., 2021] Zhongchang Sun, Jie Sun, Huadong Guo, Huiping Jiang, Jian Gao, and Jianbo Wang. A dataset of built-up areas of chinese cities in 2020, Dec 2021.
- [Tamiminia et al., 2020] Haifa Tamiminia, Bahram Salehi, Masoud Mahdianpari, Lindi Quackenbush, Sarina Adeli, and Brian Brisco. Google earth engine for geo-big data applications: A meta-analysis and systematic review. IS- PRS Journal of Photogrammetry and Remote Sensing, 164:152-170, 2020.
- [Teams, 2022] Slum Dwellers International Profiling Teams. Knowyourcity data for research, 2022.
- [Tjia and Coetzee, 2022] Dinao Tjia and Serena Coetzee. Geospatial information needs for informal settlement upgrading-a review. Habitat International, 122:102531, 2022.
- [Trindade et al., 2021] Tatiana CG Trindade, Heather L MacLean, and I Daniel Posen. Slum infrastructure: Quan- titative measures and scenarios for universal access to ba- sic services in 2030. Cities, 110:103050, 2021.
- [UN DESA, 2023] UN DESA. The Sustainable Develop- ment Goals Report 2023: Special Edition -July 2023. UN DESA, New York, USA, 2023.
- [UN-HABITAT, 2023] United Nations Human Settle- ments Programme UN-HABITAT. Sdg indicator metadata, 2023.
- [Verma et al., 2019] Deepank Verma, Arnab Jana, and Krithi Ramamritham. Transfer learning approach to map urban slums using high and medium resolution satellite imagery. Habitat International, 88:101981, 2019.
- [Wang, 2022] Chuan Wang. Urban village on a global scale: Diverse interpretations of one label. Urban Geography, 43(2):184-205, 2022.
- [Xi et al., 2023] Yanxin Xi, Yu Liu, Tong Li, Jingtao Ding, Yunke Zhang, Sasu Tarkoma, Yong Li, and Pan Hui. A satellite imagery dataset for long-term sustainable devel- opment in united states cities. Scientific Data, 10(1):866, 2023.
- [Xiao et al., 2023] Congxi Xiao, Jingbo Zhou, Jizhou Huang, Hengshu Zhu, Tong Xu, Dejing Dou, and Hui Xiong. A contextual master-slave framework on urban re- gion graph for urban village detection. In ICDE, pages 736-748, Anaheim, CA, USA, 2023. IEEE Computer So- ciety.
- [Xie et al., 2021] Enze Xie, Wenhai Wang, Zhiding Yu, An- ima Anandkumar, Jose M Alvarez, and Ping Luo. Seg- former: Simple and efficient design for semantic seg- mentation with transformers. NeurIPS, 34:12077-12090, 2021.
- [Zhang et al., 2024] Xin Zhang, Yu Liu, Yuming Lin, Qing- min Liao, and Yong Li. Uv-sam: Adapting segment any- thing model for urban village identification. In AAAI, vol- ume 38, pages 22520-22528, 2024.
References were extracted automatically from the PDF and may contain errors.
Full text extracted automatically from the PDF; figures, tables and equations may differ. The PDF is the version of record.
1 Introduction
By 2020, an estimated 1.1 billion urban residents lived in informal settlements [UN DESA, 2023]. In the specific context of China, informal settlements, or more commonly "urban villages" [Wang, 2022], represent a widespread and intricate urban area characterized by unplanned and improvised housing structures [Dovey and King, 2011; Bikis and Pandey, 2023], an absence of formal land tenure [Kim et al., 2019], and the possible inadequacy of essential infrastructure and services [Trindade et al., 2021; Han et al., 2023; Xi et al., 2023]. Significantly, urban villages predominantly host marginalized and vulnerable populations [Li et al., 2021] who are beset by poverty, discrimination, and deep inequality, all of which pose formidable challenges to social justice and human rights [Gillam and Charles, 2019]. Although the Chinese government has recently started a project on the redevelopment of urban villages [China Daily, 2023], the scarcity of data presents substantial challenges to the work. Unplanned urban growth leads to rapidly changing urban village boundary [Cavalcanti et al., 2019], significantly impeding the government's effort to identify and renew urban villages, thereby hindering United Nations Sustainable Development Goals of creating "inclusive, safe, resilient, and sustainable" cities [Sachs et al., 2022].
The solution lies in adopting innovative data sources and machine learning technology for urban villages [Hachmann et al., 2018]. With the help of various deep learning technologies [Pan et al., 2020; Crivellari et al., 2023], high-resolution satellite imagery can be used to detect the spatio-temporal distribution of urban villages [Huang et al., 2015; Chen et al., 2022b]. Furthermore, street view images [Chen et al., 2022a; Fan et al., 2022] and social sensing data such as points of interest (POIs), vehicle trajectories, or social media checkin records [Chen et al., 2021; Chen et al., 2022b] can also be used to identify the boundary of urban villages. Unfortunately, the variations in satellite imagery quality resulted in a distinct concentration of data in large cities or regions, leading to a restricted and less comprehensive perspective [Tjia and Coetzee, 2022]. The morphological diversity of urban villages, derived from geographic factors, climatic influences, and historical development [Cavalcanti et al., 2019], introduces a significant challenge with a mismatch of features between training and inference, making the long-term widerange monitoring harder.
To solve the morphological diversity, we design a semiautomatically workflow to provide a more comprehensive and reliable segmentation based on Tobler's First Law of Geography [Miller, 2004]. Since the law indicates that "near things are more related than distant things", which implies the hidden structure of the data, we take geographical proximity as the entry point. We take the image segmentation model SegFormer [Xie et al., 2021] as a backbone, using satellite images to pre-train for cross-year differences and utilize curriculum labeling on geographically nearby cities for the morphological diversity. The extensive array of experiment results from five diverse cities provides robust evidence for the exceptional performance of our methodology. The precision in identifying urban villages attains 0.9, while the IoU surpasses the baseline by an impressive 119%. Using 426,335 satellite images sourced from Esri World Imagery [Ersi, 2023], our result successfully covers all 433 Chinese cities since 2014. It comprises 265,050 identified urban villages, providing the first comprehensive coverage for urban villages, which will benefit the resource allocation of redevelopment projects.
The long-term analysis shows an inequality problem of previous urban village reconstruction, where disadvantaged cities cannot redevelop large urban villages. The city scale analysis also suggests an uneven decrease in urban villages between super-large and small cities. We also examine urban villages' distance to the city center and confirm the scaling relationship between urban villages and various socio-economic factors closely related to within-city inequality [Arvidsson et al., 2023]. Our analysis successfully derived insights into urban villages and provided information for future redevelopment projects and policies, helping address long-standing challenge of data scarcity for vulnerable populations.
2 RelatedWork
2.1 Urban Village Identification
Identifying urban villages within a city is the foundation for further redevelopment. Adequate research has been carried out on the classification problem of whether urban villages exist in the corresponding satellite images. Traditional machine learning algorithms, such as support vector machines, can be used on handcrafted features [Huang et al., 2015]. Convolutional neural networks (CNN) provide a more automatic and effective feature extraction and classification method [Chen et al., 2022a; Fan et al., 2022]. Other considerations, such as multidimensional data [Chen et al., 2021] or hierarchically structured urban region graph [Xiao et al., 2023], have also been explored. SAM [Kirillov et al., 2023], renowned for its robust image segmentation capabilities, has been applied to urban village segmentation [Zhang et al., 2024], yielding promising results. However, merely determining the existence of urban villages is insufficient for renewal projects, especially when determining the demolition boundary. Employing image segmentation offers more valuable information on the boundary but requires more data and complex models. Many efforts have been made to apply the segmentation framework to urban villages, such as Mask RCNN model [Chen et al., 2021] and U-Net [Pan et al., 2020]. Furthermore, Crivellari et al. [Crivellari et al., 2023] provide an interesting attempt by up-scaling the satellite data to a higher resolution using SR-GAN, which can significantly improve the performance of downstream segmentation.
Nevertheless, these works are mainly based on large cities, limiting their generalizability. As spontaneous constructions, urban villages in northern China may prefer facing south and wide spacing for sunlight. In contrast, those in southern China prefer denser layouts and more layers for economic benefit. The morphology of urban villages differs in geography and climate, limiting previous work to specific areas and could not provide a more comprehensive analysis.
2.2 Urban Village Dataset
In general, scholars and organizations have made concerted efforts to provide openly accessible datasets of informal settlements. Know Your City project of Slum Dwellers International has gathered data from voluntary reporting by community members, including 7,712 slums in 224 cities in 18 countries, covering details on their locations, extents, populations, and facilities [Teams, 2022]. Similarly, Dymaxion Labs publishes the AP Latam project with slum boundaries in six Latin American cities [Labs, 2022]. However, while these initiatives are invaluable, the cost of human power and money persists in traditional field surveys, limiting their coverage.
The use of machine learning technology has led to more available data. Helber [Helber et al., 2018] and GramHansen [Gram-Hansen et al., 2019] employ multi-resolution spectral imagery and machine learning to release datasets encompassing slum data from 7 global-south cities. Deepak Verma et al. [Verma et al., 2019] use high-resolution satellite imagery and the Inception model to compile slums in Mumbai. However, it should be noted that high-resolution satellite datasets suitable for urban villages are often available only in major cities, and urban villages may have different morphological characteristics in small cities, making these datasets unrepresentative and exacerbating insufficient attention and inequality.
In China, obtaining accessible urban village data also presents challenges. Open platforms like OpenStreetMap usually fail to provide information about the unnamed roads and regions of urban villages. While the Shenzhen municipal government disclosed official maps indicating urban villages [Planning and Bureau, 2019], their geographic coordinates are not publicly available. Chen et al. [Chen et al., 2022a] has provided the dataset S2UV , featuring satellite and street view images of Beijing, Tianjin, and Shijiazhuang. Fan et al. [Fan et al., 2022] extended Chen's dataset to include Shenzhen. In addition, Liu et al. [Liu et al., 2020] published a detailed dataset of 2,328 building footprints from a specific urban village, which regrettably does not include the boundaries of urban villages. Despite the significance of these efforts, a comprehensive dataset for urban villages in China remains lacking.
3 Method
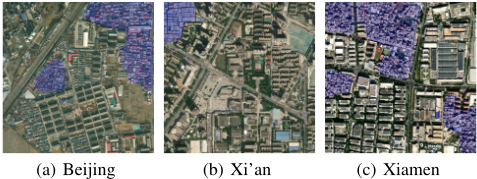
Figure 1 illustrates samples in satellite imagery, with expertidentified urban villages overlapped by blue masks. The morphological characteristics of urban villages exhibit significant variations compared to surrounding urban areas with highdensity small-scale structures with low spacing. It is also observable differences in different cities. Urban village shows slightly larger structures in Xi'an than in Beijing, both with a regular grid-like spacing; while in Xiamen structures are smaller with a more chaotic layout, and the shadows indicate higher heights. Our workflow is designed to distinguish urban villages from urban landscapes and provide precise boundary information through machine learning algorithms on satellite imagery.
3.1 Definition of Urban Village
As a complex phenomenon characterized by morphological diversity, urban villages lack a unified quantitative definition. After a comprehensive examination of the United Nations definitions of informal settlements [UN DESA, 2023], the UN-Habitat definition of slums [UN-HABITAT, 2023], the operational definitions employed by the Chinese government [Planning and Bureau, 2014; Planning and Bureau, 2019], and a substantial body of relevant literature [Li et al., 2014; Li et al., 2021; Wang, 2022; Chen et al., 2021; Chen et al., 2022a], we propose the following definition: Urban villages are continuous urban areas filled with small-scale structures of low height with low spacing and high density that possess irregular and ill-defined road networks. This definition is formulated to capture the morphological coherence of their road network and structural attributes, as visually discerned in satellite imagery. Some commonly used characteristics, such as land tenure, facility accessibility, and population density, have been omitted since they cannot be reflected by satellite imagery.
3.2 Data Source
Open-source web platforms such as Esri World Imagery [Ersi, 2023], Google Earth Engine [Tamiminia et al., 2020], and Microsoft Planetary Computer [Source et al., 2022] have significantly facilitated cost-effective access to high-quality satellite imagery repositories for researchers and NGOs. We used Esri World Imagery in this study since it is cost-free and integrates multiple years of data from multiple satellites. The resulting dataset covers urban areas in all 433 Chinese cities since 2014. The boundary of cities is suggested by Sun et al. [Sun et al., 2021] using Sentinel data. We collected a total of 5,074,756 satellite images, each with dimensions of 256x256 pixels across 3 RGB bands and a resolution of 1.1 meters. Due to the variability in satellite image capture times and the 3-year update frequency of Esri World Imagery, we selected the most recent images from each update stage as representative samples. Specifically, we chose images closest to 2014, 2017, 2020, and 2023.
3.3 Data Annotation
The high-quality annotated data is of great importance in training segmentation models. Given the time-intensive and expertise-demanding nature of the annotation process, we adopted a crowd-sourcing diagram to alleviate the workload. We recruited 62 incentivized researchers and students specializing in urban planning and remote sensing. Subsequently, we used a crowd-sourcing platform on the Web [Baidu, 2023] to distribute satellite images among participants. To ensure the quality of the annotations, we assigned each image to three different participants for cross-validation. Furthermore, each annotation underwent a meticulous review and refinement process carried out by expert researchers to further enhance the quality of the annotation.
Given the diverse nature of urban villages, the annotated dataset must include variations in geographic zones and morphological characteristics to ensure the precision of the inferred data. In this research, we manually annotated a total of 1032 satellite images obtained from six distinct cities: Beijing, Xi'an, Shanghai, Shenzhen, Shenyang, and Wuhan. The selection was guided by geographic zones and urban morphology to encompass inherent diversity within urban villages. The annotated dataset is used as the ground truth afterward.
3.4 Pretraining and CurriculumLabeling
Existing semantic segmentation models are typically trained on imagery with richer content information, which limits their ability to recognize features in satellite images. Moreover, the morphological diversity poses a significant challenge to out-of-distribution inference solely with annotated data. To overcome such challenges, we employ a combination of pretraining and curriculum labeling [Cascante-Bonilla et al., 2021].
To enhance the segmentation model's ability to capture satellite image features over multiple years, we employ a Simple Framework for Contrastive Learning (SimCLR) [Chen et al., 2020] to pretrain a foundational model using the whole satellite imagery dataset. Through contrastive learning with different data augmentation results on the same image, the model learns to grasp the features of satellite images, resulting in pre-trained model parameters θ0.
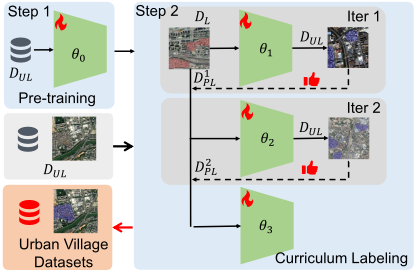
Based on the pre-trained model, we utilize a semisupervised approach based on curriculum labeling (CL) [Cascante-Bonilla et al., 2021] to improve out-ofdistribution performance. Specifically, we fine-tune the pre-trained model with labeled data DL to obtain new parameters θ1. Then we leverage θ1 on unlabeled data DUL for segmentation, generating pseudo-labels and confidence scores. Subsequently, we select high-confidence pseudo-labeled samples D1PL to augment the seed data DL, fine-tuning the pre-trained model again to obtain new parameters θ2. Subsequently, we use θ2 to replace θ1 with additional high-confidence pseudo-labels D2PL, and iteratively repeat such a semi-supervised cycle (Figure 2).
According to Tobler's First Law of Geography [Miller, 2004], the morphology of urban villages in geographically proximate cities can be assumed to be more relevant. Therefore, nearby cities are selected for pseudo-labels during each iteration, gradually expanding the scope. This iterative process gradually integrates geographical diversity, ensuring model stability through curriculum-like learning. In each iteration, the model θt is trained from scratch θ0 to avoid concept drift.
3.5 Implementation
We adopt SegFormer [Xie et al., 2021] as our foundational model, providing an expressive boundary segmentation framework with a simple and lightweight design. For pre-training, we set MiT-B0 as the backbone in the SimCLR framework with 100 epochs. For fine-tuning, we start with labeled data of Beijing DL with the size of 342 images, select the AdamW optimizer, and incorporate a polynomial function annealing scheduler to decrease the learning rate gradually. The learning rate is set at 0.0005 and batch size is fixed at 32.
For curriculum labeling, the first round of curriculum labeling in DUL yields 5,098 pseudo-labels, 1793 of which are selected as D1PL. Similarly, the second round of curriculum labeling yields 4,079 pseudo-labels and further D2PL with 1,670 images is added. The final model θ3 is trained on 342 labels and a total of 3,463 pseudo-labels.
3.6 Evaluation
We use the Beijing dataset as the training set and the other six cities as the test set, which can verify out-of-distribution performance to some degree. For all predicted urban village boundaries, we evaluated both the detection and the segmentation accuracy. We mark predictions that spatially overlap with any annotated urban villages as true positive, otherwise false positive. Then, the precision, recall, and F1 score can be calculated as detection metrics. To assess segmentation, the widely-used Intersection over Union (IoU) metric is used, calculated as the intersection area divided by the union area between the prediction and ground truth. To verify the effectiveness of the proposed workflow, we choose the original SegFormor as a baseline and examine the performance improvements brought by pre-training, fine-tuning, and curriculum learning step by step.
| Model | IoU | Precision | Recall | F1-Score |
|---|---|---|---|---|
| SegFormer | 0.304 | 0.457 | 0.657 | 0.533 |
| Pre-train θ0 | 0.563 | 0.774 | 0.775 | 0.768 |
| Fine-tune θ1 | 0.612 | 0.888 | 0.713 | 0.787 |
| CL round 1 θ2 | 0.656 | 0.879 | 0.777 | 0.824 |
| CL round 2 θ3 | 0.665 | 0.900 | 0.771 | 0.830 |
4 Results
4.1 Performance
Table 1 shows the overall performance of our method. The proposed workflow achieves the best performance and successfully adapts to the morphological diversity of urban villages. For detection, our model achieved an average of 0.900 precision and 0.830 F1 score. For segmentation, our method outperforms the original SegFormer with a 0.665 IoU. The pre-training and curriculum labeling led to a total of 119% performance improvements, proving that our procedure is significant in out-of-distribution scenarios.
Further analysis reveals that pre-training and curriculum labeling are efficient, with varying impacts. Pre-training and fine-tuning results in the most significant performance, yielding a 0.308 improvement on IoU. The curriculum labeling in the first round also exerts a notable influence, providing an additional improvement of 7.2%. However, the second round of curriculum labeling is relatively marginal. Although it contributes to an increase of 2.4% in detection accuracy, its impact on segmentation is limited to 1.4%. It is reasonable to assume that further curriculum labeling can bring a slighter performance improvement.
Most of the urban villages can be detected accurately, and the boundary is aligned with experts' annotations. Despite seasonal, geological, and morphological differences, the result is robust across cities and years. Although data availability in small cities in 2014 still hinders us from obtaining detailed information, our results can be a foundation for urban village renewal projects in China.
4.2 Geographical Disparities
Figure 3 illustrates the geographical distribution of urban villages in China, with varying shades of color that denote the proportion of the urban village area relative to the urbanization area. The analysis excludes the Xizang region due to unavailable data. The figure reveals a notable geographical disparity in urban villages. In northern provinces (B) such as Hebei, Shandong, and Shanxi, urban villages occupy approximately 7.7% to 11.6% of the urban area, significantly higher than the national average of 6.4%. Another concentration is observed in the southern China region (D), including Fujian, Taiwan, and Guangdong, at about 13% by 2023. On the contrary, urban villages are significantly less prevalent in eastern developed regions (A) like Jiangsu, Zhejiang, and Shanghai. The results show notable geographical disparity and imply previous inequality in redevelopment order and resource tilt. Notably, there are significant variations even within geographically adjacent areas, possibly also attributed to divergent redevelopment policies across provinces [Liu et al., 2014].
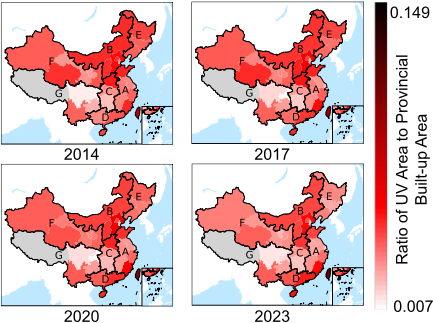
On the other hand, comparing the differences over various years provides a more insightful perspective on urban villages decreasing related to urbanization and redevelopment projects [Pan and Du, 2021]. There is a significant decline in urban villages in northern provinces between 2014 and 2023, probably related to redevelopment initiatives by local governments. This phenomenon is most prominently manifested in northeastern China, one of the first areas to complete urbanization. In Heilongjiang, the proportion of urban villages in the area has decreased markedly from more than 8.2% to less than 4.7%, which aligns with the widespread discourse on the shrinking of cities in this area [He et al., 2017]. On the contrary, there is a more pronounced increase in southern provinces, particularly in Guangxi, where the proportion of urban villages has increased from less than 3.1% to approximately 6.8%. Given that urban villages are often associated with rapid urbanization, the notable increase can be attributed in part to the 45.3% expansion of the urban area in Guangxi since 2014. The disparities we revealed provide a broad perspective temporally and geographically, providing a solid basis to capture the status and make corresponding policies.
4.3 City Scale Disparities
In addition to geographical disparities, the size of a city often influences the distribution of urban villages, where the rapid influx of population is a key factor in the emergence of urban villages. Here, we categorize Chinese cities into three groups based on population size by 2023: 327 small-tomedium cities (with populations below 1 million), 85 large cities (with populations exceeding 1 million but below 5 million), and 21 super-large cities (with populations exceeding 5 million). We then examine the areas and numbers of urban villages of different cities over the years.
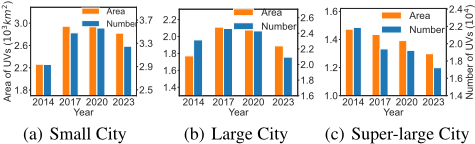
For small-to medium-cities (Figure 4), we observe a pronounced increase in urban villages until 2020, reaching 2,600 square kilometers and exceeding 31,000 in numbers, aligned with the wider urbanization in this period. Due to unavailable satellite images in some cities, the 2014 data significantly underestimated the scale of urban villages but will not alter the overall growth trend. From 2020 to 2023, there is a notable decrease in urban villages, with the number decreasing more rapidly (5%) than the area (3%). This implies that more small urban villages have undergone redevelopment, while reconstruction in larger urban villages is limited. Given that larger urban villages involve more residents and more complex land ownership issues, the potentially stronger resistance to redevelopment can lead to such a trend.
For large cities, we observe similar but different situations. The number and area of urban villages in large cities undergo a similar "increase-decrease" trend. However, the absence of 2014 data in some cities alters the credibility of growth before 2017. Furthermore, there has been a gradual acceleration in the demolition of urban villages since 2017. The total area has been reduced by approximately 120 square kilometers from its peak, and the decline is greater than 11% in number, with most reduction occurring between 2020 and 2023. Compared to small-to-medium cities, large cities reached their urbanization peak earlier, leading to a more substantial decline. It is also noteworthy that the number of urban villages is decreasing more rapidly than the area, likely related to the aforementioned resistance to redevelopment.
For super-large cities with populations exceeding 5 million, their urbanization has reached a relatively high level. Due to limited land available for construction, local governments have a stronger incentive to redevelop urban villages for suitable construction land. As observed in Figure 4, urban village areas in super-large cities have consistently declined, falling from more than 18,000 in 2014 to less than 16,000 in 2023, with a decline rate exceeding 11%. An intriguing observation is that the reduction in urban village areas and numbers is asynchronous; the urban village areas experience a steady and accelerating decrease, while the number of urban villages displays a period of stagnation. Considering the government's fiscal constraints, a reasonable inference is that the transition in renewal strategies may lead to concentrated funds to certain larger urban villages.
As urbanization gradually slows down, redevelopment takes precedence in demolishing urban villages, and such a process varies across cities on different scales [Li et al., 2021; Pan and Du, 2021]. Our results imply that the financial resources possessed by super-large cities enable them to address large urban villages, whereas small- and medium-sized cities lack such ability. This could lead to equity and fairness issues since the vulnerable groups in small cities find it harder to take redevelopment opportunities, which might worsen without adequate attention.
4.4 Within-City Distribution
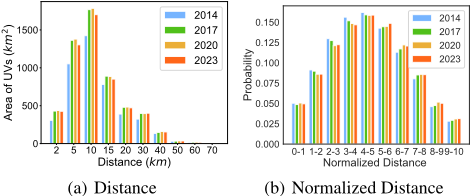
Another interesting issue pertains to the distribution of urban villages within cities. Economic models [Henderson et al., 2016] have previously suggested that redevelopment costs and mis-expectation may lead to urban villages near city centers. Those urban villages near city centers, exemplified by well-known cases such as Gangxia Village in Shenzhen, typically exhibit higher building density, larger populations, and higher redevelopment priority. In our results, we employ the distance from the city center as a metric for the distribution of urban villages within cities.
Figure 5(a) illustrates the urban village area accumulated by distance from the city center. Most urban villages are within 10 kilometers of the city center, with an accumulated area of 3,430 square kilometers. However, those within a 2-kilometer radius are comparatively rare, totaling approximately 425 square kilometers. In contrast, urban villages more than 30 kilometers from the city center sum up a mere 207 square kilometers. Given the limitations imposed by the scale of the city itself, the rapid decay in the tail is reasonable.
The city scale may affect our understanding of the distribution within the city of urban villages. Figure 5(b) normalizes the distance to the city center to a range between 0 and 10 with equal-width binning. It also normalizes the areas of urban villages, making it a probability distribution relative to distance. More than 50% urban villages are concentrated on the city's outskirts, with a smaller probability in the outer suburbs.
Urbanization dominates as substantial population growth and unplanned construction lead to more urban villages in the outskirts. In the city center, the dominant force changes to redevelopment driven by property prices, resulting in similar results as [Henderson et al., 2016]. The slight distribution difference between 2014 and 2023 can also be explained: as China's urbanization slows, redevelopment in urban centers gradually shifts the distribution out. The distribution within the city is important to the future renewal project considering the balance of cost and benefit. Redevelopment in the city center will yield greater benefits but will cost more, while renovating in the outer suburbs will be the opposite. Our method, which has precise location and boundary information, offers microscale analyses of distribution within cities, thus enabling more in-depth research into site selection and redevelopment priority.
4.5 Socio-economic Factors and Scaling Law
As previously analyzed, the urban villages are closely tied to the urbanization and redevelopment process, indicating that the socio-economic factors will significantly shape urban villages. Therefore, within-city inequalities caused by socioeconomic factors will also be reflected in urban villages. Here, the urban scaling law is adopted as the primary analytical perspective to investigate the influences of the physical foundation, economic conditions, and housing welfare in urban villages.
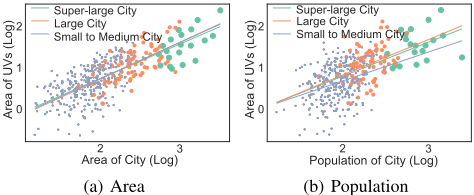
The urban scaling law [Bettencourt, 2013] refers to the power law of various factors in the city, which is often expressed as Y = Y0 · N β where N represents fundamental characteristics such as population, and Y can denote various indicators related to the city. Studies [Bettencourt et al., 2007] have shown that infrastructure-related factors, such as the number of gas stations, often exhibit β values less than 1. In contrast, socio-economic factors such as patents tend to have β values greater than 1. The urban scaling law represents a crucial characteristic of cities and is believed to arise from within-city inequalities [Arvidsson et al., 2023]. In our analytical process, the scaling law can be transformed into the form log(Y ) = β log(N) + log(Y0), which facilitates the application of linear regression.
Physical Foundation: The area and population of a city are fundamental attributes that can influence urban villages. Figure 6(a) shows the relationship between the urban development area and the urban village area on a double logarithmic coordinate. Different points represent three categories of cities, and the dashed lines depict the linear regression results under the fixed-effects model. As urban villages are inherently part of the city area, an increase in the urban area corresponds to a proportional increase in urban villages (R2 = 0.516, p = 0.000). It should be noted that the regression slope (β) is approximately 0.863, indicating a relatively consistent impact across different categories. This aligns with theoretical inferences from previous research [Bettencourt et al., 2007], suggesting a sublinear growth between infrastructure-related factors and the city size.
Similarly, Figure 6(b) illustrates the relationship between urban villages and the population, also in a double logarithmic coordinate, revealing a positive correlation (R2 = 0.31, p = 0.0007). Once again, the regression demonstrates a sublinear growth (β = 0.794) in the city's population, indicating that the growth rate of urban villages lags behind the increase in the city's population. In particular, within the small and medium cities group, this coefficient is considerably lower than the average (β = 0.704), suggesting a comparatively slower growth of urban villages in smaller cities.
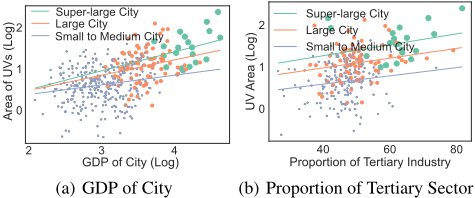
Economic Conditions: As a phenomenon intrinsically linked to urbanization, urban villages are closely related to economic development. Similarly, Figure 7(a) illustrates the relationship between GDP and the area of urban villages for different types of cities, revealing a significant positive correlation (R2 = 0.223, p = 0.000). However, unlike the physical foundation of cities, we observe a rather small slope (β = 0.16), meaning the growth rate of urban villages is significantly behind the economic scale of cities. This observation may related to agglomeration effects operating on and intensifying urban inequality [Arvidsson et al., 2023].
Figure 7(b) offers a partial explanation from the economic structure, examining the impact of tertiary industry proportion. Only the urban village area is transformed by logarithm here. Regression results (R2 = 0.141, p = 0.000) indicate that a one-unit increase in the proportion of the tertiary industry leads to approximately a 1.3-fold increase in the urban village area, consistent across cities of different scales. Considering that urban villages frequently provide affordable housing of high density [Pan and Du, 2021] for migrant workers involved in the service industry, this outcome implies that as urban economic structures shift toward the service sector, the economic role played by urban villages becomes increasingly significant, warranting attention from policymakers.
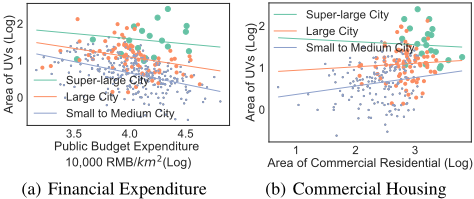
Housing Welfare: The emergence of urban villages is widely attributed to insufficient housing within cities [Li et al., 2021; Bikis and Pandey, 2023], requiring local governments to provide welfare mechanisms such as affordable housing. Here, we selected two pertinent indicators: the financial expenditure of cities and the area of commercial housing within cities. Figure 8(a) illustrates a significant downward trend in urban villages with the increasing of city financial expenditure (p = 0.000, r2 = 0.100), with an approximate slope of β = -0.454. This result indicates that higher financial expenditure by local governments reflects more opportunities for redevelopment programs to address existing urban villages.
On the other hand, the impact of commercial housing supply within cities is less straightforward. For super-large cities, the increase in commercial housing supply appears to mitigate the growth of urban villages (β = -0.068). However, for large and medium-sized cities, this conclusion is less reliable (β = 0.081 and 0.084 respectively). This result suggests that addressing the urban village issue requires a more nuanced understanding of city characteristics and simplistic intervention in land supply and the housing market may not suffice.
Our analysis proves the correlations between urban villages and various socio-economic factors and further investigates within the framework of urban scaling laws. Considering that the cumulative advantage mechanism provides sustained growth opportunities for "heavy tail" people and brings about the macro-level scaling law, our results imply the potential similar mechanism that harms fairness and leads to observing urban villages. Further analysis may inform policy formulation that is closely connected to vulnerable populations.
5 Conclusion
This study presents a comprehensive approach inspired by Tobler's first law of geography, using image segmentation models and appropriate self-supervised learning strategies for urban village segmentation. We provide accurate boundary and corresponding satellite imagery data on urban villages in 433 cities for 265,050 urban villages over the past 10 years. Analyses underscore the disparities in Chinese urban villages, including geographical distribution, urban scale, city structure, and socio-economic factors. The related issue of inequity should be carefully considered when formulating redevelopment strategies for the government. Our method addresses under-explored morphological diversity, filling gaps in coverage and perspectives in existing literature. By offering an adequate database for vulnerable populations within urban villages, our study has significant implications for SDG 11.1 and furthering research in related fields. Future efforts should focus on comprehensively validating model results to ensure the accuracy of analytical conclusions and establishing a robust data platform to address related urban issues.
Acknowledgements
This work was supported in part by the National Key Research and Development Program of China under 2023YFB2904804, the National Natural Science Foundation of China under 62171260, and 62272260.
Contribution Statement
Y. Li, the corresponding author of this paper, advised on all parts of this paper. Q. Liao also supervised this project. Y. Lin and X. Zhang designed the work and wrote the manuscript, which should be considered equally contributing to this work. Y. Liu and Z. Han also provided help in the analysis and discussion of results. All authors reviewed and approved the final version of the manuscript.
@inproceedings{ijcai2024p813,
  title     = {Long-term Detection and Monitory of Chinese Urban Village Using Satellite Imagery},
  author    = {Lin, Yuming and Zhang, Xin and Liu, Yu and Han, Zhenyu and Liao, Qingmin and Li, Yong},
  booktitle = {Proceedings of the Thirty-Third International Joint Conference on
               Artificial Intelligence, {IJCAI-24}},
  publisher = {International Joint Conferences on Artificial Intelligence Organization},
  editor    = {Kate Larson},
  pages     = {7349--7357},
  year      = {2024},
  month     = {8},
  note      = {AI for Good},
  doi       = {10.24963/ijcai.2024/813},
  url       = {https://doi.org/10.24963/ijcai.2024/813},
}
TY - CPAPER TI - Long-term Detection and Monitory of Chinese Urban Village Using Satellite Imagery AU - Lin, Yuming AU - Zhang, Xin AU - Liu, Yu AU - Han, Zhenyu AU - Liao, Qingmin AU - Li, Yong T2 - Proceedings of the Thirty-Third International Joint Conference on Artificial Intelligence, IJCAI-24 PB - International Joint Conferences on Artificial Intelligence Organization PY - 2024 SP - 7349 EP - 7357 DO - 10.24963/ijcai.2024/813 UR - https://doi.org/10.24963/ijcai.2024/813 ER -Copied
Machine-readable versions of this paper, for tools and AI agents:





