
Domain Adaptation with Joint Loss for Consistent Regression and Ordinal Classification in the Proxy Means Test for Poverty Targeting
Proceedings of the Thirty-Third International Joint Conference on Artificial Intelligence. AI for Good. Pages 7403-7411.
https://doi.org/10.24963/ijcai.2024/819
Keywords
- Machine Learning: General
- Data Mining: General
- Multidisciplinary Topics and Applications: General
Abstract
Previous domain adaptation methods are designed to work for a single task, either classification or regression. In this paper, the task of the learner is to produce both an estimation and an ordinal classification of instances that are consistent in that the classification of instances into quantiles is derived from the estimated values. We propose an extension of the boosting for transfer method (TrAdaBoost), Joint Quantile Loss Boosting Domain Adaptation (TrAdaBoost.JQL) for regression transfer learning, that aims to jointly minimize regression and ordinal classification errors. Motivated by the real-world problem of poverty targeting using the Proxy Means Test, we empirically show that TrAdaBoost.JQL can consistently reduce RMSE and inclusion and exclusion errors for estimating per capita household expenditure, across a wide variety of districts in Indonesia, compared to other reweighting-based and invariant feature representation-based domain adaptation methods. We design TrAdaBoost.JQL to be flexible as to the chosen eligibility (poor) threshold used in poverty targeting practice and as to whether estimation or ordinal classification accuracy is prioritized.
- [Al-Stouhi and Reddy, 2011] Samir Al-Stouhi and Chan- dan K. Reddy. Adaptive Boosting for Transfer Learn- ing Using Dynamic Updates. In Dimitrios Gunopu- los, Thomas Hofmann, Donato Malerba, and Michalis Vazirgiannis, editors, Machine Learning and Knowledge Discovery in Databases, pages 60-75. Springer-Verlag, Berlin, 2011.
- [Alatas et al., 2016] Vivi Alatas, Ririn Purnamasari, Matthew Wai-Poi, Abhijit Banerjee, Benjamin A Olken, and Rema Hanna. Self-Targeting: Evidence from A Field Experiment in Indonesia. Journal of Political Economy, 124(2):371-427, 2016.
- [Banerjee et al., 2018] Abhijit Banerjee, Rema Hanna, Jor- dan Kyle, Benjamin A Olken, and Sudarno Sumarto. Tan- gible Information and Citizen Empowerment: Identifica- tion Cards and Food Subsidy Programs in Indonesia. Jour- nal of Political Economy, 126(2):451-491, 2018.
- [Banerjee et al., 2023] Abhijit Banerjee, Rema Hanna, Ben- jamin A Olken, Elan Satriawan, and Sudarno Sumarto. Electronic Food Vouchers: Evidence from an At-Scale Experiment in Indonesia. American Economic Review, 113(2):514-547, 2023.
- [Brown et al., 2018] Caitlin Brown, Martin Ravallion, and Dominique van de Walle. A Poor Means Test? Econo- metric Targeting in Africa. Journal of Development Eco- nomics, 134:109-124, 2018.
- [Chen and Guestrin, 2016] Tianqi Chen and Carlos Guestrin. XGBoost: A Scalable Tree Boosting System. In Proceed- ings of the 22nd ACM SIGKDD International Conference on Knowledge Discovery and Data Mining, pages 785- 794, 2016.
- [Chen et al., 2021] Xinyang Chen, Sinan Wang, Jianmin Wang, and Mingsheng Long. Representation Subspace Distance for Domain Adaptation Regression. In Pro- ceedings of the 38th International Conference on Machine Learning, pages 1749-1759, 2021.
- [Dai et al., 2007] Wenyuan Dai, Qiang Yang, Gui-Rong Xue, and Yong Yu. Boosting for Transfer Learning. In Proceedings of the 24th International Conference on Ma- chine Learning, pages 193-200, 2007.
- [Daumé III and Marcu, 2006] Hal Daumé III and Daniel Marcu. Domain Adaptation for Statistical Classifiers. Journal of Artificial Intelligence Research, 26:101-126, 2006.
- [Daumé III, 2007] Hal Daumé III. Frustratingly Easy Do- main Adaptation. In Proceedings of the 45th Annual Meet- ing of the Association of Computational Linguistics, pages 256-263, 2007.
- [de Mathelin et al., 2021] Antoine de Mathelin, Guillaume Richard, Franc ¸ois Deheeger, Mathilde Mougeot, and Nicolas Vayatis. Adversarial Weighting for Domain Adap- tation in Regression. In Proceedings of the 2021 IEEE 33rd International Conference on Tools with Artificial In- telligence, pages 49-56, 2021.
- [de Mathelin et al., 2022] Antoine de Mathelin, Francois Deheeger, Mathilde Mougeot, and Nicolas Vayatis. Fast and Accurate Importance Weighting for Correcting Sam- ple Bias. In Danai Koutra, Claudia Plant, Manuel Gomez Rodriguez, Elena Baralis, and Francesco Bonchi, ed- itors, Machine Learning and Knowledge Discovery in Databases, pages 659-674. Springer, Cham, 2022.
- [Eaton and desJardins, 2009] Eric Eaton and Marie des- Jardins. Set-Based Boosting for Instance-Level Transfer. In Proceedings of the 2009 IEEE International Conference on Data Mining Workshops, pages 422-428, 2009.
- [Fernando et al., 2013] Basura Fernando, Amaury Habrard, Marc Sebban, and Tinne Tuytelaars. Unsupervised Visual Domain Adaptation Using Subspace Alignment. In Pro- ceedings of the 2013 IEEE International Conference on Computer Vision, pages 2960-2967, 2013.
- [Grosh and Baker, 1995] Margaret E. Grosh and Judy L. Baker. Proxy Means Tests for Targeting Social Programs: Simulations and Speculation. Technical report, LSMS Working Paper No. 118, The World Bank, Washington, DC, 1995.
- [Houssou et al., 2007] Nazaire Houssou, Manfred Zeller, Gabriela Alcaraz V., Stefan Schwarze, and Julia Jo- hannsen. Proxy Means Tests for Targeting the Poorest Households: Applications to Uganda. Presented at the 106th Seminar of the European Association of Agricul- tural Economists, Montpellier, Oct, 2007.
- [Johannsen, 2006] Julia Johannsen. Operational Poverty Tar- geting in Peru -Proxy Means Testing with Non-Income Indicators. Working Paper No. 30, UNDP International Policy Centre, Brasilia, 2006.
- [Kidd and Wylde, 2011] Stephen Kidd and Emily Wylde. Targeting the Poorest: An Assessment of the Proxy Means Test Methodology. Technical report, AusAID, 2011.
- [Littlestone and Warmuth, 1994] Nick Littlestone and Man- fred K. Warmuth. The Weighted Majority Algorithm. In- formation and Computation, 108(2):212-261, 1994.
- [Narayan and Yoshida, 2005] Ambar Narayan and Nobuo Yoshida. Proxy Means Tests for Targeting Welfare Ben- efits in Sri Lanka. Report No. SASPR-7, The World Bank, Washington, DC, 2005.
- [Pan et al., 2011] Sinno Jialin Pan, Ivor W. Tsang, James T. Kwok, and Qiang Yang. Domain Adaptation via Transfer Component Analysis. IEEE Transactions on Neural Net- works, 22(2):199-210, 2011.
- [Pardoe and Stone, 2010] David Pardoe and Peter Stone. Boosting for Regression Transfer. In Proceedings of the 27th International Conference on Machine Learning, pages 863-870, 2010.
- [Sharif, 2009] Iffath A. Sharif. Building a Targeting System for Bangladesh Based on Proxy Means Testing. SP Dis- cussion Paper No. 0914, The World Bank, Washington, DC, 2009.
- [Sumarto et al., 2007] Sudarno Sumarto, Daniel Suryadarma, and Asep Suryahadi. Predicting Con- sumption Poverty using Non-Consumption Indicators: Experiments using Indonesian Data. Social Indicators Research, 81(3):543-578, 2007.
- [Sun et al., 2016] Baochen Sun, Jiashi Feng, and Kate Saenko. Return of Frustratingly Easy Domain Adaptation. In Proceedings of the Thirtieth AAAI Conference on Arti- ficial Intelligence (AAAI'16), pages 2058-2065, 2016.
- [Wobcke and Mariyah, 2023] Wayne Wobcke and Siti Mariyah. Machine Learning and Data Augmentation in the Proxy Means Test for Poverty Targeting. Statistical Journal of the IAOS, 39(4):961-977, 2023.
- [Yao and Doretto, 2010] Yi Yao and Gianfranco Doretto. Boosting for Transfer Learning with Multiple Sources. In Proceedings of the 2010 IEEE Computer Society Confer- ence on Computer Vision and Pattern Recognition, pages 1855-1862, 2010.
References were extracted automatically from the PDF and may contain errors.
Full text extracted automatically from the PDF; figures, tables and equations may differ. The PDF is the version of record.
1 Introduction
The key assumption in supervised learning is that training and test sets are iid (independent and identically distributed) and derived from the same distribution. If the distribution of the test set does not match the distribution of the training set, a learned model will fail to generalize accurately. In practice, differences in distribution between training and test sets are often unavoidable due to sample selection bias, changing environment, privacy concerns, high labelling cost, etc. Domain adaptation [Daum´e III and Marcu, 2006], a type of transfer learning, addresses this problem by "borrowing" or "exploiting" a pre-existing dataset or adjusting a model trained in another similar task. Domain adaptation works by correcting the differences between an augmenting data set (the training set or source) and augmented data (the test set or target) with or without a small amount of the target set (the guide or training target). The performance of the model is then evaluated on the remainder of the target set (the testing target). In previous work, domain adaptation methods are designed to work for a single task, either classification or regression. In this paper, the task of the learner is to produce both an estimation and an ordinal class of instances that are consistent in that the classes are derived from the estimated values.
We analyse a real world application, the Proxy Means Test (PMT), a popular model-based poverty targeting method used in many countries for many years [Grosh and Baker, 1995; Kidd and Wylde, 2011]. The PMT aims to identify the "poor" groups within a population. A PMT model is developed using household data from a sample survey, then is used to estimate monthly per capita household expenditure (pcexp) for the whole population in the following year. Households are ranked based on estimated pcexp from the lowest to the highest and are also classified into two ordinal classes, eligible for benefits (poor) and ineligible (non-poor). A threshold, such as 40%, is used such that all households at or below the threshold are classified as eligible. In modelling the PMT, it is important that the ranking of households based on ordered estimated pcexp is consistent with the classification of a household as eligible or ineligible. That is, if one household is estimated to have a higher pcexp than another and the first household is classified as eligible, the second household must also be classified as eligible (a monotonicity property given that all eligible households have less expenditure than all ineligible households). Thus the eligible group must be exactly those estimated to be at or below the threshold by pcexp.
PMT models are commonly evaluated based on the accuracy of estimation using a metric such as RMSE, but more important is the evaluation of the classification into the eligible class [Brown et al., 2018]: inclusion error (IE) arises when an ineligible household is classified as eligible, and exclusion error (EE) arises when an eligible household is classified as ineligible. Given the problem of limited data [Wobcke and Mariyah, 2023] and the distribution shift while borrowing from previous datasets, in this work, we aim to reduce inclusion and exclusion error by developing a PMT model that takes into account distribution shift as well as jointly minimizing regression and ordinal classification errors. We develop an extension to the domain adaptation algorithm for regression utilizing the idea of boosting by modifying TrAdaBoost [Dai et al., 2007]. The idea of our method is to include ranking-related information in the weighting mechanism based on the estimation at every boosting iteration. We revise the criteria of usefulness of source domain instances in estimating the target instances so that not only estimation error but also ordinal classification error can be minimized simultaneously. We design our method, TrAdaBoost.JQL, to be applicable for any poverty targeting threshold by allowing the threshold to be set at any quantile cut-off, as a variety of cut-offs are used in practice and the cut-off directly affects the accuracy of the PMT [Narayan and Yoshida, 2005; Johannsen, 2006; Sumarto et al., 2007; Houssou et al., 2007; Sharif, 2009; Kidd and Wylde, 2011]. To demonstrate the generality of the approach, we evaluate our method over different eligibility thresholds using target datasets from a number of districts in Indonesia. We compare TrAdaBoost.JQL to existing domain adaptation methods, reweighting-based and invariant feature representation-based methods.
2 Background
There are at least two paradigms in domain adaptation, instance reweighting and invariant feature representation. The general idea of instance reweighting is to reweigh source instances (and the guide) with a positive weight with respect to a loss function to correct the differences between source and target domains. The invariant feature space approach aims to identify common features behaving similarly between source and target, and transform them into an invariant feature space.
In reweighting-based domain adaptation, one of the most well-known domain adaptation methods is boosting for transfer learning, TrAdaBoost [Dai et al., 2007]. This work showed how boosting can be used to select useful source instances and filter out source instances that are too different from target instances. TrAdaBoost requires a small amount of target instances (the guide) to measure how different the source instances are from the target set. However, TrAdaBoost is highly susceptible to overfitting [Pardoe and Stone, 2010]. When the number of boosting iterations increases, beyond some point the performance decreases.
Pardoe and Stone [2010] argued that when the source dataset is much larger than the guide, TrAdaBoost can take many iterations for the total weight of the target instances to approach the total weight of the source instances, and proposed Two-Stage TrAdaBoost. In the first stage, the instance weights are updated as in TrAdaBoost until reaching a certain point. In the second stage, the source instance weights are frozen but the guide instance weights are updated using the AdaBoost method. Al-Stouhi and Reddy [2011] and Eaton and desJardins [2009] pointed out that the source weights in TrAdaBoost converge rapidly. Al-Stouhi and Reddy [2011] proposed a correction factor so that the reweighting mechanism in TrAdaBoost follows the Weighted Majority Algorithm [Littlestone and Warmuth, 1994]; the method is called Dynamic TrAdaBoost.
Besides boosting techniques, deep learning has shown promising results in some domain adaptation settings. De Mathelin et al. proposed two methods for reweighting-based domain adaptation with a deep learning neural network: Weighting Adversarial Neural Network (WANN) [de Mathelin et al., 2021] and Importance Weighting Network (IWN)
[de Mathelin et al., 2022]. WANN includes three networks, a weighting network to learn the source weights, a task network to learn the task, and a discrepancy network to estimate the distance between the reweighted source and target distributions, while IWN consists of a reweighting network to parameterize the weights of the source instances that minimize the maximum mean discrepancy (MMD) between source and target distributions.
Different from instance reweighting that utilizes a set of positive weights calculated from the loss, feature-based domain adaptation searches for invariant representations that are shared for both source and target domains. Transfer Component Analysis (TCA) [Pan et al., 2011] reduces the distance between domains by constructing a reduced feature representation in reproducing kernel Hilbert space using MMD. Similar to TCA, Subspace Alignment (SA) [Fernando et al., 2013] constructs subspaces from the most informative eigenvectors for the source and target domains to minimize the Frobenius norm of these two subspaces. Alignment of feature representation is also used by Sun et al. [2016]. Inspired by [Daum´e III, 2007], they proposed Correlation Alignment (CORAL), which minimizes the distribution differences by aligning the second order statistics of source and target distributions.
3 Joint Quantile Loss Boosted Guided Domain Adaptation
Boosting has been utilized in domain adaptation methods and implemented in different ways. In TrAdaBoost (Algorithm 1), data instances are weighted based on their distribution or a specified distribution and sent to a base learner along with some initial weights. The goal is to selectively choose "useful" instances from the source set given the data distributions differ by adjusting the weight of each instance in both source and target domains. In each iteration, TrAdaBoost reduces the weights of source set instances with high error and increases the weights of instances with low error relative to all data. In contrast, if instances are from the same distribution (the target set), the weights of instances having high error are increased and those of instances having low error are reduced.
We present an extension of TrAdaBoost, TrAdaBoost.JQL, designed to jointly minimize regression and ordinal classification (quantile) errors simultaneously where the base learner works in a regression setting, and which considers joint regression and quantile classification errors in updating the weights. TrAdaBoost.JQL requires the data to be divided into quantiles ordered by the target variable (as distinct from quantile regression which produces a model to identify a specific quantile). A poverty targeting model can be developed using any threshold and the quantile loss can be defined using any quantiles; the experiments in this paper use thresholds of 20%, 40% and 60%, and the quantile loss is based on five quantiles (i.e. quintiles). We define a parameter λ ∈ [0, 1] to control the trade-off between estimation and ordinal classification errors (see Definition 2). Considering that different datasets and domains might have different characteristics, λ could be a tunable hyperparameter of the method, however all experiments in this paper use the same fixed value of λ.
Algorithm 1 TrAdaBoost.JQL for Regression
Input:
- Two labelled data sets, the source Ds of size n and the guide (training target) Dg of size m. Let D be the combination of Ds and Dg such that the first n instances in D are those fromDs.
- A base learning algorithm, a regressor
- The maximum number of iterations N
- 1: The initial weight vector w1 = (w1s ,w1g ) where w1s = (w1 1 , ...,w1n ) and w1g = (w1n+1 , ...,w1n+m). The initial values are specified by the user.
- 2: for t = 1, ...,N do
- 3: Set the vector pt = wt /(∑n+m i=1 wt i )
- 4: Call regressor, providing it with D and the distribution pt over D, which returns an estimator ht
- 5: Calculate loss vector et using Definitions 1 and 2
- 6: Calculate estimator error of ht on Dg:
- 7: Set βt = εt /(2- εt ) and β = 1/(1+ √2 lnn/N)
- 8: Update the weight vector:
- 9: Calculate estimator weight ωt = -ln(εt /(2- εt ))
- 10: end for
Output: Hypothesis hf(x) = the weighted median of ht (x) for N/2 ≤ t ≤ N with ωt as the weight for estimator ht
Definition 1. For a dataset D, each instance xi in D is associated with a true value yi and estimated value h(xi) for a given learner h. The regression error vector eR and normalized regression error vector ˜eR are defined as
Definition 2. Using the notation of Definition 1, suppose the instances xi are assigned a quantile ranking yiQ and estimated value ˆ yiQ with Q quantiles from 1 to Q. Then the quantile ranking error vector eQ and normalized quantile ranking error vector ˜eQ are defined as
The joint quantile loss vector eJQL is defined as
where λ ∈ [0, 1] is a fixed parameter.
Our method utilizes boosting in transferring patterns of instances from the source data by giving "richer" information on which instances lead to maximal reduction in joint loss. The guide is used to help in measuring the magnitude of the difference between the source and the target sets. The source instances with high joint error are weighted lower while the guide instances with high joint error are weighted higher in the next iteration, repeatedly until the final iteration is reached. In our method, two instances with the same regression error can be reweighted differently. If one instance is ranked into the correct group and another instance is ranked into the wrong group, then the weight of the first instance becomes higher than the weight of the second instance even though both of them come from the source set. In previous methods, these two instances are reweighted the same.
The main idea of our method is to give the base learner more information about which instances maximally reduce the estimation and ranking error, both through the loss function and by choosing the guide instances uniformly from the true quantiles of the target set. The ordinal classification error indicates the instances whose estimations should be improved to move all instances into the correct classes, which in turn improves estimation. Our observations show that information about ordinal classification loss allows instances in the source set to have reasonably high weights, thus be considered "useful" instances for constructing the target function. This is because the instance's group is derived from the ranking in each corresponding year's data, where each instance, especially in the top quantiles, is more likely to be classified in the correct group. TrAdaBoost.JQL reduces the effect of regression error, thus an instance with a reasonable regression error but grouped in the correct class still may be weighted slightly higher than just considering the estimation error. In the next iteration, a base learner pays "attention" to this kind of instance so that their estimations improve as the number of iterations increases. This reweighting mechanism results in more source instances being up-weighted than in TrAdaBoost, so more instances are deemed useful for estimation of the target set instances, resulting in improved accuracy.
4 Experimental Design
4.1 Datasets
The datasets are from Indonesia's National Socioeconomic Survey, known as SUSENAS, which is performed twice a year with different sample sizes depending on the required estimation level. SUSENAS variables used in PMT modelling comprise demographic variables such as the number of toddlers, adults and elderly in the household, marital status and educational attainment; employment variables such as number of household members working in the agriculture, industry and service sectors and labour status for each household member in each workforce category; house condition consisting of floor space, type of roof, wall and floor materials, type of sanitation and source of drinking water; asset ownership variables comprising ownership status of house, television, fridge, water heater, boat, motorbike, car and jewellery; and target variable monthly total consumption expenditure. Per capita household expenditure is derived from the monthly total of food and non-food consumption expenditure divided by the number of household members. There are a total of 60 features with low variance among households in each district.
4.2 Methodology
We use five years data (2016-2020) from a variety of districts in Indonesia and treat each year's data independently to expand the scenario of experiments. Each year's data acts as a single domain, thus we have data for five domains for every district. In practice, the most current data is always the test set (target set) and the earlier years' data are the training set (the source set). In general, any year's data can be the target set and the other years the source set. As each year's data is treated independently, the quantile ranking (quantile class) of households is defined separately based on the household expenditure in each given year. Each method performs domain adaptation on a regression task where the natural log of per capita household expenditure pcexp is the dependent (target) variable, which is standard practice for this problem because household expenditure is known to have a log-normal distribution.
There is obvious, though not easily predictable, concept drift in the target variable pcexp over different years. To show that our method is robust to this concept drift, we give results for two target sets, 2016 and 2020 data. We discuss four scenarios: (i) using 2020 data as the target set with a 10% guide; (ii) using 2020 data as the target set with a 5% guide; (iii) using 2016 data as the target set with a 10% guide; and (iv) using 2016 data as the target set with a 5% guide. In each scenario, we compare our method to one baseline and seven other domain adaptation methods, both reweighting-based and invariant feature representation-based methods: (1) XGBoost with the guide included in the training set as the baseline; reweighting-based domain adaptation methods (2) TrAdaBoost.R2 [Dai et al., 2007], (3) TwoStage TrAdaBoost.R2 [Pardoe and Stone, 2010], (4) Dynamic TrAdaBoost.R2 [Al-Stouhi and Reddy, 2011], (5) Weighting Adversarial Neural Network (WANN) [de Mathelin et al., 2021], and (6) Importance Weighting Network (IWN) [de Mathelin et al., 2022]; and invariant feature representationbased domain adaptation methods (7) Subspace Alignment (SA) [Fernando et al., 2013] and (8) Correlation Alignment (CORAL) [Sun et al., 2016].
All domain adaptation methods requiring a base learner use XGBoost with the same hyperparameters. XGBoost is a realistic baseline, and is generally superior to Support Vector Regression (SVR) used as a baseline [Dai et al., 2007] and AdaBoost used as a baseline [Dai et al., 2007; Yao and Doretto, 2010]. The baseline learner, XGBoost [Chen and Guestrin, 2016] regressor, has hyperparameters set as follows: (i) column sampling by tree 0.3, (ii) learning rate 0.01, (iii) maximum depth 5, (iv) number of estimators 700, and (v) regularization lambda 0.01. These hyperparameters are determined from grid search results using a 70/30 training/validation split on source instances over several districts. The same hyperparameters are used for baseline learners in all methods to isolate the effect of domain adaptation.
In all scenarios, we use a fixed λ of 0.5 for TrAdaBoost.JQL, chosen after initial data analysis to give a reasonable balance between regression and classification loss. Clearly λ could also be a hyperparameter for the method and chosen differently for different thresholds and districts. However, we have found that λ = 0.5 gives consistent results.
5 Results and Discussion
5.1 RMSE Reductions
Tables 1 and 2 show the RMSE of the baseline XGBoost with guide included in the training set for a fair comparison, seven other domain adaptation methods, and our method TrAdaBoost.JQL, with guide sizes of 10% and 5% of the target set respectively. We test all methods in 12 rural districts (districts 1-12) and four urban districts (districts 13-16) in Indonesia. TrAdaBoost.JQL consistently outperforms all other methods, especially when the target set is 2020 data, although sometimes the estimation of pcexp for 2016 is better with TrAdaBoost. The reductions in RMSE with guide size 10% can reach up to 6% (rural district 6) and 22% (urban district 14) for target set 2016 and up to 21% (rural district 7) and 13% (urban district 13) for target set 2020. With a guide size of 5%, TrAdaBoost.JQL reduces RMSE by up to 6% (rural district 6) and 19% (urban district 14) in estimating 2016 data and by up to 21% (rural district 7) and 13% (urban district 13) in estimating 2020 data.
Dynamic TrAdaBoost, that applies a correction factor to TrAdaBoost, performs similarly to Two-Stage TrAdaBoost. Both methods are worse than TrAdaBoost but frequently better than the baseline XGBoost. Our observation is that TrAdaBoost, Dynamic and Two-Stage TrAdaBoost, which do not utilize the joint loss in the reweighting process, have fewer source instances that are deemed "useful" for constructing the target function compared to the number of source instances utilized in TrAdaBoost.JQL. Two-Stage TrAdaBoost relies too much on instances in the guide (as weights change more in stage two), thus performs worse when the guide is too small.
In general, the weighting-based domain adaptation methods with boosting, TrAdaBoost, Two-Stage TrAdaBoost, Dynamic TrAdaBoost and our method TrAdaBoost.JQL, perform much better than weighting-based domain adaptation methods with neural networks, IWN and WANN, and invariant feature representation-based domain adaptation methods, CORAL and SA. Before explaining this, note that WANN sometimes has very high errors and the results show inconsistencies between the different scenarios (e.g. district 10). This is because there are outliers in the training sets with 2016 target sets and in the test sets with 2020 target sets. However, even after removing these outliers, the reductions in RMSE are not as high as for other methods, which are better able to handle outliers automatically. Overall, the results show that CORAL, SA, IWN and WANN have RMSE higher than the baseline XGBoost. We believe that this is due to the following reasons. First, the typical datasets used with these methods are much larger, often image or text datasets, whereas our datasets are comparatively small and use a variety of numerical and categorical features. Second, these methods are designed to work with high dimensional data with many informative features, however our datasets consist of many categorical features and more importantly, many features that are not informative for estimating the target variable. These methods correct the difference between source and target domains by constructing invariant feature representations (CORAL and SA) or by minimizing the discrepancy (IWN and WANN) using different feature sets. Invariant feature-based domain adaptation performs feature scaling, however Chen et al. [2021] showed that regression performance is not robust to feature scaling. Third, the neural network models exploit a pretrained model for image and text classification, however our task does not readily admit the use of a pretrained model.
| District | 1 | 2 | 3 | 4 | 5 | 6 | 7 | 8 | 9 | 10 | 11 | 12 | 13 | 14 | 15 | 16 |
|---|---|---|---|---|---|---|---|---|---|---|---|---|---|---|---|---|
| Target Set 2016 | ||||||||||||||||
| XGBoost | 506 | 518 | 706 | 486 | 509 | 685 | 599 | 433 | 390 | 583 | 340 | 618 | 644 | 902 | 850 | 500 |
| TrAdaBoost | 496 | 510 | 824 | 483 | 503 | 652 | 600 | 430 | 385 | 568 | 323 | 602 | 608 | 704 | 830 | 473 |
| Two-Stage | 483 | 530 | 818 | 497 | 509 | 663 | 595 | 435 | 395 | 583 | 327 | 606 | 609 | 713 | 842 | 472 |
| Dynamic | 485 | 524 | 810 | 482 | 502 | 671 | 588 | 432 | 382 | 575 | 334 | 603 | 628 | 819 | 838 | 480 |
| CORAL | 619 | 584 | 871 | 617 | 611 | 783 | 737 | 494 | 468 | 664 | 397 | 712 | 777 | 987 | 922 | 853 |
| SA | 523 | 549 | 861 | 515 | 516 | 734 | 652 | 452 | 425 | 596 | 368 | 670 | 701 | 938 | 875 | 539 |
| IWN | 519 | 557 | 844 | 501 | 507 | 707 | 626 | 446 | 401 | 593 | 342 | 655 | 683 | 963 | 868 | 556 |
| WANN | 722 | 545 | 906 | 514 | 603 | 789 | 785 | 681 | 415 | 3046 | 444 | 920 | 1030 | 1148 | 1062 | 607 |
| TrAdaBoost.JQL | 478 | 506 | 800 | 467 | 501 | 643 | 566 | 409 | 381 | 564 | 329 | 585 | 607 | 705 | 830 | 460 |
| Target Set 2020 | ||||||||||||||||
| XGBoost | 803 | 780 | 1383 | 775 | 915 | 725 | 897 | 675 | 798 | 613 | 749 | 860 | 1209 | 1675 | 1521 | 752 |
| TrAdaBoost | 756 | 761 | 1438 | 760 | 917 | 700 | 734 | 651 | 778 | 609 | 707 | 828 | 1108 | 1644 | 1508 | 736 |
| Two-Stage | 780 | 788 | 1435 | 770 | 928 | 717 | 779 | 664 | 794 | 628 | 717 | 840 | 1189 | 1670 | 1531 | 769 |
| Dynamic | 783 | 782 | 1390 | 764 | 921 | 725 | 870 | 673 | 798 | 612 | 755 | 845 | 1163 | 1687 | 1538 | 763 |
| CORAL | 894 | 795 | 1522 | 852 | 1097 | 749 | 1386 | 727 | 840 | 746 | 740 | 926 | 1328 | 1903 | 1632 | 789 |
| SA | 886 | 829 | 1493 | 842 | 978 | 793 | 1349 | 699 | 864 | 673 | 817 | 945 | 1336 | 1762 | 1630 | 816 |
| IWN | 850 | 791 | 1364 | 786 | 928 | 736 | 1236 | 692 | 814 | 615 | 769 | 896 | 1239 | 1702 | 1558 | 773 |
| WANN | 1033 | 1274 | 1476 | 1782 | 896 | 946 | 1372 | 1017 | 995 | 947 | 836 | 967 | 1092 | 1899 | 1841 | 846 |
| TrAdaBoost.JQL | 728 | 726 | 1356 | 742 | 877 | 671 | 707 | 628 | 759 | 590 | 688 | 804 | 1050 | 1567 | 1442 | 687 |
| District | 1 | 2 | 3 | 4 | 5 | 6 | 7 | 8 | 9 | 10 | 11 | 12 | 13 | 14 | 15 | 16 |
|---|---|---|---|---|---|---|---|---|---|---|---|---|---|---|---|---|
| Target Set 2016 | ||||||||||||||||
| XGBoost | 504 | 521 | 705 | 488 | 514 | 688 | 603 | 437 | 391 | 585 | 343 | 625 | 653 | 910 | 856 | 503 |
| TrAdaBoost | 495 | 521 | 820 | 485 | 499 | 661 | 594 | 439 | 385 | 568 | 339 | 617 | 628 | 720 | 836 | 482 |
| Two-Stage | 507 | 553 | 846 | 497 | 518 | 674 | 633 | 455 | 393 | 573 | 359 | 635 | 686 | 735 | 872 | 521 |
| Dynamic | 487 | 526 | 815 | 483 | 504 | 677 | 591 | 439 | 389 | 576 | 341 | 617 | 631 | 823 | 839 | 484 |
| CORAL | 679 | 632 | 902 | 592 | 573 | 795 | 740 | 546 | 519 | 720 | 436 | 822 | 857 | 989 | 934 | 737 |
| SA | 529 | 562 | 822 | 507 | 521 | 721 | 621 | 465 | 418 | 601 | 373 | 646 | 703 | 944 | 861 | 543 |
| IWN | 518 | 560 | 848 | 502 | 504 | 708 | 632 | 447 | 405 | 589 | 343 | 656 | 681 | 968 | 869 | 557 |
| WANN | 692 | 2180 | 874 | 724 | 740 | 890 | 775 | 646 | 522 | 1026 | 431 | 1014 | 875 | 2179 | 1370 | 695 |
| TrAdaBoost.JQL | 481 | 519 | 780 | 480 | 506 | 648 | 581 | 422 | 385 | 570 | 346 | 595 | 633 | 733 | 853 | 460 |
| Target Set 2020 | ||||||||||||||||
| XGBoost | 807 | 781 | 1377 | 781 | 917 | 727 | 902 | 678 | 801 | 614 | 757 | 867 | 1218 | 1683 | 1525 | 759 |
| TrAdaBoost | 767 | 778 | 1418 | 776 | 929 | 699 | 756 | 662 | 784 | 597 | 750 | 848 | 1119 | 1675 | 1528 | 749 |
| Two-Stage | 786 | 803 | 1437 | 788 | 961 | 717 | 775 | 667 | 796 | 608 | 749 | 861 | 1189 | 1678 | 1583 | 761 |
| Dynamic | 778 | 779 | 1395 | 769 | 921 | 718 | 861 | 673 | 796 | 603 | 758 | 852 | 1150 | 1689 | 1526 | 755 |
| CORAL | 899 | 849 | 1539 | 856 | 1080 | 758 | 1380 | 726 | 871 | 690 | 783 | 897 | 1455 | 1989 | 1645 | 769 |
| SA | 894 | 842 | 1525 | 873 | 970 | 760 | 1329 | 716 | 876 | 669 | 818 | 935 | 1266 | 1785 | 1601 | 823 |
| IWN | 854 | 792 | 1374 | 787 | 930 | 735 | 1229 | 692 | 814 | 616 | 769 | 894 | 1246 | 1700 | 1553 | 775 |
| WANN | 998 | 766 | 1632 | 923 | 1381 | 1068 | 1527 | 901 | 1040 | 955 | 934 | 1419 | 1755 | 1965 | 3142 | 709 |
| TrAdaBoost.JQL | 733 | 736 | 1331 | 747 | 874 | 670 | 717 | 629 | 759 | 583 | 715 | 820 | 1061 | 1584 | 1448 | 699 |
5.2 IE/EE Reductions
Inclusion and exclusion errors (IE and EE) represent the ordinal classification loss which is the main evaluation metric used for evaluating the Proxy Means Test. Note that where the prediction problem is to identify an eligibility set defined as a fixed proportion of households at or below a given threshold of pcexp, IE and EE are the same, because for every household incorrectly included in the eligibility class, there is one other household excluded from the eligibility class that should be included, and vice versa (assuming the model predicts an eligibility set of exactly the right size, which in turn requires that the total number of households is known).
Figures 1, 2 and 3 show comparisons of IE/EE for all methods at 20%, 40% and 60% eligibility thresholds in four different scenarios for the 16 districts (2020 and 2016 data as target set, 10% and 5% guide size). In general, the tighter (smaller) the eligibility threshold, the higher the IE/EE. The IE/EE of the baseline XGBoost is shown by red dots while the IE/EE of TrAdaBoost.JQL is shown by light green dots connected by green lines. The lower the position of a point, the better the performance of a method. In terms of district, for all of the eligibility thresholds, urban districts generally have lower IE/EE than rural districts regardless of the target set and the guide size. Figures 1, 2 and 3 show that TrAdaBoost.JQL frequently results in the lowest IE/EE among the baseline XGBoost and the other domain adaptation methods. The IE/EE of other domain adaptation methods have a similar pattern to RMSE where WANN, IWN, SA and CORAL have IE/EE higher than the baseline XGBoost. Methods using reweighting-based domain adaptatation with boosting result in small reductions in IE/EE. At eligibility thresholds of 20%, 40% and 60%, on average across districts, TrAdaBoost reduces IE/EE by up to 2%, 3% and 3%, Dynamic TrAdaBoost reduces IE/EE by up to 0.2%, 0.7% and 1.3%, while Two-Stage TrAdaBoost does not reduce IE/EE.
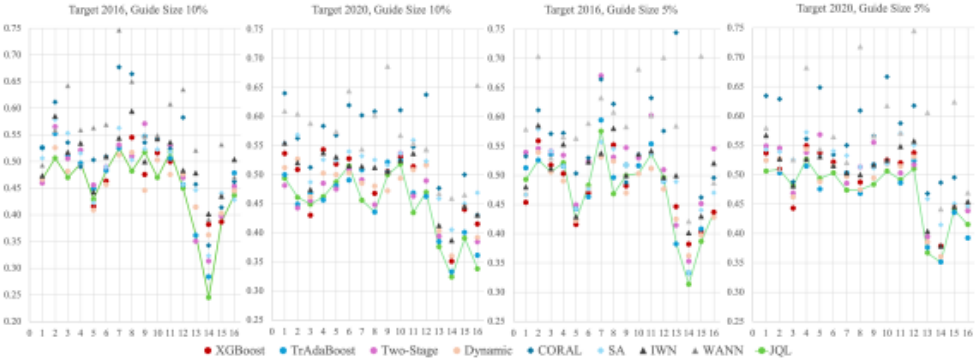
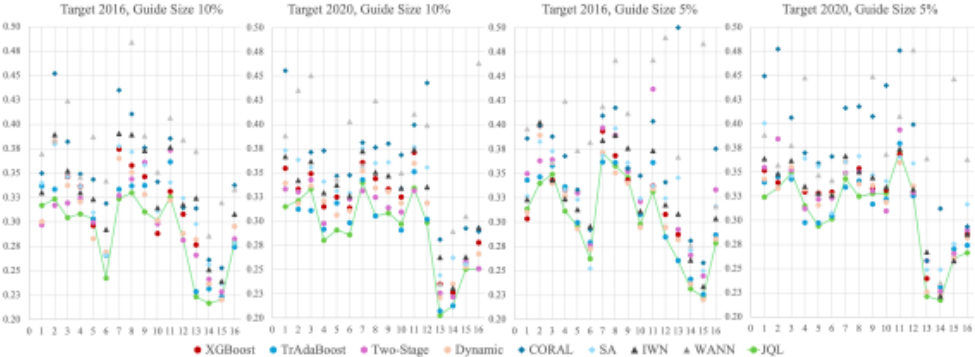
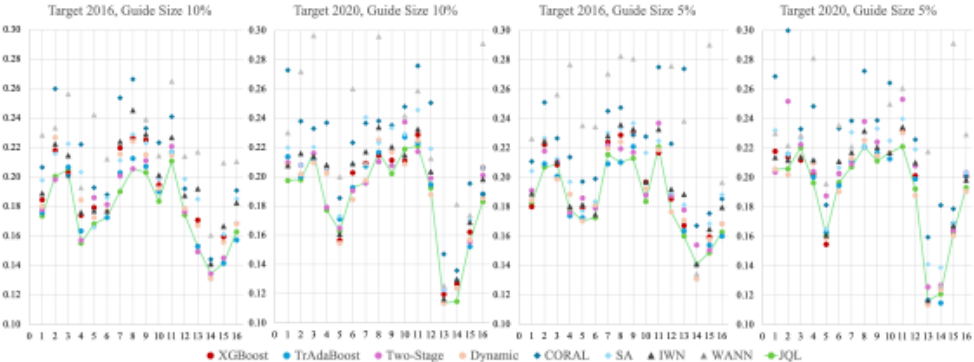
Compared to XGBoost (with guide included in the training set), our method TrAdaBoost.JQL reduces IE/EE at threshold 20% by up to 36% (target 2016) and 19% (target 2020); at threshold 40% by up to 19% (target 2016) and 14% (target 2020), and at threshold 60% by up to 13% (target 2016) and 14% (target 2020). IE/EE reductions for TrAdaBoost.JQL exhibit the pattern that IE/EE reductions at a tight (smaller) eligibility threshold are higher than IE/EE reductions for a loose (higher) threshold. This is highly beneficial because a tight eligibility threshold is frequently used in many poverty targeting programs such as Indonesia's Subsidized Rice Program (known as Raskin) targeting the poorest 30% [Banerjee et al., 2018], Indonesia's Conditional Cash Transfer program (known as PKH) targeting the poorest 5-10% [Alatas et al., 2016], and Indonesia's Non-Cash Food Assistance targeting the poorest 25% [Banerjee et al., 2023].
5.3 Sensitivity Analysis
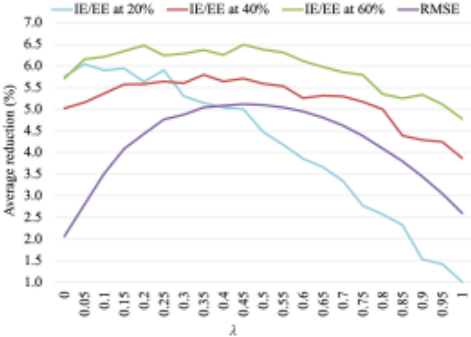
We show the average reduction in errors across different values of λ in Definition 2, ranging from 0, meaning that TrAdaBoost.JQL only considers ordinal classification loss, to 1, meaning that TrAdaBoost.JQL only considers regression loss, across 95 districts in three large provinces in Indonesia with two target sets. Figure 4 shows the average percentage reduction in RMSE and IE/EE for the different eligibility thresholds, 20%, 40% and 60%, for TrAdaBoost.JQL compared to XGBoost with the guide included in the training set, as λ varies from 0 to 1 in steps of 0.05. The average reduction in RMSE varies smoothly, as expected, with values of λ between 0.35 and 0.55 giving similar reductions. Good reductions in IE/EE for the 40% and 60% thresholds are achieved with values of λ at or below 0.5, which is consistent with our preliminary observations (a λ of 0.45 gives slightly better average reductions than a value of 0.5). Reductions in IE/EE at the eligibility threshold of 20% are more sensitive to λ compared to the reductions in IE/EE at thresholds of 40% and 60%, as expected, which suggests that our results could be improved in this setting with a smaller value of λ, perhaps around 0.25. Finally, note that while every value of λ results in reductions in both RMSE and IE/EE compared to the XGBoost baseline, the magnitude of the reductions could be further optimized by choosing a value for λ based on (i) whether RMSE or IE/EE is prioritized, (ii) the eligibility threshold, and (iii) the district where the method is applied.
6 Conclusion
We presented a domain adaptation method, TrAdaBoost.JQL (Transfer AdaBoost with Joint Quantile Loss), that extends TrAdaBoost to jointly minimize estimation and ordinal classification errors. We applied our method to the practical problem of the Proxy Means Test (PMT) for poverty targeting over different target sets and guide sizes across a variety of rural and urban districts in Indonesia. TrAdaBoost.JQL improves the existing approaches to the PMT for poverty targeting by addressing the problems of limited data and distribution shift in household survey data and in the target variable of per capita household expenditure (pcexp).
We evaluated TrAdaBoost.JQL with different guide sizes and target sets over different eligibility thresholds (20%, 40% and 60%) across 16 districts in Indonesia. We empirically showed that TrAdaBoost.JQL can jointly minimize regression and ordinal classification errors even with very small amounts of labelled target instances, i.e. guide sizes of 10% and 5%, equal to 2.5% and 1.25% of the source size respectively, which is important for the practicality of the approach. TrAdaBoost.JQL gives reductions in estimation error (RMSE) of up to 22% and ordinal classification loss (inclusion/exclusion error) of up to 36% compared to an XGBoost baseline that includes the guide in the training data.
The intended application scenario is that TrAdaBoost.JQL is used to estimate pcexp in the following year (2020 in our data), using data from previous years (2016-2019 in our data). We demonstrated the generality of the approach by using 2016 data as the target set and 2017-2020 as the source dataset. Considering that the PMT can be used for targeting for a variety of programs with different eligibility thresholds, we also provided a mechanism to allow a parameter λ, representing the weight applied to estimation error as opposed to quantile classification error, to be varied to suit the scenario. Empirically, we showed that a lower value of λ suits a tight eligibility threshold such as 20%, while a value of λ around 0.5 suits loose eligibility thresholds such as 40% and 60%.
Acknowledgements
This research was supported by the Australian Government through the Australian Research Council's Discovery Projects funding scheme (project DP180100903). Thanks to BPS (Badan Pusat Statistik - Statistics Indonesia) for providing SUSENAS survey data and for numerous discussions, and Politeknik Statistika STIS for hosting a seminar on the topic of this paper.
@inproceedings{ijcai2024p819,
  title     = {Domain Adaptation with Joint Loss for Consistent Regression and Ordinal Classification in the Proxy Means Test for Poverty Targeting},
  author    = {Mariyah, Siti and Wobcke, Wayne},
  booktitle = {Proceedings of the Thirty-Third International Joint Conference on
               Artificial Intelligence, {IJCAI-24}},
  publisher = {International Joint Conferences on Artificial Intelligence Organization},
  editor    = {Kate Larson},
  pages     = {7403--7411},
  year      = {2024},
  month     = {8},
  note      = {AI for Good},
  doi       = {10.24963/ijcai.2024/819},
  url       = {https://doi.org/10.24963/ijcai.2024/819},
}
TY - CPAPER TI - Domain Adaptation with Joint Loss for Consistent Regression and Ordinal Classification in the Proxy Means Test for Poverty Targeting AU - Mariyah, Siti AU - Wobcke, Wayne T2 - Proceedings of the Thirty-Third International Joint Conference on Artificial Intelligence, IJCAI-24 PB - International Joint Conferences on Artificial Intelligence Organization PY - 2024 SP - 7403 EP - 7411 DO - 10.24963/ijcai.2024/819 UR - https://doi.org/10.24963/ijcai.2024/819 ER -Copied
Machine-readable versions of this paper, for tools and AI agents:





