
ADESSE: Advice Explanations in Complex Repeated Decision-Making Environments
Proceedings of the Thirty-Third International Joint Conference on Artificial Intelligence. Human-Centred AI. Pages 7904-7912.
https://doi.org/10.24963/ijcai.2024/875
Keywords
- Humans and AI: HAI: Human-AI collaboration
- Machine Learning: ML: Reinforcement learning
- Machine Learning: ML: Explainable/Interpretable machine learning
- AI Ethics, Trust, Fairness: ETF: Explainability and interpretability
Abstract
In the evolving landscape of human-centered AI, fostering a synergistic relationship between humans and AI agents in decision-making processes stands as a paramount challenge. This work considers a problem setup where an intelligent agent comprising a neural network-based prediction component and a deep reinforcement learning component provides advice to a human decision-maker in complex repeated decision-making environments. Whether the human decision-maker would follow the agent's advice depends on their beliefs and trust in the agent and on their understanding of the advice itself. To this end, we developed an approach named ADESSE to generate explanations about the adviser agent to improve human trust and decision-making. Computational experiments on a range of environments with varying model sizes demonstrate the applicability and scalability of ADESSE. Furthermore, an interactive game-based user study shows that participants were significantly more satisfied, achieved a higher reward in the game, and took less time to select an action when presented with explanations generated by ADESSE. These findings illuminate the critical role of tailored, human-centered explanations in AI-assisted decision-making.
- [Adadi and Berrada, 2018] Amina Adadi and Mohammed Berrada. Peeking inside the black-box: a survey on explainable artificial intelligence (xai). IEEE access, 6:52138-52160, 2018.
- [Alshehri et al., 2023] Abeer Alshehri, Tim Miller, and Mor Vered. Explainable goal recognition: a framework based on weight of evidence. In Proceedings of the Thirty- Third International Conference on Automated Planning and Scheduling, ICAPS '23. AAAI Press, 2023.
- [Amir and Amir, 2018] Dan Amir and Ofra Amir. High- lights: Summarizing agent behavior to people. In Proceed- ings of the 17th International Conference on Autonomous Agents and MultiAgent Systems, pages 1168-1176, 2018.
- [Anjomshoae et al., 2019] Sule Anjomshoae, Amro Najjar, Davide Calvaresi, and Kary Främling. Explainable agents and robots: Results from a systematic literature review. In 18th International Conference on Autonomous Agents and Multiagent Systems (AAMAS 2019), Montreal, Canada, May 13-17, 2019, pages 1078-1088. International Foun- dation for Autonomous Agents and Multiagent Systems, 2019.
- [Boggess et al., 2022] Kayla Boggess, Sarit Kraus, and Lu Feng. Toward policy explanations for multi-agent rein- forcement learning. In International Joint Conference on Artificial Intelligence (IJCAI), 2022. IJCAI
- [Boggess et al., 2023] Kayla Boggess, Sarit Kraus, and Lu Feng. Explainable multi-agent reinforcement learn- ing for temporal queries. In Proceedings of the Thirty- Second International Joint Conference on Artificial Intel- ligence (IJCAI), 2023. IJCAI
- [Chakraborti et al., 2020] Tathagata Chakraborti, Sarath Sreedharan, and Subbarao Kambhampati. The emerging landscape of explainable automated planning & decision making. In IJCAI, pages 4803-4811, 2020. IJCAI
- [Emerson et al., 2023] Harry Emerson, Matthew Guy, and Ryan McConville. Offline reinforcement learning for safer blood glucose control in people with type 1 diabetes. Jour- nal of Biomedical Informatics, 142:104376, 2023.
- [Farazi et al., 2021] Nahid Parvez Farazi, Bo Zou, Tanvir Ahamed, and Limon Barua. Deep reinforcement learn- ing in transportation research: A review. Transportation research interdisciplinary perspectives, 11:100425, 2021.
- [Finkelstein et al., 2022] Mira Finkelstein, Lucy Liu, Yoav Kolumbus, David C Parkes, Jeffrey Rosenschein, Sarah Keren, et al. Explainable reinforcement learning via model transforms. In Advances in Neural Information Processing Systems, 2022. Guidotti et al., 2018]
- Riccardo Guidotti, Anna Monreale, Salvatore Ruggieri, Franco Turini, Fosca Giannotti, and Dino Pedreschi. A survey of methods for explaining black box models. ACM computing surveys (CSUR), 51(5):1-42, 2018.
- [Haksar and Schwager, 2018] Ravi N. Haksar and Mac Schwager. Distributed deep reinforcement learning for fighting forest fires with a network of aerial robots. In 2018 IEEE/RSJ International Conference on Intelligent Robots and Systems (IROS), pages 1067-1074. IEEE, 2018.
- [Heuillet et al., 2021] Alexandre Heuillet, Fabien Couthouis, and Natalia Díaz-Rodríguez. Explain- ability in deep reinforcement learning. Knowledge-Based Systems, 214:106685, 2021.
- [Hoffman et al., 2018] Robert R. Hoffman, Shane T. Mueller, Gary Klein, and Jordan Litman. Metrics for explainable ai: Challenges and prospects. arXiv preprint arXiv:1812.04608, 2018.
- [Huber et al., 2021] Tobias Huber, Katharina Weitz, Elisa- beth André, and Ofra Amir. Local and global explana- tions of agent behavior: Integrating strategy summaries with saliency maps. Artificial Intelligence, 301:103571, 2021.
- [Julian and Kochenderfer, 2019] Kyle D. Julian and Mykel J. Kochenderfer. Distributed wildfire surveillance with autonomous aircraft using deep reinforcement learning. Journal of Guidance, Control, and Dynamics, 42(8):1768- 1778, 2019.
- [Kamga et al., 2015] Camille Kamga, M. Anil Yazici, and Abhishek Singhal. Analysis of taxi demand and supply in new york city: implications of recent taxi regulations. Transportation Planning and Technology, 38(6):601-625, 2015.
- [Kraus et al., 2020] Sarit Kraus, Amos Azaria, Jelena Fiosina, Maike Greve, Noam Hazon, Lutz Kolbe, Tim- Benjamin Lembcke, Jörg P. Müller, Sören Schleibaum, and Mark Vollrath. Ai for explaining decisions in multi- agent environments. In Proceedings of the AAAI Confer- ence on Artificial Intelligence, volume 34, pages 13534- 13538, 2020.
- [Lundberg and Lee, 2017] Scott M. Lundberg and Su-In Lee. A unified approach to interpreting model predictions. Advances in neural information processing systems, 30, 2017.
- [Meijer and Wessels, 2019] Albert Meijer and Martijn Wes- sels. Predictive policing: Review of benefits and draw- backs. International Journal of Public Administration, 42(12):1031-1039, 2019.
- [Naiseh et al., 2020] Mohammad Naiseh, Nan Jiang, Jian- bing Ma, and Raian Ali. Explainable recommenda- tions in intelligent systems: delivery methods, modali- ties and risks. In Research Challenges in Information Science: 14th International Conference, RCIS 2020, Li- massol, Cyprus, September 23-25, 2020, Proceedings 14, pages 212-228. Springer, 2020.
- [Puiutta and Veith, 2020] Erika Puiutta and Eric Veith. Ex- plainable reinforcement learning: A survey. In Interna- tional cross-domain conference for machine learning and knowledge extraction, pages 77-95. Springer, 2020.
- [Ribeiro et al., 2016] Marco Tulio Ribeiro, Sameer Singh, and Carlos Guestrin. "why should i trust you?" explain- ing the predictions of any classifier. In Proceedings of the 22nd ACM SIGKDD international conference on knowl- edge discovery and data mining, pages 1135-1144, New York, NY, USA, 2016. Association for Computing Ma- chinery.
- [Saeed and Omlin, 2023] Waddah Saeed and Christian Om- lin. Explainable ai (xai): A systematic meta-survey of current challenges and future opportunities. Knowledge- Based Systems, 263:110273, 2023.
- [Schleibaum et al., 2024] Sören Schleibaum, Lu Feng, Sarit Kraus, and Jörg P. Müller. ADESSE: Advice Expla- nations in Complex Repeated Decision-Making Environ- ments. arXiv preprint arXiv:2405.20705, 2024.
- [Shin, 2021] Donghee Shin. The effects of explainability and causability on perception, trust, and acceptance: Implica- tions for explainable ai. International Journal of Human- Computer Studies, 146:102551, 2021.
- [Shvo and McIlraith, 2020] Maayan Shvo and Sheila A. McIlraith. Active goal recognition. In Proceedings of the AAAI Conference on Artificial Intelligence, volume 34, pages 9957-9966, 2020.
- [Speith, 2022] Timo Speith. A review of taxonomies of ex- plainable artificial intelligence (xai) methods. In Proceed- ings of the 2022 ACM Conference on Fairness, Account- ability, and Transparency, pages 2239-2250, New York, NY, USA, 2022. Association for Computing Machinery.
- [Sreedharan et al., 2022] Sarath Sreedharan, Utkarsh Soni, Mudit Verma, Siddharth Srivastava, and Subbarao Kamb- hampati. Bridging the gap: Providing post-hoc sym- bolic explanations for sequential decision-making prob- lems with inscrutable representations. In International Conference on Learning Representations, 2022.
- [Topin and Veloso, 2019] Nicholay Topin and Manuela Veloso. Generation of policy-level explanations for reinforcement learning. In Proceedings of the AAAI Conference on Artificial Intelligence, volume 33, pages 2514-2521. AAAI Press, 2019.
- [Torrey and Taylor, 2013] Lisa Torrey and Matthew Taylor. Teaching on a budget: Agents advising agents in rein- forcement learning. In Proceedings of the 2013 interna- tional conference on Autonomous agents and multi-agent systems, pages 1053-1060, Richland, SC, 2013. Interna- tional Foundation for Autonomous Agents and Multiagent Systems.
- [Tran et al., 2023] Thi Ngoc Trang Tran, Alexander Felfer- nig, Viet Man Le, Thi Minh Ngoc Chau, and Thu Giang Mai. User needs for explanations of recommendations: In-depth analyses of the role of item domain and personal characteristics. In Proceedings of the 31st ACM Confer- ence on User Modeling, Adaptation and Personalization, pages 54-65, Limassol Cyprus, 2023. ACM.
- [Vodrahalli et al., 2022] Kailas Vodrahalli, Roxana Daneshjou, Tobias Gerstenberg, and James Zou. Do humans trust advice more if it comes from ai? an analysis of human-ai interactions. In Proceedings of the 2022 AAAI/ACM Conference on AI, Ethics, and Society, pages 763-777, Oxford United Kingdom, 2022. ACM.
- [Vouros, 2022] George A. Vouros. Explainable deep rein- forcement learning: state of the art and challenges. ACM Computing Surveys, 55(5):1-39, 2022.
- [Vultureanu-Albis ¸i and Bȃdicȃ, 2022] Alexandra Vultureanu-Albis ¸i and Costin Bȃdicȃ. A survey on effects of adding explanations to recommender systems. Concurrency and Computation: Practice and Experience, 34(20):e6834, 2022.
- [Wang et al., 2016] Ziyu Wang, Tom Schaul, Matteo Hessel, Hado Hasselt, Marc Lanctot, and Nando Freitas. Duel- ing network architectures for deep reinforcement learn- ing. In International conference on machine learning, pages 1995-2003, New York, NY, USA, 2016. PMLR, JMLR.org.
- [Wells and Bednarz, 2021] Lindsay Wells and Tomasz Bed- narz. Explainable ai and reinforcement learning-a sys- tematic review of current approaches and trends. Frontiers in artificial intelligence, 4:48, 2021.
- [Yan et al., 2023] An Yan, Zhankui He, Jiacheng Li, Tianyang Zhang, and Julian McAuley. Personalized show- cases: Generating multi-modal explanations for recom- mendations. In Proceedings of the 46th International ACM SIGIR Conference on Research and Development in Infor- mation Retrieval, pages 2251-2255, Taipei Taiwan, 2023. ACM.
- [Zhang et al., 2020a] Yongfeng Zhang, Xu Chen, et al. Ex- plainable recommendation: A survey and new perspec- tives. Foundations and Trends® in Information Retrieval, 14(1):1-101, 2020.
- [Zhang et al., 2020b] Yunfeng Zhang, Q Vera Liao, and Rachel KE Bellamy. Effect of confidence and explana- tion on accuracy and trust calibration in ai-assisted de- cision making. In Proceedings of the 2020 conference on fairness, accountability, and transparency, pages 295- 305, Barcelona Spain, 2020. ACM.
References were extracted automatically from the PDF and may contain errors.
Full text extracted automatically from the PDF; figures, tables and equations may differ. The PDF is the version of record.
1 Introduction
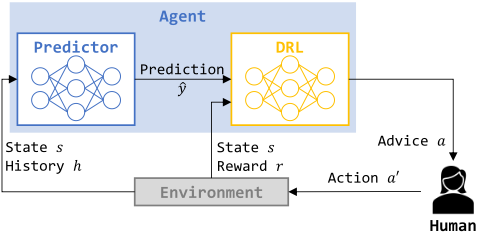
Making complex decisions repeatedly in a dynamic environment is very challenging for humans. An intelligent agent can support human decision-making by providing advice. We consider an adviser agent consisting of two components as shown in Figure 1. At each step, the agent first makes some predictions about the future, and then computes advice based on the prediction and the current state using deep reinforcement learning (DRL). Such adviser agents can and are being used in many real-world applications: For example, providing advice to police officers scheduled through place-based predictive policing [Meijer and Wessels, 2019], providing advice to taxi drivers based on the prediction of future pickup requests from passengers [Farazi et al., 2021], or providing advice to firefighters based on the prediction of wildfire risk [Julian and Kochenderfer, 2019].
Studies have found that the degree to which humans follow an intelligent agent's advice depends on their beliefs about the agent's performance on a given task [Vodrahalli et al., 2022], and that providing explanations improves humans' acceptance and trust in the agent's advice [Zhang et al., 2020b; Shin, 2021]. Hence, this work aims at generating explanations about the adviser agent to improve human's trust and decision-making.
Existing methods for explaining AI-based systems mostly treat the entire system as a black-box model; the generated explanations could be in different output formats (e.g., numerical, textual, visual), but each method usually only focuses on one type of explanations [Adadi and Berrada, 2018; Guidotti et al., 2018; Speith, 2022]. For example, there are several methods (e.g., [Ribeiro et al., 2016; Lundberg and Lee, 2017]) explaining the feature importance of prediction; and there is a growing body of research on explainable reinforcement learning [Vouros, 2022; Wells and Bednarz, 2021; Heuillet et al., 2021; Puiutta and Veith, 2020]. Nevertheless, to the best of our knowledge, none of the prior works generates explanations for both prediction and DRL.
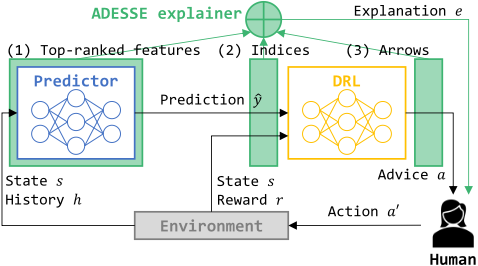
In this work, we present a novel approach named ADESSE (ADvice ExplanationS in complex repeated deciSion-making Environments) 1 . ADESSE peeks inside the black-box model of an adviser agent, leveraging the agent's two-component structure to generate explanations with both textual and visual information. Specifically, an explanation generated by ADESSE includes three key elements: (1) a short list of topranked input features that contribute the most to the agent's prediction; (2) a heatmap visualizing domain-specific indices summarizing the DRL input features; and (3) arrows in various shades of gray overlaying the heatmap to illustrate a trained DRL policy with state importance.
1 ADESSE means "to aid" in Latin.
A key innovation of ADESSE is to generate informative explanations that capture multiple aspects of the adviser agent, from the prediction input to the DRL input to the trained DRL policy. Furthermore, ADESSE reduces the explanation size via selecting top-ranked input features of the prediction and using domain-specific indices to succinctly explain DRL input features.
We adopt LIME [Ribeiro et al., 2016], a popular method for explaining black-box models, as a baseline for comparison. LIME generates explanations represented as (multiple) saliency maps visualizing each input feature's influence on the agent's advice, which can be overwhelming when there is a large number of input features. We hypothesize that explanations generated by ADESSE can be more effective in assisting human decision-making than the baseline.
Computational experiments demonstrate that ADESSE can be successfully applied to a range of environments and scales over varying model sizes. In all cases, ADESSE generates smaller explanations using less time, compared with LIME.
Additionally, we conduct an interactive game-based user study to evaluate the effectiveness of generated explanations. Study results show that participants were significantly more satisfied, achieved a higher reward in the game, and took less time to select an action when presented with explanations generated by ADESSE rather than the baseline.
2 RelatedWork
2.1 Position within the XAI Literature
The research field of explainable artificial intelligence (XAI) has been growing rapidly in recent years, attracting increasing attention [Adadi and Berrada, 2018; Guidotti et al., 2018; Speith, 2022; Saeed and Omlin, 2023; Anjomshoae et al., 2019]. Here, we position this work based on a taxonomy of XAI methods described in [Speith, 2022].
First, depending on the stage when explanations are generated, there are ante-hoc and post-hoc methods. This work belongs to the latter since ADESSE generates explanations after the agent has been trained.
Second, there are model-specific and model-agnostic methods. ADESSE is agnostic to the underlying machine learning techniques for prediction and advice computation.
Third, the scope of explanations can be global or local. An explanation generated by ADESSE consists of three key elements, in which the first element (i.e., a list of top-ranked features for the prediction at a grid cell) is local and the other two elements (i.e., domain-specific indices and arrows for visualizing a DRL policy) are global.
Moreover, XAI methods generate explanations in diverse output formats, including numerical, textual, visual, rules, models, etc. ADESSE generates explanations displayed visually as a heatmap together with textual information about a short list of top-ranked features.
Last but not least, the lack of user studies is a major limitation across many existing XAI works, as pointed out in several survey papers [Wells and Bednarz, 2021; Kraus et al., 2020; Chakraborti et al., 2020]. This work overcomes this limitation by adopting an interactive game-based user study for evaluation.
At first glance, the motivating examples described in the next section seem similar to the task of goal recognition. However, in contrast to goal recognition (see [Shvo and McIlraith, 2020]), we have time-dependent targets and do not learn a probability distribution over goals. Consequently, we cannot base our work on those explaining goal recognition, e.g. [Alshehri et al., 2023].
2.2 Feature Importance
Many XAI methods explain black-box models via computing feature importance (e.g., how much a feature contributes to a prediction). Local Interpretable Model-agnostic Explanations (LIME) [Ribeiro et al., 2016] and SHapley Additive exPlanations (SHAP) [Lundberg and Lee, 2017] are two of the most popular methods in this category.
LIME focuses on training local surrogate models to explain individual predictions. This method works by first generating a new dataset comprising perturbed samples and the corresponding predictions of the black box model, and then using this new dataset to train an interpretable surrogate model that is weighted by the proximity of the sampled instances to the instance of interest. The learned surrogate model can provide a good approximation of local predictions, but does not necessarily guarantee global accuracy.
On the other hand, SHAP computes Shapley values of features (i.e., the average marginal contribution of a feature value across all possible coalitions) by considering all possible predictions for an instance using all possible combinations of inputs. Because of this exhaustive analysis, SHAP can take much longer computation time than LIME. The authors of [Lundberg and Lee, 2017] show that SHAP can guarantee properties such as accuracy and consistency, while LIME is a subset of SHAP but lacks these properties.
2.3 Explainable Reinforcement Learning
Explainable reinforcement learning (XRL) has emerged as a sub-field of XAI with a growing body of research [Vouros, 2022; Wells and Bednarz, 2021; Heuillet et al., 2021; Puiutta and Veith, 2020]. Existing XRL methods can be distinguished by the scope of explanations. Some methods provide explanations about policy-level behaviors, while others explain specific, local decisions (e.g., "Why does the agent select this but not that action in a state?"). Although this work seeks to explain the agent's advice for the current state, we do not restrict to local explanations. The proposed ADESSE approach provides a policy-level explanation that shows what the agent's advice would be in different states with varying features, which can help the human decision-maker better understand the agent's behavior, rather than providing a local explanation about the advised action only. Thus, ADESSE intrinsically aims at increasing the humans' trust in the adviser agent (cf. [Shin, 2021]).
Various types of policy-level explanations have been developed in prior works. For example, a video highlighting the agent's trajectories with important states is proposed in [Amir and Amir, 2018]; such trajectory summaries are augmented with saliency maps in [Huber et al., 2021]. Abstracted policy graphs (i.e., Markov chains of abstract states) are introduced in [Topin and Veloso, 2019] for summarizing RL policies. A chart illustrating the agent coordination and task ordering is used for policy summarization of multi-agent RL in [Boggess et al., 2022]. Additionally, policy-level contrastive explanations (e.g., "Why does the agent follow this but not that policy?") have been considered in [Sreedharan et al., 2022; Finkelstein et al., 2022; Boggess et al., 2023].
To the best of our knowledge, however, none of the existing XRL methods uses a heatmap of domain-specific indices to summarize DRL input features as in ADESSE. Furthermore, we overlay the heatmap with arrows visualizing (advised) optimal actions based on a trained RL policy and annotate these arrows with different shades of gray to indicate the importance degrees of states. We follow the notion of state importance originally proposed in [Torrey and Taylor, 2013], which was adopted in [Amir and Amir, 2018] for summarizing the RL agent's behavior in a selected set of important states. By contrast, our explanation shows the agent's action in every state but highlights importance states with darker arrows.
2.4 Explainable Recommendations
There is a related line of work on explainable recommendations [Zhang et al., 2020a; Vultureanu-Albis¸i and B˘adic˘a, 2022; Naiseh et al., 2020], which refers to recommendation algorithms that not only provide recommendation results, but also explanations to clarify why such items are recommended. For example, image and text-based explanations are generated in [Yan et al., 2023] by first selecting a personalized image set that is the most relevant to a user's interest toward a recommended item and then producing natural language explanations. User needs for explanations of recommendations are investigated in [Tran et al., 2023], where studies find that users in high-involvement domains (e.g., selecting a car to buy) focus more on explanations compared to lower-involvement domains (e.g., selecting a movie to watch).
This work seeks to explain the agent's advice, which can be considered as a type of recommendation; and ADESSE also provides explanations with both visual and textual information. However, our problem setup is different from those recommendation algorithms, which usually do not consider repeated decision-making in complex environments.
3 Problem Setup
We consider a problem setup where an intelligent agent comprising a neural network-based prediction component and a deep reinforcement learning (DRL) component provides advice to a human decision-maker in complex repeated decision-making environments.
As illustrated in Figure 1, at each step, the agent makes some prediction ˆ y about the future based on the current state s and historical data h, and generates an advice a based on a trained DRL policy with the input s and ˆ y, and reward r; the human decision-maker takes an action a′ where a′ = a if the human follows the agent's advice. But sometimes, an alternative action (a′ ̸= a) may be chosen if the human does not trust the agent or does not understand why the agent proposes a certain advice.
This work aims to tackle this problem by generating explanations about the adviser agent to improve the human's trust and decision-making. We make two important assumptions as follows.
- A1: The agent is rational (i.e., seeking to maximize the expected discounted return) and not adversarial to the human decision-maker (i.e., no deception).
- A2: The environment is based on a grid representation with discrete states and actions.
3.1 Motivating Examples
The aforementioned problem setup is commonly shared by many complex repeated decision-making environments. Here we describe two motivating examples used in this work.
Taxi environment. Consider a taxi moving around in a grid world. In our example scenario, we assume the grid size to be 20×20. The taxi can stay put or move horizontally, vertically, or diagonally by up to two grid cells at each step; we assume that one step corresponds to ten minutes real time. The taxi receives a reward of 10 for dropping off a passenger and a penalty of -1 per step for driving without any passenger. In each episode, the taxi starts at a random grid cell and time and terminates by the end of a nine-hour shift (i.e., 54 steps).
At each step of an episode, the adviser agent predicts the number of pick-up requests in each grid cell for the next step, based on a rich set of features, including the number of pickup requests of the last 40 minutes, points of interest in each cell, as well as location-independent features such as date, time, holiday, and weather. Then, the agent advises an action for the taxi based on a DRL policy trained using the number of predicted pick-up requests and available taxis in each grid cell and the received reward.
The taxi driver decides whether to follow the agent's advice or take an alternative action, which would impact the environment's feedback of state and reward. The above process repeats until the end of an episode.
Wildfire environment. Consider an aerial vehicle (AV) flying over a forest (modeled as a grid world) aiming to extinguish a wildfire. At each step (corresponding to 2.5 minutes), the AV can choose one of three types of actions: (1) extinguish the fire in the current grid cell, (2) stay put, or (3) decide to relocate by one cell in either of the four cardinal directions. When the AV chooses the extinguish action in a grid cell with a high neighborhood fire ratio, the AV receives a large positive reward that is calculated based on the neighborhood fire ratio. The AV receives a penalty of -2.5 for taking the extinguish action in a grid cell with a low neighborhood fire ratio, and a cost of -1 per step for moving around. In each episode, the AV starts at a random grid cell and terminates after 100 steps.
At each step, the adviser agent predicts the fire risk (i.e., the probability of fire occurrences) in each grid cell, based on features including each grid cell's forest fuel level and burning status. Then, the agent advises an action for the AV based on a DRL policy trained using the fire risk prediction, the current state and the received reward.
The AV operator decides whether to follow the agent's advice, which would also affect the state of the environment. The above process repeats until an episode terminates.
3.2 Baseline Explanations
The baseline explainer considers a black-box model consisting of the adviser agent's two components as a whole and explains input features' influence on the output advice. We apply LIME [Ribeiro et al., 2016] to check what happens to the agent's advice when the input features are perturbed and compute an influence value for each feature. We select LIME to generate baseline explanations (cf. Section 3.2), because SHAP is too slow for computational experiments. SHAP yields time-out (i.e., more than two minutes) for most models used in our experiments, while LIME and the proposed ADESSE approach can generate explanations within a few seconds. The generated baseline explanations are represented as saliency maps showing how much each feature contributes to the agent's advice.
For an example saliency map illustrating the influence of each grid cell's current pick-up request counts on the agent's advice see the Appendix of [Schleibaum et al., 2024]. The baseline explanation generated at each step may include multiple saliency maps corresponding to different features. For example, there are five saliency maps generated for the taxi environment per step. We hypothesize that such a baseline explanation is overwhelming and cannot effectively assist humans with decision-making.
4 Approach
To address the limitations of baseline explanations, we propose an approach named ADESSE that leverages the problem structure and generates explanations consisting of three key elements as shown in Figure 2. First, a list of top-ranked features is selected based on their contributions to the prediction (cf. Section 4.1). Second, a domain-specific index function is used to summarize the DRL input features (cf. Section 4.2). Third, the trained DRL policy is visualized as arrows in a grid world with importance degrees (cf. Section 4.3). And finally, we describe how ADESSE generates an explanation integrating these elements (cf. Section 4.4).
4.1 Top-Ranked Features for the Prediction
We rank input features of the prediction component based on Shapley values computed via SHAP [Lundberg and Lee, 2017], which tells us the contribution of each feature to the prediction. We favor SHAP over LIME here, because identifying the top-ranked features for a few selected predictions with the smaller search space allows a fast computation time and we want the properties guaranteed by SHAP.
To reduce the explanation size, we focus on selecting a short list of top-ranked features for an individual prediction output at a time. For example, for the taxi environment, the human decision-maker may be interested to know what are the top six features contributing to the pick-up request prediction at the taxi's current location or the advised next location. Such explanations could improve the human's trust in the agent's prediction component.
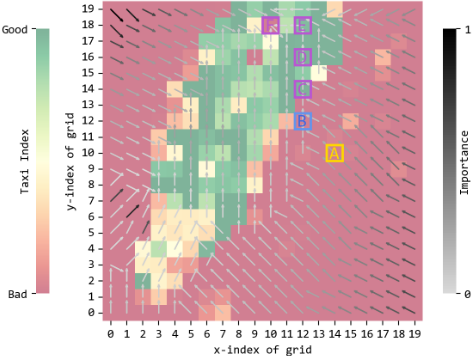
During a game-based user study (cf. Section 6), the human decision-maker can choose from a list of locations (e.g., grid cells labeled with A-F in Figure 3) for displaying the topranked features that contribute the most to the prediction in each location.
4.2 Domain-Specific Indices
To explain the input of the agent's DRL component, we summarize the DRL input features using a domain-specific index function, rather than showing multiple saliency maps (i.e., one for each DRL input feature) as in baseline explanations.
Taxi environment. Recall from Section 3.1 that the DRL input features for the taxi environment include the number of predicted pick-up requests and available taxis in each grid cell. Inspired by the demand-supply ratio, a metric commonly used in the market for taxi services [Kamga et al., 2015], we define an index function for the taxi environment as follows.
where g ∈ G is a grid cell in the taxi grid world, |G| is the total number of grid cells, and ρ(g) and τ(g) are the number of predicted requests and available taxis in a grid cell g, respectively. We set η = 0.75 to balance the trade-off between the demand-supply ratio of taxi services and the ratio of predicted requests in a grid cell g compared with the average requests over the entire grid world G. Figure 3 shows an example heatmap of the obtained taxi indices where the darkest red indicates that ϕtaxi(g) = 0.
Wildfire environment. For each grid cell g in the forest grid world G, the DRL input features for the wildfire environment include the predicted fire risk µ(g) ∈ [0, 1], the normalized forest fuel level θ(g) ∈ [0, 1] and the burning status β(g) ∈ {true, false}. We define an index function for the wildfire environment based on domain knowledge [Haksar and Schwager, 2018; Julian and Kochenderfer, 2019] as follows.
The intuition is that, when a grid cell has caught fire, a higher forest fuel level and higher predicted fire risk would lead to more severe fire, and hence a more negative value of the wildfire index; conversely, when a cell is not on fire, it is safer (i.e., more positive value of the wildfire index) when there is a lower forest fuel level and lower predicted fire risk. An example heatmap of the obtained wildfire indices is shown in the Appendix of [Schleibaum et al., 2024].
4.3 Arrows with Importance Degrees
To improve the human decision-maker's trust in the adviser agent, we visualize the trained DRL policy for the entire grid world rather than only displaying the agent's advice for the current grid cell. Let gt ∈ G denote the current grid cell at time t. The DRL state σt is given by the environment state st (which includes gt as a feature) and the predicted state ˆ yt . Let σt[g] denote a DRL state that replaces gt with a grid cell g ∈ G but preserves all the other features of σt. For example, in the taxi environment, σt[g] represents a state where g is an assumed location of the taxi, and the rest of DRL input features (i.e., number of predicted pick-up requests and available taxis at each grid cell) stay the same as in σt. Given a trained DRL policy πt at time t, the optimal action a(g) in a grid cell g seeks to maximize the Q-value that estimates the rewards ultimately achievable by taking an action in a state.
where α denotes any possible action in state σt[g].
Algorithm 1 Generating an explanation at a time step t
Input: Grid world G, current grid gt, current state st, predication input xt and output ˆ yt, DRL input σt ⊆ st ∪ ˆ yt and policy πt
Parameter: Optional list of parameters
Output: Explanation et
- 1: for all g in a finite path starting from gt following πt do
- 2: F ←append top-ranked features f(g) ⊂ xt
- 3: end for
- 4: for all g ∈ G do
- 5: Compute domain-specific indices ϕ(g) based on σt
- 6: Compute optimal action a(g)
- 7: Compute the normalized importance degree δ(g)
- 8: end for
- 9: return et = ⟨F, {ϕ(g)}g∈G, {a(g), δ(g)}g∈G⟩
Figure 3 plots the optimal action in each grid cell as an arrow overlaying the index heatmap obtained from Section 4.2. Moreover, we annotate these arrows with various shades of gray to represent the normalized importance degrees. We define the importance degree of each grid cell g ∈ G following the notion of state importance proposed in [Torrey and Taylor, 2013]:
Intuitively, if all actions in a state share the same Q-value, then the state is the least important for advising because it does not matter which action is chosen. We normalize importance degrees I(g) over the entire grid world G and obtain:
such that the normalized importance degree δ(g) ∈ [0, 1].
4.4 Explanation Generation Algorithm
Algorithm 1 illustrates the procedure of ADESSE generating an explanation at a time step t by integrating these aforementioned elements. First, a set of locations along a finite path starting from the current grid gt and following the trained DRL policy πt is identified (e.g., A-F in Figure 3) and a list of top-ranked input features for the prediction in each location is selected as described in Section 4.1. Next, for each grid g ∈ G in the grid world, a domain-specific index (e.g., ϕtaxi(g) and ϕfire(g) introduced in Section 4.2) is computed to summarize the DRL input features and plotted in a heatmap. Lastly, the optimal action a(g) and the normalized importance degree δ(g) for each grid g ∈ G is computed following Section 4.3, which are plotted as arrows with various shades of gray overlaying the heatmap of indices. The generated explanation is returned as a heatmap as shown in Figure 3, together with separate lists of top-ranked features for the prediction.
5 Computational Experiments
We build a prototype implementation 2 of ADESSE and compare its performance with the baseline explainer using LIME
2 https://github.com/sorensc/ADESSE
| Environment | Explanation Size | Time (seconds) | |||
|---|---|---|---|---|---|
| Domain | |G| | Baseline | ADESSE | Baseline | ADESSE |
| Taxi | 10×10 | 0.71K | 0.24K | 7.2 | 0.9 |
| 20×20 | 2.81K | 0.84K | 10.0 | 1.3 | |
| 40×40 | 11.21K | 3.24K | 18.3 | 5.9 | |
| 80×80 | 44.81K | 12.84K | 41.2 | 25.5 | |
| Wildfire | 10×10 | 0.30K | 0.24K | 0.9 | 0.2 |
| 20×20 | 1.20K | 0.84K | 1.5 | 0.4 | |
| 40×40 | 4.80K | 3.24K | 2.9 | 0.9 | |
| 80×80 | 19.20K | 12.84K | 8.5 | 3.0 | |
(cf. Section 3.2) via computational experiments on the taxi and wildfire environments with varying model sizes.
5.1 Implementation
Taxi environment. We implemented the prediction component as a feed-forward neural network consisting of five fully connected layers with 20, 128, 64, 32, and 16 neurons; and utilized the dueling double deep Q-learning [Wang et al., 2016] for the DRL component (three convolutional and three fully connected layers). The New York City Yellow Taxi dataset 3 was used for training and validation (186 million trips taken between January 2015 and June 2016), where the GPS start and end locations of trips were mapped to grid cells in the environment.
Wildfire environment. For this environment, we implemented the prediction component as a feed-forward neural network with three layers of 6, 512, and 512 neurons; as in the taxi environment, dueling double deep Q-learning [Wang et al., 2016] was used for the DRL component (three convolutional and three fully connected layers). The environment dynamics (forest fire model) was adapted from [Haksar and Schwager, 2018; Julian and Kochenderfer, 2019].
Setup. All experiments were run on a MacBook laptop with an Apple M1 Pro chip, 32 GB of memory, and Ventura 13.5.2 operating system.
5.2 Results
Table 1 shows the experimental results. For each model, we report the grid world size |G|, and compare the baseline and ADESSE in terms of the explanation size and the average time of generating an explanation per step over 10 independent runs. We draw the following key insights from the results:
- Both the baseline explainer and ADESSE can successfully generate explanations for different environments with varying model sizes.
- The size of ADESSE explanation is significantly smaller than that of the baseline explanation across all models, and the size difference increases as the grid world grows larger.
3 https://www.nyc.gov/site/tlc/about/tlc-trip-record-data.page
- ADESSE is generally faster than the baseline and can generate an explanation within a few seconds for all models used in the experiments.
6 Game-Based User Study
We evaluate the effectiveness of explanations generated by ADESSE via an interactive game-based user study 4 . We describe the study design in Section 6.1, report the results and discuss the insights in Section 6.2.
6.1 Study Design
Game. We designed an interactive game based on the taxi environment described in Section 3.1. Each study participant was asked to act as a taxi driver who was incentivized to choose the optimal action in the environment at each step, in order to receive a high reward. The participants were presented with baseline explanations and with explanations generated by ADESSE; our goal was to find to what extent and how this influences their decisions in terms of whether or not to follow the advised actions. An example screenshot of the game user interface is shown in the Appendix of [Schleibaum et al., 2024].
Participants. We recruited 28 participants; all of them were over the age of 18, fluent in English (since the game instructions were written in English), and did not have color blindness (which would have affected their ability to recognize the presented explanations). The average age of the participants was 28.96 years with a standard deviation of 8.27 years 5 . 39% of the participants were female and 61% male. To ensure data quality, each participant responded to three attention-check questions during the study.
Independent variables. We adopted a within-subject study design where participants were asked to engage in two study trials, each of which involved playing the game for twelve steps with explanations generated by either ADESSE or by the baseline explainer using LIME. To counterbalance the ordering confound effect, one half of the participants were randomly selected to start the study trial with baseline explanations, followed by a trial with explanations generated by ADESSE; the other half of the participants took the two study trials in reversed order.
Dependent variables. We recorded the average time spent to choose an action, the total reward achieved in a study trial, and the percentage of steps where the agent's advice was followed in a trial. At the end of each study trial, we also collected the participant ratings on a 5-point Likert scale (1 - strongly disagree, 5 - strongly agree) about the following statements adapted from [Hoffman et al., 2018] regarding the explanation satisfaction scale:
- The explanations help me understand how the agent's advice is computed.
4 The study was approved by institutional review board.
5 Note that drivers of private transportation services such as Uber represent the demographic group from which we recruited the subjects for the study.
- The explanations are satisfying.
- The explanations are sufficiently detailed.
- The explanations are sufficiently complete, that is, they provide me with all the needed information to make decisions.
- The explanations are actionable, that is, they help me know how to make decisions.
- The explanations let me know how reliable the agent is for decision support.
- The explanations let me know how trustworthy the agent is for decision support.
Procedure. During the study, each participant was first briefed about the study purpose and the game instructions. Then, the participant was asked to play a study trial with one type of explanation (i.e., baseline or ADESSE) and give ratings on the explanation satisfaction scale. Next, the participant was asked to play a second trial with the other explanation type, followed by explanation satisfaction ratings. The study was wrapped up with demographic questions (e.g., age, gender). Additionally, to gain better insights into the behavior of participants, we asked a randomly selected set of participants to describe what their decision-making strategy was, and give an appraisal of how confident they were to choose a better action than the agent's advice.
Hypotheses. We investigated three hypotheses stated below.
- H1: Explanations generated by ADESSE lead to higher ratings on the explanation satisfaction scale than the baseline.
- H2: Explanations generated by ADESSE enable the participants to take less time to choose actions than the baseline.
- H3: Explanations generated by ADESSE enable the participants to achieve a higher total reward than the baseline.
6.2 Study Results and Discussion
We utilized a Wilcoxon signed-rank test to evaluate H1 and used a paired t-test to evaluate H2 and H3. For all tests, we set the significance level as 0.05.
Explanation satisfaction scale ratings. As shown in Figure 4, participants ratings of explanations generated by ADESSE are higher than ratings of the baseline in all explanation satisfaction scale metrics with statistically significant differences. Thus, the data supports H1.
Time for choosing actions. On average, participants took less time to choose actions when being presented with explanations generated by ADESSE (M = 38.78, SD = 15.90) compared to baseline explanations (M = 52.82, SD = 27.72). The difference is statistically significant (t = 2.9182, p = 0.0070). Thus, the data supports H2.
Total reward. The participants achieved a higher average reward when being presented with explanations generated by ADESSE (M = 98.18, SD = 13.18) than baseline explanations (M = 90.18, SD = 18.13). However, the paired t-test yields (t = -1.8216, p = 0.0796) with the p value slightly higher than 0.05. Thus, the data partially supports H3.
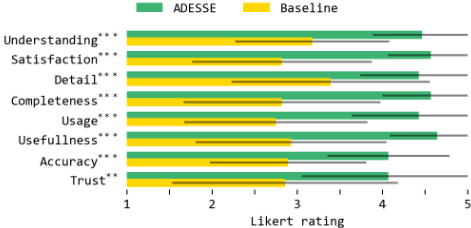
Discussion. One of the reasons that participants were more satisfied with explanations generated by ADESSE, as indicated by the higher ratings on the explanation satisfaction scale, could due to the fact that explanations generated by ADESSE are more succinct and informative than baseline explanations (note that there are five saliency maps in each baseline explanation generated by LIME). This may also justify the reason of participants took less time to choose actions with explanations generated by ADESSE, since it requires more time to read and understand baseline explanations.
7 Conclusion
We presented ADESSE, a novel approach for generating visual and text-based explanations about an intelligent agent that provides advice to a human decision-maker in complex repeated decision-making environments. The agent consists of two deep learning-based components: one for making predictions about the future, and the other for computing advised actions with deep reinforcement learning based on the predicted future and the current state. ADESSE leverages the agent's two-component structure and generates explanations with visual and textual information, to improve the human's trust in the agent and thus better assist human decisionmaking. Results of computational experiments demonstrate the applicability and scalability of ADESSE, while an interactive game-based user study shows the effectiveness of explanations generated by ADESSE.
There are several directions to explore for possible future work. First, we will extend ADESSE to be able to deal with environments with continuous state/action space, beyond grid world environments considered in this work. For example, there has been increasing interest in using deep learning to predict future blood glucose levels of diabetes patients and then compute an advised insulin dosage based on the prediction via deep reinforcement learning [Emerson et al., 2023]. Moreover, we will explore an extension to the multi-agent setting where advice is computed via multi-agent DRL.
Acknowledgements
S¨oren Schleibaum was supported by the Deutsche Forschungsgemeinschaft under grant 227198829/GRK1931. Lu Feng was supported by U. S. National Science Foundation under grant CCF-1942836. Sarit Kraus was supported in part by the EU Project TAILOR under grant 952215.
@inproceedings{ijcai2024p875,
  title     = {ADESSE: Advice Explanations in Complex Repeated Decision-Making Environments},
  author    = {Schleibaum, Sören and Feng, Lu and Kraus, Sarit and Müller, Jörg P.},
  booktitle = {Proceedings of the Thirty-Third International Joint Conference on
               Artificial Intelligence, {IJCAI-24}},
  publisher = {International Joint Conferences on Artificial Intelligence Organization},
  editor    = {Kate Larson},
  pages     = {7904--7912},
  year      = {2024},
  month     = {8},
  note      = {Human-Centred AI},
  doi       = {10.24963/ijcai.2024/875},
  url       = {https://doi.org/10.24963/ijcai.2024/875},
}
TY - CPAPER TI - ADESSE: Advice Explanations in Complex Repeated Decision-Making Environments AU - Schleibaum, Sören AU - Feng, Lu AU - Kraus, Sarit AU - Müller, Jörg P. T2 - Proceedings of the Thirty-Third International Joint Conference on Artificial Intelligence, IJCAI-24 PB - International Joint Conferences on Artificial Intelligence Organization PY - 2024 SP - 7904 EP - 7912 DO - 10.24963/ijcai.2024/875 UR - https://doi.org/10.24963/ijcai.2024/875 ER -Copied
Machine-readable versions of this paper, for tools and AI agents:





