
NSF-MAP: Neurosymbolic Multimodal Fusion for Robust and Interpretable Anomaly Prediction in Assembly Pipelines
Proceedings of the Thirty-Fourth International Joint Conference on Artificial Intelligence. AI4Tech: AI Enabling Technologies. Pages 9330-9338.
https://doi.org/10.24963/ijcai.2025/1037
Keywords
- Domain-specific AI4Tech: Other AI4Tech applications
- Domain-specific AI4Tech: AI4Manufacturing
- Advanced AI4Tech: Multimodal AI4Tech
- Emerging AI4Tech: Emerging AI4Tech areas
Abstract
In modern assembly pipelines, identifying anomalies is crucial in ensuring product quality and operational efficiency. Conventional single-modality methods fail to capture the intricate relationships required for precise anomaly prediction in complex predictive environments with abundant data and multiple modalities. This paper proposes a neurosymbolic AI and fusion-based approach for multimodal anomaly prediction in assembly pipelines. We introduce a time series and image-based fusion model that leverages decision-level fusion techniques. Our research builds upon three primary novel approaches in multimodal learning: time series and image-based decision-level fusion modeling, transfer learning for fusion, and knowledge-infused learning. We evaluate the novel method using our derived and publicly available multimodal dataset and conduct comprehensive ablation studies to assess the impact of our preprocessing techniques and fusion model compared to traditional baselines. The results demonstrate that a neurosymbolic AI-based fusion approach that uses transfer learning can effectively harness the complementary strengths of time series and image data, offering a robust and interpretable approach for anomaly prediction in assembly pipelines with enhanced performance. \noindent The datasets, codes to reproduce the results, supplementary materials, and demo are available at https://github.com/ChathurangiShyalika/NSF-MAP.
- [Capogrosso et al., 2023] Luigi Capogrosso, Alessio Mas- colini, Federico Girella, Geri Skenderi, Sebastiano Ga- iardelli, Nicola Dall'Ora, Francesco Ponzio, Enrico Frac- caroli, Santa Di Cataldo, Sara Vinco, Enrico Macii, Franco Fummi, and Marco Cristani. Neuro-symbolic empow- ered denoising diffusion probabilistic models for real-time anomaly detection in industry 4.0: Wild-and-crazy-idea paper. pages 1-4, 09 2023.
- [Chandola and Banerjee, 2009] V. Chandola and V. Baner- jee, A.and Kumar. Anomaly detection: A survey. ACM Computing Surveys (CSUR), 41(3):1-58, 2009.
- [Harik et al., 2024] Ramy Harik, Fadi El Kalach, Jad Samaha, Devon Clark, Drew Sander, Philip Samaha, Liam Burns, Ibrahim Yousif, Victor Gadow, Theodros Tarekegne, et al. Analog and multi-modal manufacturing datasets acquired on the future factories platform. arXiv preprint arXiv:2401.15544, 2024.
- [Iwana and Uchida, 2020] Brian Kenji Iwana and Seiichi Uchida. Time series classification using local distance- based features in multi-modal fusion networks. Pattern Recognition, 97:107024, 2020.
- [Jaafar and Lachiri, 2023] Noussaiba Jaafar and Zied Lachiri. Multimodal fusion methods with deep neural networks and meta-information for aggression detection in surveillance. Expert Systems with Applications, 211:118523, 2023.
- [Jayaswal and Dixit, 2021] Ruchi Jayaswal and Manish Dixit. A framework for anomaly classification using deep transfer learning approach. Revue d'Intelligence Artifi- cielle, 35(3), 2021.
- [Kaya et al., 2017] Heysem Kaya, Furkan Gürpınar, and Al- bert Ali Salah. Video-based emotion recognition in the wild using deep transfer learning and score fusion. Image and Vision Computing, 65:66-75, 2017.
- [Kim et al., 2023] Yoonseok Kim, Taeheon Lee, Youngjoo Hyun, Eric Coatanea, Siren Mika, Jeonghoon Mo, and YoungJun Yoo. Self-supervised representation learning anomaly detection methodology based on boosting algo- rithms enhanced by data augmentation using stylegan for manufacturing imbalanced data. Computers in Industry, 153:104024, 2023.
- [Lughofer et al., 2022] Edwin Lughofer, Patrick Zorn, and Edmund Marth. Transfer learning of fuzzy classifiers for optimized joint representation of simulated and measured data in anomaly detection of motor phase currents. Applied Soft Computing, 124:109013, 2022.
- [Maschler et al., 2021] Benjamin Maschler, Tim Knodel, and Michael Weyrich. Towards deep industrial transfer learning for anomaly detection on time series data. In 2021 26th IEEE International Conference on Emerging Tech- nologies and Factory Automation (ETFA), pages 01-08. IEEE, 2021.
- [McCormick et al., 2025] MR McCormick, Fadi El Kalach, Mojtaba A Farahani, Ramy Harik, and Thorsten Wuest. Real-time rocket assembly line manufacturing datasets. 2025.
- [Meng et al., 2013] Hongying Meng, Di Huang, Heng Wang, Hongyu Yang, Mohammed Ai-Shuraifi, and Yun- hong Wang. Depression recognition based on dynamic fa- cial and vocal expression features using partial least square regression. In Proceedings of the 3rd ACM international workshop on Audio/visual emotion challenge, pages 21- 30, 2013.
- [Moghaddam et al., 2023] Farshad Bakhshandegan Moghaddam, Jens Lehmann, and Hajira Jabeen. Anomaly detection for numerical literals in knowledge graphs: A short review of approaches. 2023 IEEE Sixth In- ternational Conference on Artificial Intelligence and Knowledge Engineering (AIKE), pages 46-53, 2023.
- [Nedelkoski et al., 2019] Sasho Nedelkoski, Jorge Cardoso, and Odej Kao. Anomaly detection from system tracing data using multimodal deep learning. 2019 IEEE 12th International Conference on Cloud Computing (CLOUD), pages 179-186, 2019.
- [Pan and Yang, 2009] Sinno Jialin Pan and Qiang Yang. A survey on transfer learning. IEEE Transactions on knowl- edge and data engineering, 22(10):1345-1359, 2009.
- [Prasad et al., 2024] Renjith Prasad, Chathurangi Shyalika, Fadi El Kalach, Revathy Venkataramanan, Ramtin Zand, Ramy Harik, and Amit Sheth. Assemai: Inter- pretable image-based anomaly detection for manufactur- ing pipelines. In 2024 International Conference on Ma- chine Learning and Applications (ICMLA), pages 1720- 1727, 2024.
- [Qu et al., 2024] Xinji Qu, Zhuo Liu, Chase Q Wu, Aiqin Hou, Xiaoyan Yin, and Zhulian Chen. Mfgan: multimodal fusion for industrial anomaly detection using attention- based autoencoder and generative adversarial network. Sensors, 24(2):637, 2024.
- [Roggen et al., 2013] Daniel Roggen, Gerhard Tröster, and Andreas Bulling. Signal processing technologies for activity-aware smart textiles. In Multidisciplinary know- how for smart-textiles developers, pages 329-365. Else- vier, 2013.
- [Schilcher et al., 2024] Jörg Schilcher, Alva Nilsson, Oliver Andlid, and Anders Eklund. Fusion of electronic health records and radiographic images for a multimodal deep learning prediction model of atypical femur fractures. Computers in Biology and Medicine, 168:107704, 2024.
- [Series, 2024] Enhanced Multimodal Time Series. Design of an iterative method for enhanced multimodal time series analysis using graph attention networks, variational graph autoencoders, and transfer learning. J. Electrical Systems, 20(5s):2579-2598, 2024.
- [Sheth et al., 2023] Ami N. Sheth, Kaushik Roy, and Manas Gaur. Neurosymbolic ai -why, what, and how. ArXiv, abs/2305.00813, 2023.
- [Shyalika et al., 2024a] Chathurangi Shyalika, Kaushik Roy, Renjith Prasad, Fadi El Kalach, Yuxin Zi, Priya Mittal, Vi- gnesh Narayanan, Ramy Harik, and Amit Sheth. Ri2ap: Robust and interpretable 2d anomaly prediction in assem- bly pipelines. Sensors, 24(10):3244, 2024.
- [Shyalika et al., 2024b] Chathurangi Shyalika, Ruwan Wickramarachchi, Fadi El Kalach, Ramy Harik, and Amit Sheth. Evaluating the role of data enrichment approaches towards rare event analysis in manufacturing. Sensors, 24(15):5009, 2024.
- [Shyalika et al., 2024c] Chathurangi Shyalika, Ruwan Wickramarachchi, and Amit P Sheth. A comprehensive survey on rare event prediction. ACM Computing Surveys, 57(3):1-39, 2024.
- [Shyalika et al., 2025a] Chathurangi Shyalika, Renjith Prasad, Alaa Al Ghazo, Darssan L Eswaramoorthi, Sara Shree Muthuselvam, and Amit Sheth. Smartpilot: Agent- based copilot for intelligent manufacturing. In Proc. of the 24th International Conference on Autonomous Agents and Multiagent Systems, pages 3053-3055, 2025.
- [Shyalika et al., 2025b] Chathurangi Shyalika, Renjith Prasad, Alaa Al Ghazo, Darssan Eswaramoorthi, Harleen Kaur, Sara Shree Muthuselvam, and Amit Sheth. Smart- pilot: A multiagent copilot for adaptive and intelligent manufacturing. In 2025 IEEE Conference on Artificial Intelligence (IEEE CAI), 2025.
- [Tan and Le, 2019] M. Tan and Q. V. Le. Efficientnet: Re- thinking model scaling for convolutional neural networks. Proceedings of the International Conference on Machine Learning (ICML), 97:6105-6114, 2019.
- [Torrey and Shavlik, 2010] Lisa Torrey and Jude Shavlik. Transfer learning. In Handbook of research on machine learning applications and trends: algorithms, methods, and techniques, pages 242-264. IGI global, 2010.
- [Wang et al., 2014] Xiaoqin Wang, Xiangan Chen, and Lu Li. Spatial and temporal image fusion for time series modis data and multi-sensors medium resoultion data. In 2014 IEEE Geoscience and Remote Sensing Symposium, pages 2538-2541. IEEE, 2014.
- [Wang et al., 2023] Xiaoqiao Wang, Mingzhou Liu, Conghu Liu, Lin Ling, and Xi Zhang. Data-driven and knowledge- based predictive maintenance method for industrial robots for the production stability of intelligent manufacturing. Expert Systems with Applications, 234:121136, 2023.
- [Yan et al., 2024] Peng Yan, Ahmed Abdulkadir, Paul- Philipp Luley, Matthias Rosenthal, Gerrit A Schatte, Ben- jamin F Grewe, and Thilo Stadelmann. A comprehensive survey of deep transfer learning for anomaly detection in industrial time series: Methods, applications, and direc- tions. IEEE Access, 2024.
- [Yang et al., 2021] Zijun Yang, Chunyuan Diao, and Bo Li. A robust hybrid deep learning model for spatiotemporal image fusion. Remote Sensing, 13(24):5005, 2021.
- [Zhang et al., 2022] Shenglin Zhang, Zhenyu Zhong, Dong- wen Li, Qiliang Fan, Yongqian Sun, Man Zhu, Yuzhi Zhang, Dan Pei, Jiyan Sun, Yinlong Liu, et al. Efficient kpi anomaly detection through transfer learning for large- scale web services. IEEE Journal on Selected Areas in Communications, 40(8):2440-2455, 2022.
- [Zhang et al., 2024] Qingyang Zhang, Yake Wei, Zongbo Han, Huazhu Fu, Xi Peng, Cheng Deng, Qinghua Hu, Cai Xu, Jie Wen, Di Hu, et al. Multimodal fusion on low-quality data: A comprehensive survey. arXiv preprint arXiv:2404.18947, 2024.
- [Zhao et al., 2020] Minglu Zhao, Reo Furuhata, Mulya Agung, Hiroyuki Takizawa, and Tomoya Soma. Failure prediction in datacenters using unsupervised multimodal anomaly detection. 2020 IEEE International Conference on Big Data (Big Data), pages 3545-3549, 2020.
- [Zhao et al., 2022] Yingying Zhao, Haoyu Sun, Naiwang Guo, Yi Wu, Yingjie Tian, and Da Zhao Cheng. Improving anomaly detection in smart grid big data with knowledge graphs. Proceedings of the 2022 6th International Confer- ence on Electronic Information Technology and Computer Engineering, 2022.
- [Zhuo et al., 2021] Ming Zhuo, Leyuan Liu, Shijie Zhou, and Zhiwen Tian. Survey on security issues of routing and anomaly detection for space information networks. Scien- tific Reports, 11, 2021.
References were extracted automatically from the PDF and may contain errors.
Full text extracted automatically from the PDF; figures, tables and equations may differ. The PDF is the version of record.
1 Introduction
Anomaly prediction in industrial assembly pipelines is essential for maintaining product quality and operational efficiency. Traditional methods focusing on unimodal data [Chandola and Banerjee, 2009; Kim et al., 2023; Shyalika et al., 2024a] often fall short in complex environments where anomalies are influenced by multiple variables. Multimodal
Video URL:https://shorturl.at/LCdsO
anomaly prediction provides a more comprehensive and accurate prediction mechanism by uncovering hidden patterns and relationships that single-modality methods often overlook [Nedelkoski et al., 2019; Zhao et al., 2020]. This approach is particularly beneficial in manufacturing settings where variables like temperature, speed, and visual inspections are interrelated, necessitating advanced methods to handle multimodal and multivariate data effectively [Zhao et al., 2020; Nedelkoski et al., 2019]. Despite the benefits of multimodal anomaly prediction, challenges such as the extreme scarcity of datasets containing both time-series and image data-where we identified only one (details in Section 3)-along with poor performance metrics, real-time integration difficulties, and limited interpretability persist in manufacturing assembly processes, highlighting the need for more practical, scalable, and interpretable solutions [Shyalika et al., 2024c; Shyalika et al., 2024b; McCormick et al., 2025]
Multimodal fusion has emerged recently as a promising approach for integrating multiple data modalities to enhance the accuracy and robustness of various applications [Zhang et al., 2024; Jaafar and Lachiri, 2023]. This integration leverages the complementary strengths of each modality, enabling a more comprehensive analysis. Decision-level fusion (a.k.a. late fusion) is a fusion technique that combines the decisions of multiple classifiers into a shared decision about any activity that occurred [Roggen et al., 2013]. Here, each classifier independently analyzes features and makes preliminary decisions, which are then aggregated into a fused decision vector to derive the final task decision[Kaya et al., 2017; Meng et al., 2013]. However, since the classifiers operate independently, decision-level fusion often fails to capture implicit semantic associations among the variables, leading to a loss of context, inconsistencies among classifier outputs, and challenges in interpretability and scalability.
Neurosymbolic AI integrates neural network-based techniques with symbolic knowledge-based approaches, offering two key perspectives for understanding this integration: (1) algorithmic-level considerations and (2) application-level considerations in AI systems [Sheth et al., 2023]. This work uses a neurosymbolic AI-based knowledge-infusion for anomaly prediction. Knowledge-infusion allows us to integrate domain knowledge with data-driven approaches, providing a foundation for more robust and interpretable AI models. Building on this concept, we propose NSF-MAP (Neurosymbolic Multimodal Fusion for Robust and Interpretable Anomaly Prediction), a novel framework specifically designed for robust and interpretable anomaly prediction in manufacturing pipelines. This work is part of a broader research initiative focused on the development of SmartPilot, a custom, compact, and neurosymbolic CoPilot for intelligent manufacturing [Shyalika et al., 2025b; Shyalika et al., 2025a]. NSF-MAP is the anomaly prediction agent within SmartPilot's multi-agent architecture, to support robust, real-time decision-making in industrial settings.
- A novel anomaly prediction model for assembly pipelines that leverages neurosymbolic AI-based decision-level fusion combined with transfer learning.
- Two derived datasets, one multimodal and one analog, designed for anomaly prediction in assembly pipelines, developed using domain-specific insights.
- Integration of advanced user-level explainability techniques, including an ontology-based method, to enhance the interpretability of our predictions.
2 RelatedWork
2.1 FusionModels and Transfer Learning Techniques
Recent advancements combine time series and image fusion with transfer learning to improve anomaly detection and prediction across domains. In manufacturing, the MFGAN model [Qu et al., 2024] leverages attention-based autoencoders with GANs on multimodal temporal data for anomaly prediction, while fusion models like ESTARFM [Wang et al., 2014], SRCNN+LSTM [Yang et al., 2021], and DTWCNN [Iwana and Uchida, 2020] enhance spatial, temporal, and sequential learning in remote sensing. In healthcare, integrating EHR with radiographic images improves atypical femur fracture classification [Schilcher et al., 2024]. Transfer learning methods address data scarcity and dynamic conditions by adapting learned representations across tasks in industrial [Yan et al., 2024; Maschler et al., 2021], surveillance [Jayaswal and Dixit, 2021], and web domains [Zhang et al., 2022]. Techniques like Variational Autoencoders, Graph Attention Networks, and fuzzy classifiers further improve detection accuracy [Series, 2024; Lughofer et al., 2022], though challenges remain in domain adaptation, model complexity, real-time processing, and interpretability.
2.2 Neurosymbolic AI inManufacturing
Knowledge graphs have been applied to anomaly detection by embedding structural and attribute features for threat assessment [Moghaddam et al., 2023; Zhuo et al., 2021; Zhao et al., 2022; Wang et al., 2023]. Approaches include cybersecurity knowledge graphs with GNNs [Zhuo et al., 2021; Wang et al., 2023], Neo4j-based power database evaluation [Zhao et al., 2022], hybrid neuro-symbolic methods combining data-driven models with industrial ontologies [Capogrosso et al., 2023], and predictive maintenance for industrial robots [Wang et al., 2023]. However, no existing work leverages neurosymbolic AI-based multimodal fusion for anomaly prediction in manufacturing. Integrating symbolic reasoning with neural models on multimodal data holds potential to improve robustness and interpretability in complex industrial settings.
| Time series Data | Image Data | |||
|---|---|---|---|---|
| Anomaly type | Count | Percentage | Count | Percentage |
| No Anomaly | 90844 | 54.72% | 10022 | 64.27% |
| NoBody1 | 1849 | 1.11% | 1312 | 8.41% |
| NoNose | 19307 | 11.63% | 1110 | 7.12% |
| NoNose,NoBody2 | 25206 | 15.18% | 1530 | 9.81% |
| NoNose,NoBody2, NoBody1 | 26628 | 16.04% | 1620 | 10.39% |
| NoBody2 | 1078 | 0.65% | - | - |
| NoBody2, NoBody1 | 1089 | 0.65% | - | - |
| Total | 166001 | |||
3 Data Preparation
Time Series Data Preparation We use the publicly available manufacturing dataset [Harik et al., 2024] generated by the Future Factories (FF) Lab at the McNair Aerospace Research Center at the University of South Carolina. This dataset has two versions: analog and multimodal datasets. The dataset consists of measurements using a prototype of rocket assembly pipeline [see Appendix A], which adheres to industrial standards in deploying actuators, control mechanisms, and transducers. The multimodal dataset includes synchronized images captured from two cameras positioned on opposite sides of the testbed, which continuously record the operations. It consists of 166K records throughout the entire runtime of 30 hours with a sampling rate of 1.95 Hz. The images are divided into batches of 1K samples from both camera viewpoints, with each batch having an equivalent JSON file containing synchronized sensor values and their corresponding image paths. In data preparation, data from JSON files were first converted into a tabular format, including the paths to the camera images. The data consists of 285 assembly cycles, at which one cycle represents a complete assembly and disassembly of the rocket. The rocket assembly process at the FF lab is divided into 21 distinct cycle states. Information about these cell cycle states and cycle state-wise anomaly types is not directly available in both the analog and multimodal datasets and we extracted them using a mapping function provided by domain experts. The preprocessed dataset includes measurements, such as sensor variables, conveyor variable frequency, drive temperatures, physical properties of robots (i.e., angles), conveyor workstation statistics, cycle state, cycle count, anomaly types and corresponding image file names from both cameras. In this paper, we introduce the preprocessed multimodal and analog datasets, incorporating this new information. Table 1 presents the statistics of anomalies in the preprocessed multimodal dataset used in the proposed method of this study.
ImageData Preparation We use the derived image dataset from [Prasad et al., 2024]. In this assembly pipeline, rockets and components are visible only during certain cycle states due to the positions of robots, machinery, and cameras. Using domain expertise, images from cycle four and part of cycle nine are filtered to enhance analysis and further cropped to focus on the region of interest.
4 ProblemFormulation
Consider a multimodal dataset M, comprising time series data T and corresponding image data V, collected while assembling a rocket. The dataset consists of n cycles, denoted by C = {c1, c2, . . . , cn}, where each cycle ci for i ∈ {1, 2, . . . , n} represents the complete assembly of a product. Each cycle ci is divided in to 21 distinct states, represented by S = {s1, s2, . . . , s21}. Let Vci,sj = {vci,sj,1, vci,sj,2, . . . , vci,sj,T} denote the image data for cycle ci at state sj. T comprises multivariate sensor readings at various time steps within each cycle state. Let Tci,sj = {tci,sj,1, tci,sj,2, . . . , tci,sj,T}, where tci,sj,k = (tci,sj,k,1, tci,sj,k,2, . . . , tci,sj,k,m, yci,sj,k) represents the multivariate sensor measurements at time step k for cycle ci at state sj . Here, m is the number of sensor variables, tci,sj,k,l denotes the sensor measurement for the l-th sensor variable, and yci,sj,k is the anomaly label associated with time step k. Additionally, let R = {R(1) ,R(2) , . . . ,R(m) } denote set of acceptable sensor ranges, where R(l) represents the acceptable range for the l-th sensor variable. The objective is to develop a model, F, for predicting next sensor values tci,sj,k+1 and anomaly label yci,sj,k in the next time step of the assembly process.
5 NSF-MAPMethod
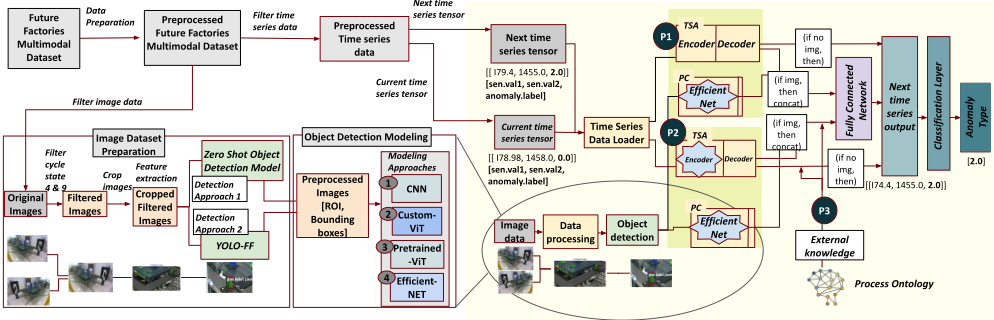
This section describes the NSF-MAP method (Figure 1), including feature extraction, fusion, and prediction approach.
https://github.com/renjithk4/AssemAI
Then, we elaborate on the formulation of the loss function and the integration of the neurosymbolic AI approach utilized in this framework.
Image and Time Series Feature Extraction
We focus on images captured at states s4 and s9, which are critical for anomaly prediction. The region of interest(rocket parts) for each image Vci,sj is identified using a bounding box Bci,sj = (xmin, ymin, xmax, ymax), which is obtained from the YOLO-FF model [Prasad et al., 2024]. Then, we use a pretrained EfficientNet model GV with the classification layer removed to extract the trained image embeddings fV as defined in equation 1.
For time series data, an autoencoder-decoder network GT is used to extract features into a latent representation fT and to reconstruct the input sequence. The encoder ET (defined in equation 2) extracts features, while the decoder PT (defined in equation 3) reconstructs the sequence.
The overall process of the autoencoder-decoder network GT can be described as in equation 4.
Decision-level Fusion and Prediction
In this approach, we integrate the features extracted from the models GT and GV . The features fV from GV and hT from GT are concatenated to form a unified feature vector z as in equation 5.
This unified feature vector z is then passed through a fully connected network H to obtain the final prediction as in equation 6.
where yci,sj,k+1 represents both the predicted sensor values ˆtci,sj,k+1 and the anomaly label ˆ yci,sj,k+1 at the next time step k+1 for cycle ci at state sj . In all other states except for states s4 and s9, the features hT from the autoencoderdecoder network are used directly for prediction as defined in equation 7.
We illustrate the decision-level fusion and prediction in Figure 1 (Method P1).
Limitations and Transfer Learning Strategy
The end-to-end training of the autoencoder-decoder may lead to overfitting, longer training times, and higher computational costs due to the decoder adapting too closely to specific time series features. To mitigate this, transfer learning [Torrey and Shavlik, 2010; Pan and Yang, 2009] is applied by freezing the encoder ET and training only the decoder RT , optimizing solely θRT . The prediction model H then utilizes features hT extracted by the fixed encoder, with fT generated accordingly. The overall objective function remains unchanged, as illustrated in Figure 1 (Method P2).
Process Ontology for Knowledge-Infusion
We design and develop Dynamic Process Ontology to support knowledge-infused learning and provide user-level explanations for model predictions. The ontology is built on the basis of 21 cycle states S = {s1, s2, . . . , s21}, capturing the temporal component of the assembly process and hence the name Process Ontology. Additionally, the ontology can be dynamically updated as per the experimentation set-up to adjust the expected minimum and maximum values of the sensor, the function of robots in the cycle states, and other information as required (example in Appendix B). The specific attributes of process ontology are as follows: (a) definitions and item specifications of each sensor and equipment, (b) relationships between the sensors and equipment, (c) function and involvement of each sensor and robot with respect to the cycle states, (d) expected (or anomalous) values of sensor variables concerning each cycle state, (e) types of anomalies that could be associated with each cycle state, and (f) sensor values and properties that can be dynamically updated as per changes in the experimental set-up.
While each sensor has possible minimum and maximum values that remain constant throughout the assembly process, the expected normal operating range varies based on the sensor's role in a given cycle state. For example, a potentiometer's expected range on robot-1 varies by cycle state. This necessitates an understanding of the relationships between cycle states, robot involvement, and corresponding sensor readings. Therefore, we gather this domain knowledge from the Process Ontology to guide the model training process. An ontology dynamically integrates sensor ranges by adapting expected values to cycle states, workload, and equipment interactions, enabling real-time reasoning and explainability beyond static thresholds. In this work, we integrated domain-specific knowledge, particularly sensor ranges R = {R(1) ,R(2) , . . . ,R(m) }, to improve the model's performance and enhance its robustness. By incorporating domain constraints into the learning process, the Knowledge Infusion approach ensures that the model generalizes beyond fixed thresholding, reduces false positives and negatives, and effectively reasons over complex multi-sensor dependencies that cannot be captured through simple thresholding alone.
https://github.com/revathyramanan/
In model training, the predictions must satisfy:
The penalty P is added in two specific scenarios, as outlined in Equation 8. A penalty is imposed when the model predicts an anomaly even though the sensor values are within the acceptable range, indicating that the model incorrectly identifies an anomaly where none exists. A penalty is also applied when the model predicts normal conditions despite the sensor values being outside the acceptable range, reflecting a failure to detect an anomaly.
where 1 is an indicator function that adds a penalty when the conditions inside it are met.
Loss Function
We employ a Weighted Mean-Squared Error (WMSE) loss function to address the class imbalance and to further differentiate between the different types of anomalies. Let w be the vector of class weights, y be the true values, and p be the predicted values, the loss function can be defined as in equation 9.
The objective is to minimize the WMSE for predicting the next sensor values and anomaly label as in equation 10.
The final predictions yci,sj,k+1 are then fed into a classification layer C, which will filter and classify the anomaly label ˆ yci,sj,k+1 into separate anomaly types (equation 11).
where ˆaci,sj,k+1 represents the predicted anomaly type at the next time step k + 1 for cycle ci at state sj. The full objective function, with the penalty, is as in equation 12.
where wi,j,l are the sample weights, λ is a hyperparameter controlling the strength of the penalty term and P is the penalty function defined above. We illustrate the knowledgeinfusion approach in Figure 1 (Method P3). The application of this ontology for providing user-level explanations is elaborated in the Results section.
6 Experiments
6.1 Common Hyperparameters and Training Setup
The dataset is split using a cycle-wise approach, ensuring 8020% and 60-40% training-testing splits while maintaining the same proportion of normal and anomalous samples in both training and testing sets. For all models, we use WMSE, tuning hyperparameters like epochs(50), batch size(32), and learning rate(0.001). The best model is saved based on validation accuracy. All the model parameters are optimized using the Adam optimizer, and the training process involves a training phase to adjust the model weights and a validation phase to monitor the model's performance on unseen data. During preprocessing, we resize the original images to 224×224 pixels and normalize them using the mean [0.485,0.456,0.406] and standard deviation [0.229,0.224,0.225]. In the following section, we describe the experimentation details of baselines in B1 and B2 and proposed methods in P1, P2, and P3, respectively.
B1:Time Series-based Autoencoder Model
The autoencoder model consists of two main components: an encoder and a decoder. The encoder is a single linear layer that compresses the input data (we use two most important sensor variables and anomaly label) into a lower-dimensional representation with a hidden size of 10, with a ReLU activation function applied to introduce non-linearity. The decoder is a single linear layer that reconstructs the original input from this compressed representation. The autoencoder aims to learn a compact representation of the input data that can effectively capture its essential features. The model optimizes the WMSE between the predicted next-time series values (sensor values and anomaly label) and the current values.
B2:Image-based EfficientNet-B0 model
We implement an EfficientNet-B0 model [Tan and Le, 2019] on the preprocessed images for an anomaly detection task, initially pre-trained on the ImageNet dataset. We adapt the model by modifying the final classification layer to align with the number of classes in our image dataset (five classes).
P1: Decision Level Fusion
(DLF) (Figure 1: P1) The autoencoder model is designed with an encoder that takes an input dimension of 3, a hidden dimension of 64, and a latent dimension of 128. It utilizes the ReLU activation function. The decoder receives the latent dimension of 128 and reconstructs the subsequent time series data with an output dimension of 3, also employing the ReLU activation function. The EfficientNet-B0 model is pretrained and modified by removing its final classification layer. This alteration allows its features to be concatenated with the latent features from the time series before being passed to a fully connected layer with an output dimension of 3. The concatenated output of autoencoder and EfficientNet-B0 is fed to a fully connected layer, which has a dropout rate of 0.5 for regularization. The model aims to predict the next time series data with an output dimension of 3. A ReduceLROnPlateau scheduler adjusts the learning rate based on validation loss, with a patience of 5 epochs. Early stopping is implemented to prevent overfitting, with the best model saved based on the lowest validation loss.
P2: Decision Level Fusion with Transfer Learning
(DLF+TL)(Figure 1: P2) The hyperparameters of autoencoder and EfficientNet-B0, training process, and loss function will be the same as in the P1. The encoder is frozen to disable gradient updates for the encoder parameters.
P3: Enhanced Decision-Level Fusion with Transfer Learning through Neurosymbolic AI
(DLF+TL+KIL) (Figure 1: P3) The hyperparameters, training process, and loss function for the autoencoder and EfficientNet-B0 remain consistent with those in P1. In this proposed approach, we implement a custom loss function to P2 that includes WMSE loss with an additional penalty, as explained in the Methodology section.
7 Results
Table 2 summarizes the results of our experiments on the test set and the ablation studies across different baselines. We evaluate the performance using four metrics: weighted averages of precision, recall, F1-score, and accuracy. The weighted averages are calculated based on the six types of anomaly classes and the normal class. In the 80-20% split, the Decision-Level Fusion model achieves an overall accuracy of 72%, with a precision of 76.05%, a recall of 72%, and an F1-score of 72.03%. With the inclusion of Transfer learning module, the accuracy and the F1 score increased by 39% and 45%, respectively. Similarly, infusion of knowledge on sensors enhanced the accuracy and the F1 score by 47% and 52%, respectively. Figure 2 depicts the performance of detecting various anomaly types and the normal class across various modeling approaches. It can be observed that among all the models, Decision level fusion with transfer learning and knowledge-infused learning approach gives the best results in detecting five out of seven types of classes. Figure 3 presents the comparison of performance metrics for different models under the two training-testing split scenarios (80%- 20% and 60%-40%), demonstrating the effectiveness of the proposed approach against baseline models.
7.1 Process Ontology for User-level Explainability
Dynamic Process Ontology is utilized to provide user-level explanations for the outputs generated by the model. The model predicts the values of the sensors before passing them on to the classification layer. In both scenarios, whether an anomaly is present or not, the variable values predicted by the models can be used to explain the anomaly predicted by the model. For example, if a value for variable-1 is predicted to be 3000 in cycle state 4, where its expected values are supposed to be 6000 to 8000, the anomaly can be Models Models explained as follows: (i) which variable is responsible for the anomaly? (ii) what were the function of the robots during that state? (iii) what are the expected values of that variable in that state? The ontology can also capture misclassification in certain scenarios. If the model predicted the anomaly type to be "NoNose" in cycle state 4, it can be observed from ontology that "NoNose" anomaly happens only from cycle state 8. Similarly, if all the variables are predicted to be within the expected range for a given cycle state and the model predicted still predicted them as anomaly; these misclassifications can be identified by the ontology. To summarize, the ontology serves as a knowledge-infusion and an explainability tool along with serving as a mechanism to identify misclassifications in certain cases if at all those were missed by the model.
| B1 | B2: *D | DLF (P1) | DLF (TS+ zero tensor image) | DLF+TL (P2) | DLF+ KIL | DLF+TL+ KIL(P3) | B1 | B2: *D | DLF (P1) | DLF (TS+ zero tensor image) | DLF+TL (P2) | DLF+ KIL | DLF+TL+ KIL(P3) | |
|---|---|---|---|---|---|---|---|---|---|---|---|---|---|---|
| 80% | 20% | Split | 60% | 40% | Split | |||||||||
| Weighted Avg. Precision | 74.00± 1.00% | 97.00± 1.05% | 76.05± 2.00% | 80.00± 1.00% | 91.00± 0.05% | 93.00± 1.00% | 94.00± 1.00% | 64.00± 1.00% | 87.00 ±1.05% | 66.05 ±2.00% | 70.00 ±1.00% | 81.00 ±0.05% | 83.00 ±1.00% | 84.00 ±1.00% |
| Weighted Avg. Recall | 63.00± 1.00% | 97.00± 0.5% | 72.00± 1.70% | 64.00± 0.5% | 88.02± 0.05% | 90.00± 0.05% | 93.00± 0.75% | 53.00 ±1.00% | 87.00 ±0.5% | 62.00 ±1.70% | 60.00 ±0.5% | 80.00 ±0.05% | 80.00 ±0.05% | 83.00 ±0.75% |
| Weighted Avg. F1-Socre | 61.00± 1.00% | 97.00± 1.00% | 72.03± 2.05% | 64.00± 0.5% | 89.00± 0.05% | 91.00± 0.05% | 93.00± 0.05% | 51.00 ±1.00% | 87.00 ±1.00% | 64.00 ±0.5% | 58.00 ±0.5% | 81.00 ±0.05% | 81.00 ±0.05% | 83.00 ±0.05% |
| Weighted Avg. Accuracy | 63.00± 1.00% | 97.00± 1.00% | 72.00± 2.00% | 64.00± 0.05% | 88.00± 0.05% | 90.00± 0.05% | 93.00± 1.00% | 53.00 ±1.00% | 87.00 ±1.00% | 64.00 ±0.05% | 58.00 ±0.05% | 80.00 ±0.05% | 80.00 ±0.05% | 83.00 ±1.00% |
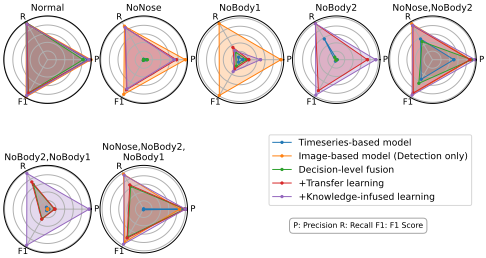
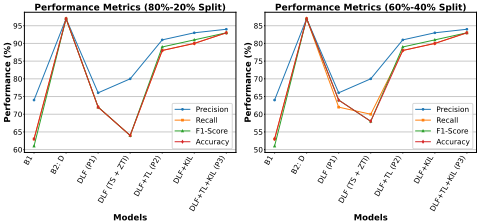
Figure 3: Performance of the Proposed Approach and Baselines with Varied Training and Testing Splits. ZTI: Zero Tensor Image
8 Deployment of NSF-MAP
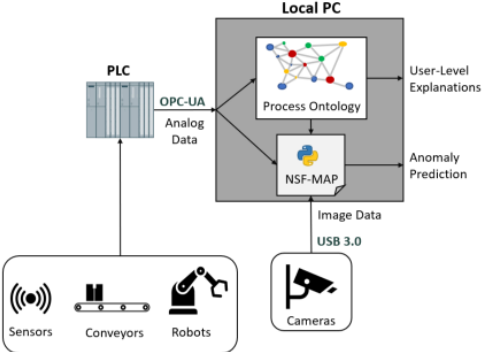
We deploy the NSF-MAP and process ontology at the FF testbed at the McNair Center, University of South Carolina. The deployment strategy of this model consists of two main parts (See deployment setup in Appendix C]). First, it requires establishing connections between the trained model, ontology, and the system. This includes real-time data retrieval through an Open Platform Communications Unified Architecture (OPC-UA) server on the system's Programmable Logic Controller (PLC) and accessing analog data via an OPC client script. Additionally, cameras around the system provide necessary images, accessed using custom Python libraries, Pyplon and ImageCap. Second, the internal pipeline is created to integrate the ontology and NSF-MAP. Data from the OPC-UA server is ingested into a process ontology, running on a local Neo4j server via Docker, to generate user-level explanations. These explanations and the corresponding images and analog data are then fed into NSF-MAP for real-time anomaly prediction. We face several challenges in deployment, which have been explained in Appendix C].
9 Conclusion and FurtherWork
In this study, we derived industry-standard datasets tailored for analog and multimodal assembly processes. We developed a novel methodology for robust and interpretable anomaly prediction using neurosymbolic multimodal fusion. Our findings indicate that the time-series-image fusion model incorporated with a neurosymbolic AI approach offers significant improvements over traditional methods. Future work will explore hybrid architectures that integrate additional modalities, such as text, with advanced interpretability methods for real-time anomaly prediction. We also plan to extend the process ontology by incorporating images aligned via techniques like dynamic time warping, change-point detection, or saliency analysis. To enhance expert understanding, we propose generating abstract representations of causal factors linked to anomalies for a more holistic interpretation of anomalous events.
A Future Factories Setup
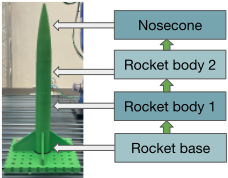
Figure 4 includes an image of a rocket assembled by FF Lab.
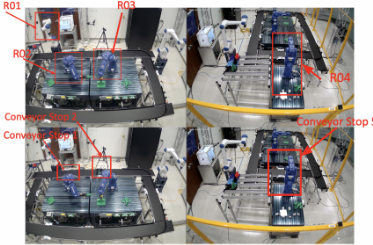
A visual representation of the lab setup is shown in Figure 5.
B Experiments with the Process Ontology
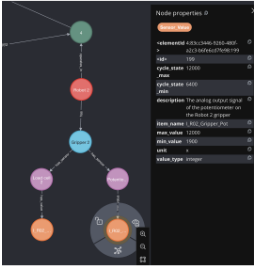
A snapshot of the ontology for a given cycle state is given in Figure 6.
C Deployment of NSF-MAP and Challenges Faced
Figure 7 illustrates the architecture for real-time deployment of the NSF-MAP model and process ontology onto the manufacturing system. It highlights integrating the trained model with the OPC-UA server for data retrieval and the connection to cameras for image acquisition, enabling seamless real-time predictions on the FF testbed. The inference code, user interface code for deployment, and the demo of deployment are included in the supplementary files.
During the deployment of NSF-MAP in the real-world manufacturing environment at the FF lab, several challenges arise that require careful management. One of the primary concerns is adapting the code to align with the format of the input data stream, which includes both time series and image data, to ensure seamless integration and functionality. Integrating the cameras with the local PC, where the process ontology and NSF-MAP are deployed, presents an additional effort. A significant challenge is the discrepancy in the sampling rates between the OPC server and the data set used for training, necessitating efforts to synchronize these rates. Additionally, the data used for the current deployment were collected eight months prior, which may lead to slight differences in the sensor data ranges. As a result, considerable effort is devoted to adjusting and fine-tuning the code to accommodate the new data stream. The simulation of anomalies presents another challenge, as accurately replicating realworld scenarios proves difficult. Furthermore, the selection of appropriate robots and sensor values for testing, particularly in conjunction with simulated anomalies, is a task that requires close collaboration with domain specialists from the FF lab. Despite these challenges, the combined efforts and expertise of all stakeholders facilitate the successful resolution of these issues, thereby contributing to the advancement and refinement of NSF-MAP's deployment in the manufacturing environment.
Ethical Statement
There are no ethical issues.
Acknowledgments
This work is supported in part by the NSF grant #2119654, "RII Track 2 FEC: Enabling Factory to Factory (F2F) Networking for Future Manufacturing".
Contribution Statement
∗Chathurangi Shyalika and Renjith Prasad contributed equally to this work. †Chathurangi Shyalika is the corresponding author of this work.
@inproceedings{ijcai2025p1037,
  title     = {NSF-MAP: Neurosymbolic Multimodal Fusion for Robust and Interpretable Anomaly Prediction in Assembly Pipelines},
  author    = {Shyalika, Chathurangi and Prasad, Renjith and El Kalach, Fadi and Venkataramanan, Revathy and Zand, Ramtin and Harik, Ramy and Sheth, Amit},
  booktitle = {Proceedings of the Thirty-Fourth International Joint Conference on
               Artificial Intelligence, {IJCAI-25}},
  publisher = {International Joint Conferences on Artificial Intelligence Organization},
  editor    = {James Kwok},
  pages     = {9330--9338},
  year      = {2025},
  month     = {8},
  note      = {AI4Tech: AI Enabling Technologies},
  doi       = {10.24963/ijcai.2025/1037},
  url       = {https://doi.org/10.24963/ijcai.2025/1037},
}
TY - CPAPER TI - NSF-MAP: Neurosymbolic Multimodal Fusion for Robust and Interpretable Anomaly Prediction in Assembly Pipelines AU - Shyalika, Chathurangi AU - Prasad, Renjith AU - El Kalach, Fadi AU - Venkataramanan, Revathy AU - Zand, Ramtin AU - Harik, Ramy AU - Sheth, Amit T2 - Proceedings of the Thirty-Fourth International Joint Conference on Artificial Intelligence, IJCAI-25 PB - International Joint Conferences on Artificial Intelligence Organization PY - 2025 SP - 9330 EP - 9338 DO - 10.24963/ijcai.2025/1037 UR - https://doi.org/10.24963/ijcai.2025/1037 ER -Copied
Machine-readable versions of this paper, for tools and AI agents:





