
Early Detection of Patient Deterioration from Real-Time Wearable Monitoring System
Proceedings of the Thirty-Fourth International Joint Conference on Artificial Intelligence. AI and Social Good. Pages 9871-9879.
https://doi.org/10.24963/ijcai.2025/1097
Keywords
- Data Mining: General
- Knowledge Representation and Reasoning: General
Abstract
Early detection of patient deterioration is crucial for reducing mortality rates. Heart rate data has shown promise in assessing patient health, and wearable devices offer a cost-effective solution for real-time monitoring. However, extracting meaningful insights from diverse heart rate data and handling missing values in wearable device data remain key challenges. To address these challenges, we propose TARL, an innovative approach that models the structural relationships of representative subsequences, known as shapelets, in heart rate time series. TARL creates a shapelet-transition knowledge graph to model shapelet dynamics in heart rate time series, indicating illness progression and potential future changes. We further introduce a transition-aware knowledge embedding to reinforce relationships among shapelets and quantify the impact of missing values, enabling the formulation of comprehensive heart rate representations. These representations capture explanatory structures and predict future heart rate trends, aiding early illness detection. We collaborate with physicians and nurses to gather ICU patient heart rate data from wearables and diagnostic metrics to assess illness severity and evaluate deterioration. Experiments on real-world ICU data demonstrate that TARL achieves both high reliability and early detection. A case study further showcases TARL's explainable detection process, highlighting its potential as an AI-driven tool to assist clinicians in recognizing early signs of patient deterioration.
- [Alshwaheen et al., 2021] Tariq I. Alshwaheen, Yuan Wen Hau, Nizar Ass'Ad, and Mahmoud M. Abualsamen. A novel and reliable framework of patient deterioration pre- diction in intensive care unit based on long short-term memory-recurrent neural network. IEEE Access, 9:3894- 3918, 2021.
- [Ashrafi et al., 2024] Negin Ashrafi, Yiming Liu, Xin Xu, Yingqi Wang, Zhiyuan Zhao, and Maryam Pishgar. Deep learning model utilization for mortality prediction in me- chanically ventilated icu patients. Informatics in Medicine Unlocked, 49:101562, 2024.
- [Boussina et al., 2024] Aaron Boussina, Supreeth P Shashikumar, Atul Malhotra, Robert L Owens, Robert El-Kareh, Christopher A Longhurst, Kimberly Quintero, Allison Donahue, Theodore C Chan, Shamim Nemati, et al. Impact of a deep learning sepsis prediction model on quality of care and survival. npj Digital Medicine, 7(1):14, 2024.
- [Chen and Guestrin, 2016] Tianqi Chen and Carlos Guestrin. Xgboost: A scalable tree boosting system. Proceedings of the 22nd ACM SIGKDD International Conference on Knowledge Discovery and Data Mining, 2016.
- [Cheng et al., 2019] Ziqiang Cheng, Yang Yang, Wei Wang, Wenjie Hu, Yueting Zhuang, and Guojie Song. Time2graph: Revisiting time series modeling with dy- namic shapelets. In AAAI Conference on Artificial Intel- ligence, 2019.
- [Churpek et al., 2016] Matthew M. Churpek, Blair Wend- landt, Frank J Zadravecz, Richa Adhikari, Christopher J. Winslow, and Dana P. Edelson. Association between in- tensive care unit transfer delay and hospital mortality: A multicenter investigation. Journal of hospital medicine, 11 11:757-762, 2016.
- [El-Rashidy et al., 2020] Nora El-Rashidy, Shaker El- Sappagh, Tamer Abuhmed, Samir Abdelrazek, and Hazem M. El-Bakry. Intensive care unit mortality pre- diction: An improved patient-specific stacking ensemble model. IEEE Access, 8:133541-133564, 2020.
- [Godinjak et al., 2016] Amina Godinjak, Amer Iglica, Ad- mir Rama, Ira Tančica, Selma Jusufović, Anes Ajanović, and Adis Kukuljac. Predictive value of saps ii and apache ii scoring systems for patient outcome in a medical intensive care unit. Acta medica academica, 45 2:97-103, 2016.
- [Grabocka et al., 2014] Josif Grabocka, Nicolas Schilling, Martin Wistuba, and Lars Schmidt-Thieme. Learning time-series shapelets. Proceedings of the 20th ACM SIGKDD international conference on Knowledge discov- ery and data mining, 2014.
- [Grand View Research, 2023] Grand View Research. Wear- able technology market size, share and trends anal- ysis report by product (head and eyewear, wrist- wear), by application (consumer electronics, healthcare), by region (asia pacific, europe), and segment fore- casts, 2023 -2030. https://www.grandviewresearch.com/ industry-analysis/wearable-technology-market, 2023. Link
- [Gupta et al., 2020a] Ashish Gupta, Hari Prabhat Gupta, Bhaskar Biswas, and Tanima Dutta. Approaches and ap- plications of early classification of time series: A review. IEEE Transactions on Artificial Intelligence, 1(1):47-61, 2020.
- [Gupta et al., 2020b] Ashish Gupta, Hari Prabhat Gupta, Bhaskar Biswas, and Tanima Dutta. An early classification approach for multivariate time series of on-vehicle sensors in transportation. IEEE Transactions on Intelligent Trans- portation Systems, 21:5316-5327, 2020.
- [Gupta et al., 2021] Ashish Gupta, Hari Prabhat Gupta, Bhaskar Biswas, and Tanima Dutta. A fault-tolerant early classification approach for human activities using multi- variate time series. IEEE Transactions on Mobile Com- puting, 20:1747-1760, 2021.
- [Hicks et al., 2019] Jennifer L. Hicks, Tim Althoff, Rok Sosič, Peter Kuhar, Bojan Bostjancic, Abby C. King, Jure Leskovec, and Scott L. Delp. Best practices for analyz- ing large-scale health data from wearables and smartphone apps. NPJ Digital Medicine, 2, 2019.
- [Hyland et al., 2020] Stephanie L Hyland, Martin Faltys, Matthias Hüser, Xinrui Lyu, Thomas Gumbsch, Cristóbal Esteban, Christian Bock, Max Horn, Michael Moor, Bas- tian Rieck, et al. Early prediction of circulatory failure in the intensive care unit using machine learning. Nature medicine, 26(3):364-373, 2020.
- [Kia et al., 2020] Arash Kia, Prem Timsina, Himanshu N Joshi, Eyal Klang, Rohit R Gupta, Robert M Freeman, David L Reich, Max S Tomlinson, Joel T Dudley, Roopa Kohli-Seth, et al. Mews++: enhancing the prediction of clinical deterioration in admitted patients through a machine learning model. Journal of clinical medicine, 9(2):343, 2020.
- [Knaus et al., 1985] William Knaus, E.A. Draper, D.P. Wag- ner, and J.E. Zimmerman. Apache ii: a severity of disease classification system. Critical care medicine, 13:818-29, 11 1985.
- [Li et al., 2020] Dingwen Li, Patrick G. Lyons, Chenyang Lu, and Marin H. Kollef. Deepalerts: Deep learning based multi-horizon alerts for clinical deterioration on oncology hospital wards. In AAAI Conference on Artificial Intelli- gence, 2020.
- [Li et al., 2022] Guozhong Li, Byron Choi, Jianliang Xu, Sourav S. Bhowmick, Kwok-Pan Chun, and Grace L.H. Wong. Efficient shapelet discovery for time series classifi- cation. IEEE Transactions on Knowledge and Data Engi- neering, 34:1149-1163, 2022.
- [Lines et al., 2012] Jason Lines, Luke M. Davis, Jon Hills, and A. Bagnall. A shapelet transform for time series classi- fication. In Knowledge Discovery and Data Mining, 2012.
- [Lv et al., 2019] Junwei Lv, Xuegang Hu, Lei Li, and Peipei Li. An effective confidence-based early classification of time series. IEEE Access, 7:96113-96124, 2019.
- [Onwuchekwa et al., 2024] Jennifer I Daniel Onwuchekwa, Daniel Claus, Christian Weber, and Maria Maleshkova. Enhanced predictive monitoring of hypoglycemia in type 1 diabetes using shapelet-based analysis of wearable sensor data. In 2024 IEEE 12th International Conference on Se- rious Games and Applications for Health (SeGAH), pages 1-8. IEEE, 2024.
- [Paganelli et al., 2022] Antonio Iyda Paganelli, Pe- dro Elkind Velmovitsky, Adriano Branco, Markus Endler, Plinio Pelegrini Morita, Paulo S. C. Alencar, and Donald D. Cowan. A novel self-adaptive method for im- proving patient monitoring with composite early-warning scores. 2022 IEEE International Conference on Big Data (Big Data), pages 201-208, 2022.
- [Romero-Brufau et al., 2021] Santiago Romero-Brufau, Daniel Whitford, Matthew G Johnson, Joel Hickman, Bruce W Morlan, Terry Therneau, James Naessens, and Jeanne M Huddleston. Using machine learning to improve the accuracy of patient deterioration predictions: Mayo clinic early warning score (mc-ews). Journal of the Amer- ican Medical Informatics Association, 28(6):1207-1215, 2021.
- [Rose et al., 2015] Melody A Rose, Lee Ann Hanna, Sareda A. Nur, and Constance M. Johnson. Utilization of electronic modified early warning score to engage rapid response team early in clinical deterioration. Journal for Nurses in Professional Development, 31:E1-E7, 2015.
- [Saif et al., 2024] Dina Saif, Amany M Sarhan, and Nada M Elshennawy. Early prediction of chronic kidney disease based on ensemble of deep learning models and optimiz- ers. Journal of electrical systems and information technol- ogy, 11(1):17, 2024.
- [Saleh et al., 2024] Shawki Saleh, Bouchaib Cherradi, Ous- sama El Gannour, Soufiane Hamida, and Omar Bouattane. Predicting patients with parkinson's disease using machine learning and ensemble voting technique. Multimedia Tools and Applications, 83(11):33207-33234, 2024.
- [Salehinejad et al., 2023] Hojjat Salehinejad, Anne M Mee- han, Pedro J Caraballo, and Bijan J Borah. Contrastive transfer learning for prediction of adverse events in hospi- talized patients. IEEE Journal of Translational Engineer- ing in Health and Medicine, 2023.
- [Schäfer and Leser, 2019] Patrick Schäfer and Ulf Leser. Teaser: early and accurate time series classification. Data Mining and Knowledge Discovery, pages 1-27, 2019.
- [Shaffer and Ginsberg, 2017] Fred Shaffer and J P Ginsberg. An overview of heart rate variability metrics and norms. Frontiers in Public Health, 5, 2017.
- [Shah et al., 2021] Parth K Shah, Jennifer C Ginestra, Lyle H Ungar, Paul Junker, Jeff I Rohrbach, Neil O Fishman, and Gary E Weissman. A simulated prospective evaluation of a deep learning model for real-time prediction of clinical deterioration among ward patients. Critical care medicine, 49(8):1312-1321, 2021.
- [Shamout et al., 2020] Farah E. Shamout, Tingting Zhu, Pulkit Sharma, Peter J. Watkinson, and David A. Clifton. Deep interpretable early warning system for the detection of clinical deterioration. IEEE Journal of Biomedical and Health Informatics, 24:437-446, 2020.
- [Steinberg et al., 1994] Jonathan S Steinberg, Judith S. Hochman, Christopher D. Morgan, Paul Dorian, C. David Naylor, Pierre Théroux, Eric J. Topol, and Paul W. Arm- strong. Effects of thrombolytic therapy administered 6 to 24 hours after myocardial infarction on the signal- averaged ecg: Results of a multicenter randomized trial. Circulation, 90:746-752, 1994.
- [Tonekaboni et al., 2019] Sana Tonekaboni, Shalmali Joshi, Melissa D. McCradden, and Anna Goldenberg. What clin- icians want: Contextualizing explainable machine learning for clinical end use. In Machine Learning in Health Care, 2019.
- [Wu et al., 2021] Renjie Wu, Audrey Der, and Eamonn J Keogh. When is early classification of time series mean- ingful? IEEE Transactions on Knowledge and Data Engi- neering, 35(3):3253-3260, 2021.
- [Xing et al., 2012] Zhengzheng Xing, Jian Pei, and Philip S. Yu. Early classification on time series. Knowledge and Information Systems, 31:105-127, 2012.
- [Yan et al., 2020] Wenhe Yan, Guiling Li, Zongda Wu, Sen- zhang Wang, and Philip S. Yu. Extracting diverse- shapelets for early classification on time series. World Wide Web, pages 1-27, 2020.
- [Yang et al., 2014] Bishan Yang, Wen tau Yih, Xiaodong He, Jianfeng Gao, and Li Deng. Embedding entities and re- lations for learning and inference in knowledge bases. CoRR, abs/1412.6575, 2014.
- [Ye and Keogh, 2009] Lexiang Ye and Eamonn J. Keogh. Time series shapelets: a new primitive for data mining. In Knowledge Discovery and Data Mining, 2009.
- [Zhao et al., 2019] Lei Zhao, Huiying Liang, Daming Yu, Xinming Wang, and Gansen Zhao. Asynchronous mul- tivariate time series early prediction for icu transfer. In Proceedings of the 2019 International Conference on In- telligent Medicine and Health, pages 17-22, 2019.
- [Zhu and Hill, 2021] Lipeng Zhu and David Hill. Networked time series shapelet learning for power system transient stability assessment. IEEE Transactions on Power Sys- tems, 2021.
References were extracted automatically from the PDF and may contain errors.
Full text extracted automatically from the PDF; figures, tables and equations may differ. The PDF is the version of record.
1 Introduction
Identifying patients at high risk of deterioration is a crucial issue in intensive care units (ICUs). ICUs specialize in treating severely ill patients with more resources and a higher nurseto-patient ratio than general wards. However, ICU patients can deteriorate rapidly, and unnoticed changes may delay critical treatments or transfers. Each hour of delay can increase mortality odds by 3% [Churpek et al., 2016], and deaths may occur during such transitions. These challenges highlight the necessity for automated systems that aid clinicians in the early identification of patient deterioration, thereby facilitating prompt interventions and decreasing mortality rates.
Previous research [Shaffer and Ginsberg, 2017] has identified patient's heart rate data as a key indicator of inflammation, which is associated with various chronic diseases in adult ICU patients. This implies that consistently monitoring heart rate could be promising for the early identification of patient deterioration. Nonetheless, equipment for ICU monitoring can be expensive and difficult to obtain. Wearable devices provide a cheaper option for ongoing vital sign monitoring, particularly in settings where resources are limited. Grand View Research [Grand View Research, 2023] valued the wearable technology market at USD 61.30 billion in 2022, emphasizing its growing potential to enhance patient care via real-time monitoring and early intervention.
Meanwhile, ensuring that AI models provide justifiable outcomes is crucial for clinical decision-making. AI models need to deliver justifiable outcomes to help clinicians assess patient conditions and guide trusted treatment decisions [Tonekaboni et al., 2019]. In this context, heart rate time series data offers a rich source of information for identifying critical health patterns. A promising method for examining heart rate time series is shapelet-based analysis, which has shown effectiveness in multiple fields [Zhu and Hill, 2021; Li et al., 2022]. A Shapelet [Ye and Keogh, 2009] refers to a time-series subsequence recognized as a characteristic waveform designed to offer clear explanatory insights into time series data.
However, two main challenges remain in analyzing patient heart rates to detect patient illness deterioration through wearable devices. (i) First, heart rate variations are complex and differ among patients, making it difficult to effectively capture explanatory insights from shapelets within diverse heart rate time series data. (ii) Second, data collected by wearable devices often have a high rate of missing values [Hicks et al., 2019], which can hinder heart rate analysis. Directly discarding incomplete data may also result in significant information loss. Addressing these challenges is essential for improving the reliability and effectiveness of AI-driven systems for the early detection of illness deterioration.
Therefore, to address these challenges, we propose TARL (Transition-Aware Representation Learning), a novel approach that integrates shapelet-based knowledge representation while accounting for missing values. To tackle the first challenge, we construct a shapelet-transition knowledge graph from patients' heart rate time series collected from wearable devices. This graph captures the occurrence order of shapelets, preserving their sequential patterns to represent patient illness progression and potential future changes. We then introduce a novel transition-aware knowledge embedding to learn shapelet representations, using an attention mechanism to reinforce the relative structure of shapelets. Additionally, we incorporate transition confidence to quantify the impact of missing values during embedding learning, ensuring robustness against incomplete data. This specifically addresses the second challenge.
Finally, the learned shapelet representations are used to formulate patient heart rate representations, which embed the explanatory structure of shapelets, potential future heart rate changes, and the impact of missing values. These representations enable early detection of deterioration based on observed shapelet transitions in newly received heart rate data, making the detection process explainable.
To ensure that TARL can effectively assist clinicians in clinical practice, we collaborate with physicians and nurses at the hospital to collect IC patient heart rate data using wearable devices. Also, we collect patients' laboratory test results and diagnostic metrics to estimate Apache II scores (Acute Physiology and Chronic Health Evaluation II) [Knaus et al., 1985], a widely used indicator of illness severity that serves as ground truth for evaluating patient deterioration in this paper. Our method is assessed through real-world ICU patient data, measuring deterioration detection accuracy and earliness to ensure its reliability and impact on assisting clinicians. The interdisciplinary research effort integrates AI researchers, clinicians, and nursing staff, using low-cost wearables and an effective model to strengthen hospital monitoring infrastructure. It has the potential to address the needs of frontline clinicians, supports faster interventions for ICU patients, and offers evidence hospitals can use to improve their triage process.
2 RelatedWorks
Early Detection of Patient Deterioration. Several studies have explored various methodologies for predicting ICU admission, early diagnosis of specific diseases, and mortality risk. These methods include deep learning [Li et al., 2020; Shamout et al., 2020; Shah et al., 2021; Salehinejad et al., 2023; Ashrafi et al., 2024; Boussina et al., 2024], ensemblebased methods [El-Rashidy et al., 2020; Alshwaheen et al., 2021; Saleh et al., 2024; Saif et al., 2024], and detection based on early warning scores [Paganelli et al., 2022; Kia et al., 2020; Romero-Brufau et al., 2021]. Some approaches leverage interpretable patterns, such as shapelets, to extract critical patient information [Zhao et al., 2019; Hyland et al., 2020; Onwuchekwa et al., 2024]
Early Time-Series Classification. Early time-series classification methods can be categorized into three groups: prefixbased, model-based, and shapelet-based. Prefix-based methods determine the minimum prefix length (MPL) required for classification by learning from training instances and applying the learned prefix length to test data. Xing et al. first introduce MPL and propose ECTS (early classification on time series) [Xing et al., 2012]. Other works focus on estimating the Minimum Required Length (MRL) for early classification [Gupta et al., 2020b; Gupta et al., 2021]. Various issues are discussed in [Wu et al., 2021]. Model-based methods use mathematical models to balance earliness and accuracy [Lv et al., 2019; Sch¨afer and Leser, 2019]. Shapelet-based methods extract key shapelets to enable reliable label prediction for incomplete time series [Yan et al., 2020].
Although these methods perform well in their respective settings, they often overlook the structural relationships among time-series patterns and how they evolve over time. While some utilize predefined shapelet extraction, they fail to capture shapelet dependencies and transition dynamics, limiting their ability to model temporal progression. This is particularly critical in early detection of patient deterioration, where understanding patients' condition transitions is essential for early and accurate illness deterioration detection.
3 Preliminary
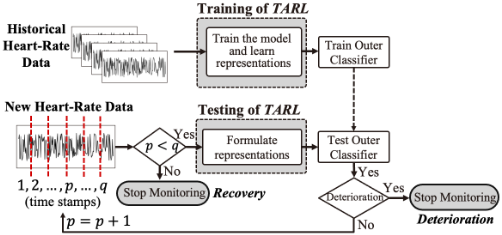
Figure 1 illustrates the proposed real-time wearable monitoring system. During TARL's training, historical heart-rate data from wearable devices are acquired. As monitoring continues, new heart-rate data arrive at fixed intervals until the patient is identified as deteriorating or receives a confirmed diagnosis. TARL focuses on developing reliable heart-rate representations to identify early deterioration symptoms, serving as features for early detection classification models.
Definition 1 (Historical Data): Historical data from all patients is denoted as X, where each X ∈ X represents a patient's heart rate time series, expressed as X = {x1, ..., x|X|}. Each x ∈ R+ is a heart rate data point arranged chronologically. Wearable device data may contain many missing values. To handle missing values in wearable device data, we apply linear interpolation to complete X.
Definition 2 (Deterioration Label): For each heart rate time series X ∈ X measured from a patient, a deterioration label ˆlX ∈ {1, 0} is assigned, where ˆlX = 1 denotes that the patient's condition is deteriorating, and ˆlX = 0 denotes improvement or recovery.
In our setting, deterioration labels (Def. 2) are derived from each patient's Apache II score (Acute Physiology and Chronic Health Evaluation II) [Knaus et al., 1985], a severity-of-illness indicator computed from various diagnostic metrics, including age, medical history, respiratory rate, white blood cell count, Glasgow Coma Scale, etc. Following [Godinjak et al., 2016], we partition Apache II scores into four illness levels: 0-9, 10-19, 20-29, and above 30, with higher levels indicating greater severity and mortality risk. An increase in level indicates deterioration, and a decrease signifies recovery. Thus, if a patient's illness level computed at the time of the last heat rate data point in X exceeds that at the first, the label ˆlX is set to 1; otherwise, it is set to 0.
Problem Statement: At each time step p, given historical data X, corresponding deterioration labels {ˆlX|X ∈ X}, and a newly received heart rate time series X′1:p = {x1, x2, ..., xp} measured from a patient from time step 1 to p, our goal is to detect early whether X′1:p belongs to a deteriorating patient. The detected label is denoted by lX′1:p ∈ {0, 1}. Let the clinicians' diagnosis for X′ be determined at time step q (when ˆlX′ is obtained). A deterioration detection is considered successful if lX′1:p = ˆlX′ = 1 and p < q. The smaller the time gap between detection and diag-
nosis, the more timely and effective the detection.
4 The TARL Framework
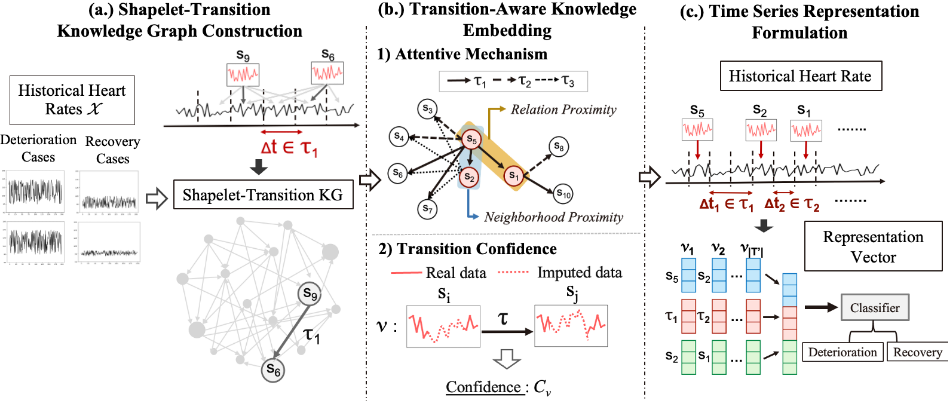
The architecture of TARL is illustrated in Figure 2. It comprises three main components: capturing patient illness progression using a shapelet-transition knowledge graph (Sec. 4.1), introducing a transition-aware knowledge embedding (Sec. 4.2) to formulate heart rate representations (Sec. 4.3), and using these representations as features for early illness deterioration detection.
4.1 Shapelet-Transition Knowledge Graph Construction
To provide a more explainable detection process, we capture explanatory insights from shapelets in patients' heart rate data. Specifically, we seek to understand which shapelets appear during a patient's deterioration process and how they evolve over time. The occurrence order and time intervals of shapelets in heart rate series are crucial for understanding heart rate dynamics and patient condition progression. We first define key shapelets and their relations as follows.
Definition 3 (Key Shapelet): The set of key shapelets is denoted as S = {s1, s2, ...}. Each shapelet s ∈ Rk represents k continuous heart rate values obtained from historical heart rate data X (Def. 1) using the shapelet discovery method [Grabocka et al., 2014].
Definition 4 (Relation): A relation set is denoted as T = {τ1, τ2, ...}, where each τ represents a specific range of time intervals between consecutive shapelet occurrences in a heart rate time series. In this work, we define the time interval as 30 minutes, meaning τ1 corresponds to 0-30 minutes, τ2 to 30-60 minutes, and so on.
With defined key shapelets and relations, we formulate the shapelet-transition knowledge graph to model illness progression in heart rate data.
Definition 5 (Shapelet-Transition Knowledge Graph): A shapelet-transition knowledge graph (abbreviated as shapelet-transition KG) is defined as G = {(s, τ, s′ )|s, s′ ∈ S, τ ∈ T }, where S is the key shapelet set, and T is the relation set. Each triplet structure (s, τ, s′ ) represents a transition from shapelet s to s′ in a heart rate time series.
The example of constructing shapelet-transition KG is shown in Figure 2a. Shapelets s9 and s6 are identified in a heart rate time series, with a time interval corresponding to relation τ1. This forms the triplet (s9, τ1, s6), and all such triplets extracted from historical heart rate data collectively form the shapelet-transition KG. To determine whether a shapelet s ∈ S are identified in a heart rate time series X ∈ X , we use a matching process: s is considered a match if its the Euclidean distance between to a segment v in X is below a fixed threshold.
4.2 Transition-Aware Knowledge Embedding
We propose a method to embed transition relations among shapelets for heart rate time series representation. To enhance representation reliability, we incorporate an attentive mechanism to reinforce shapelet structure and quantify the impact of missing values through considering transition confidence.
Attentive Mechanism
For a target shapelet n, its neighbor m should be closer in the embedded space if they share similar structural information, indicating that shapelet m has a higher impact on shapelet n. Inspired by the attention mechanism commonly used in neural networks to emphasize important features, we design an attentive mechanism to estimate neighbor impact based on the structural equivalence on shapelet-transition KG and enhance representation by aggregating neighbor embeddings. Given a triplet (si, τ, sj) in the KG G, we use neighborhood and relation proximity to enhance representations.
Neighborhood Proximity. If si and sj are often followed by similar shapelets in G, they likely cause similar heart rate variations in patients' time series, so their embeddings should be similar. Formally, let Si,∗ and Sj,∗ be the outgoing neighbors of si and sj, respectively, and let vtS⟩,∗ ∈ Rd and vtSi,∗ ∈ Rd be the average embeddings of shapelets in Si,∗ and Sj,∗ at training epoch t, where d is the embedding dimension. The neighborhood proximity between si and sj is:
where the function jac(Si,∗, Sj,∗) computes the Jaccard similarity between two sets, and cos(vtSi,∗ , vtSj,∗ ) measures the cosine similarity of their neighborhood embeddings. jac(·, ·) captures the structural similarity of si and sj, whereas cos(·, ·) reflect their embeddings similarity.
Relation Proximity. Unlike neighborhood proximity, relation proximity is determined by outgoing relations. If si and sj typically transition within shorter time intervals, they are likely associated with rapid heart rate changes, and their embeddings should be similar. Given relations sets Ti,∗ and Tj,∗, representing the outgoing relations of si and sj, respectively, and vtTi,∗ ∈ Rd and vtTj,∗ ∈ Rd , denoting the average embeddings of relations in T(i∗) and T(j∗) at the training epoch t, the relation proximity between shapelets si and sj is:
where jac(·, ·) and cos(·, ·) are as defined in Eq. 1.
Focusing on outgoing neighborhoods and relations reinforces next-shapelet and relation information during training, enabling the capture of early illness symptoms and improving detection earliness. Using Eq. 1 and Eq. 2, the embedding of shapelet si at epoch t can be formulated from its outgoing neighbors' embeddings vtj ∈ Rd , as defined below:
where ω > 0 is the weight balancing two proximities. With the designed attentive mechanism, shapelet embeddings can be enhanced by prioritizing to more informative neighbors.
Transition Confidence
To ensure robust embedding learning, the confidence of a shapelet's transition should be considered, which refers to the confidence of a triplet (si, τ, sj) (transition from si to sj with time interval τ), given the presence of missing values in raw heart rate data collected from wearable devices.
As defined in Def. 1, missing values in wearable device data are imputed using linear interpolation. Subsequently, we estimate the confidence of a data point xp in the imputed heart rate time series X. Let ∆tp,q be the time difference between xp and the nearest non-imputed data point xq in time series X. The confidence γ(xp) of data point xp is defined as:
where φ > 0 is a fixed value, and I(·) is an indicator function. The smaller the time difference ∆tp,q, the higher the confidence of xp. Note that γ(xp) is set to 1 if xp is a nonimputed data point.
We then use Eq. 4 to formulate the transition confidence of a triplet ν = (si, τ, sj) in shapelet-transition KG. Assuming shapelets si ∈ Rk and sj ∈ Rk correspond to segments vi = {x1, .., xk} and vj = {x′1 , .., x′k } of a heart rate time series, respectively, the transition confidence of ν is formulated as:
where fν represents the occurrence proportion of the transition from si to sj with time interval τ in the historical data.
Model Training
Based on the aggregated embeddings for shapelets (Eq. 3) and the transition confidence of each triplet (Eq. 5), we design a triplet-based embedding optimization to reinforce shapelet transition structures. To capture the relationships among shapelets effectively, we employ a margin-based objective. Let T denote the set of all triplets ν = (si, τ, sj) in the shapelet-transition KG. The loss function for the transitionaware knowledge embedding is formulated as:
where T ′ represents negative triplets, including all triplet combinations excluding T. Cν denotes transition confidence (Eq. 5), and [µ]+ = max(0, µ). The margin ξ > 0 is used to separate the embeddings of positive and negative triplets. The scoring function Eν evaluates triplet plausibility, ensuring the structure captures meaningful relationships among shapelets based on the concept of KG embedding. We adopt the DistMult model [Yang et al., 2014] as the scoring function:
where vtτ ∈ Rd is the relation τ's embedding, and v′t i is the aggregated embedding of shapelet si fromEq. 3. (·)T denotes transpose, and diag(·) the diagonal matrix.
By refining the loss function, the embeddings for shapelets and the relations within the shapelet-transition KG can adeptly encapsulate the relationship structures among shapelets, handle missing data, and represent potential changes in heart rate dynamics.
4.3 Time Series Representation Formulation
Utilizing the embeddings derived from the shapelet-transition KG, each heart rate time series X can then be represented to reflect the patient's condition changes.
Let TX denote the set of triplets occurring in X. For each triplet ν ∈ TX, let 0 < Iν ≤ |TX| represent its reverse index in TX, where Iν = 1 corresponds to the most recent triplet and Iν = |TX| refers to the earliest one. A higher Iν value indicates an earlier occurrence of ν in time series X. Given the reverse index Iν for each triplet ν ∈ TX, the representation ΨX ∈ R3d of the time series X can be formulated as:
where vi, vτ , and vj are the learned embeddings of si, τ , and sj, respectively. The symbol || represents vector concatenation. The fixed value 0 < ϵ < 1 ensures that the most recent triplet in the time series is assigned greater importance.
Consequently, the representations of historical heart rate time series serve as input features for training classification models. As incoming heart rate time series are collected at each time interval, their representations can be generated in a similar manner, allowing for continuous identification of deterioration at every interval.
5 Experimental Results
5.1 Dataset and Experimental Setup
Dataset and Preprocessing. We collect a real-world dataset from National Cheng Kung University Hospital (NCKUH) 1 , containing information from 58 ICU patients. The dataset includes (i) heart rate data with 1-minute granularity from wearable devices and (ii) Apache II scores at specific time steps, used to define deterioration labels (Sec.3, Def. 2) for patients. As clinical deterioration signs can appear 6-8 hours in advance [Rose et al., 2015], we extract the 8-hour heart rate time series preceding the time step when the deterioration label is assigned (the illness level increase or decreases). Table 1 presents the preprocessed time series statistics. We randomly utilize two-thirds of the data for training and the remaining one-third for testing, reporting results as the average across 3-fold cross-validation.
1 The study protocol was approved by the Institutional Review Board (IRB) of NCKUH (No. B-BR-106-044 & No. A-ER-109027).
| The Num. of TS | Statistics of each TS | ||
|---|---|---|---|
| #Total | 142 | Length | 8 hr. |
| #Deterioration | 79 | Data granularity | 1 min. |
| #Recovery | 63 | Avg. missing rate | 20% |
Baseline Methods. We compare with following baselines:
Feature-based Method: Extracts statistical features (e.g., mean, skew, standard deviation, and kurtosis) from time series as input. We include the XGBoost model [Chen and Guestrin, 2016].
Sequence-based Method: Classifies time series based on specific subsequences, including the classic early classification model ECTS [Xing et al., 2012], and Shapelet Transformation (ST) [Lines et al., 2012].
Graph-based Method: Uses graph embedding to represent time series. We compare with Time2Graph [Cheng et al., 2019], which models shapelets as graph nodes and applies embedding techniques. Unlike our method, Time2Graph does not consider transition types between shapelets, nor does it preserve neighborhood and relation proximities or incorporate shapelet confidence.
TARL Variants Method: Evaluates the performance of TARL with certain components removed, including the attentive mechanism (A.M.), transition confidence (T.C.), or both. Specifically, we assess TARL w/o A.M., TARL w/o T.C., and TARL w/o T.C. and A.M..
Evaluation Metrics. We utilze two main evaluation metrics: Detection Effectiveness: Measured using accuracy (Acc.), precision (Prec.), recall (Rec.), F1-score (F1), F0.5-score (F0.5), and F2-score (F2).
Detection Earliness: Estimates the earliness score of a detection as T-t T , following [Gupta et al., 2020a], where T is the total length of a time series, defined as 480 minutes (8 hours), and t is the length (in minutes) of observed time series used for detecting deterioration. A higher earliness score indicates earlier detection with fewer heart rate observations. Reports include the first quartile (Q1), third quartile (Q3), interquartile range (IQR), and average (Avg.) of the earliness scores across all testing time series.
Balance Performance: Evaluates the trade-off between detection effectiveness and earliness. We introduce a new metric, Effectiveness-Earliness Score (EE Score), calculated as the average of the F1-score and the average earliness score.
| Method | Effectiveness | Earliness | Balance | ||||||||
|---|---|---|---|---|---|---|---|---|---|---|---|
| Acc.(↑) | Prec.(↑) | Rec.(↑) | F1(↑) | F0.5(↑) | F2(↑) | Q1(↑) | Q3(↑) | IQR(↓) | Avg.(↑) | EE Score (↑) | |
| XGBoost | 0.53 | 0.59 | 0.76 | 0.66 | 0.62 | 0.72 | 0.75 | 0.95 | 0.20 | 0.73 | 0.69 |
| ECTS | 0.57 | 0.67 | 0.64 | 0.65 | 0.66 | 0.65 | 0.02 | 0.13 | 0.11 | 0.08 | 0.36 |
| ST | 0.51 | 0.54 | 0.90 | 0.68 | 0.59 | 0.79 | 0.87 | 0.93 | 0.06 | 0.83 | 0.75 |
| Time2Graph | 0.57 | 0.75 | 0.48 | 0.59 | 0.68 | 0.52 | 0.11 | 0.48 | 0.37 | 0.29 | 0.44 |
| TARL w/o T.C. | 0.55 | 0.63 | 0.81 | 0.71 | 0.66 | 0.76 | 0.50 | 0.87 | 0.37 | 0.69 | 0.70 |
| TARL w/o A.M. | 0.55 | 0.61 | 0.88 | 0.72 | 0.65 | 0.81 | 0.68 | 0.87 | 0.18 | 0.76 | 0.74 |
| TARL w/o T.C. and A.M. | 0.52 | 0.59 | 0.69 | 0.64 | 0.61 | 0.67 | 0.62 | 0.80 | 0.17 | 0.70 | 0.67 |
| TARL (ours) | 0.61 | 0.62 | 0.92 | 0.74 | 0.67 | 0.84 | 0.72 | 0.88 | 0.16 | 0.79 | 0.76 |
Implementation Details
For training TARL, the embedding dimension is set to 256, with 20 shapelets of length 15. The weight ω (Eq. 3) is set to 0.5. XGBoost serves as the classifier for TARL in our experiments. To simulate wearable device monitoring, testing time series are split into 30-minute segments and sent sequentially as real-time situation. Experiments are conducted on a system with 12 CPU cores and 64GB RAM, running CUDA 12.1.
5.2 Performance Comparison Results
The comparative results are shown in Table 2. The key observations are drawn as follows:
- Effectiveness. TARL achieves the highest accuracy, recall, F1-score, and F2-score. While Time2Graph outperforms TARL in precision and F0.5-score, its significantly lower recall indicates it misses many deterioration cases. In addition, TARL achieves the highest accuracy, ensuring reliable overall classification. In early detection of patient deterioration, prioritizing recall is essential to identify as many at-risk patients as possible, even at the cost of some false positives. Since F1-score and F2-score emphasize recall more than F0.5-score, TARL provides a better detection effectiveness, making it more practical for real-world use.
- Earliness and Balance. While TARL isn't the top performer in earliness, it ranks in the top three and achieves the highest Effectiveness-Earliness (EE) score, demonstrating a strong balance between reliability and early detection. Notably, when TARL attains the highest accuracy, recall, F1-score, and F2-score, its average earliness score reaches 0.79, meaning it detects deterioration about 379 minutes (approximately 6 hours) in advance while observing only 30% of a patient's heart rate time series. This capability is particularly significant for myocardial infarction (MI), a common ICU condition, where the golden window for treatment is about 6 hours [Steinberg et al., 1994]. These results highlight TARL as the most reliable for detecting deterioration within the golden time of treatment, demonstrating its high practicability for real-world applications.
- Ablation Study. Removing both transition confidence and the attentive mechanism (TARL w/o T.C. and A.M.) results in the worst detection effectiveness and the lowest EE score. Excluding only transition confidence (TARL w/o
T.C.) causes a larger drop in earliness score, likely because the impact of missing values is ignored during embedding, weakening reliable shapelet relationships and delaying deterioration detection. On the other hand, removing the attentive mechanism (TARL w/o A.M.) causes a 6% drop in accuracy. This may be because structurally similar shapelets often exhibit similar future changes, and ignoring these relationships may miss meaningful heart rate transitions. These findings confirm the importance of both transition confidence and attentive mechanism in TARL.
5.3 Performance on Different DataMissing Rates
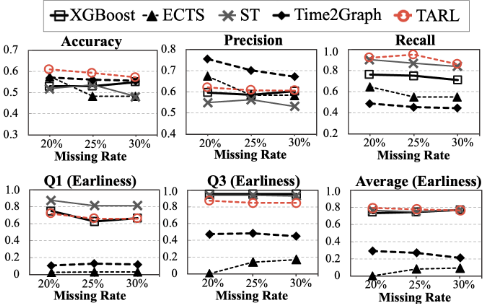
To simulate missing data in wearable devices, we vary the missing rate of heart rate data to {20%, 25%, 30%} to evaluate TARL's performance, as shown in Figure 3. Although TARL's performance slightly declines with higher missing rates, its accuracy and recall consistently surpass baselines. While Time2Graph achieves the highest precision, its precision drops significantly with more missing data, whereas TARL maintains stable precision, demonstrating its robustness to missing values in wearable data.
For earliness performance in Figure 3, TARL maintains an average earliness score of approximately 0.8 across different missing rates, showing its ability to achieve competitive early detection even with varying levels of missing data. This high-
(a) Effectiveness Performance.
(b) Earliness Performance.
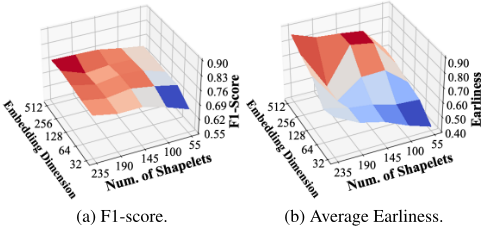
Figure 5: The performance of TARL with varying the embedding dimension and the number of shapelets. Within each metric, higher values are represented in red, while lower values are shown in blue.
lights its practicality for early patient deterioration detection using wearable device data.
5.4 Parameter Sensitivity Analysis
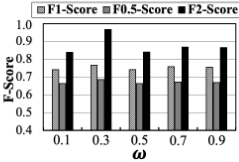
To analyze parameter sensitivity in TARL, we conduct two experiments: one on the weight (ω) balancing neighborhood and relation proximities in Eq. 3, and the other on the embedding dimension and the number of selected key shapelets. Results are shown in Figure 4 and Figure 5, respectively.
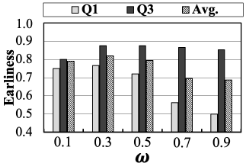
In Figure 4, setting ω to 0.3 yields the best F-score and improved earliness. While F-scores remain relatively stable across ω, earliness performance is more sensitive. As ω increases, the earliness score gap widens, possibly due to ignoring relation proximity during embedding learning, weakening shapelet transition time interval reinforcement. TARL struggles to accurately capture when a patient's condition is likely to change, effecting the earliness of the detection.
In Figure 5, the performance of TARL is evaluated by varying the embedding dimension as {32, 64, 128, 256, 512} and the number of selected key shapelets as {55, 100, 145, 190, 235}. While F-scores gradually improve as both embedding dimension and the number of shapelets increase, they drop sharply when fewer than 145 shapelets are used. This is likely because a smaller shapelet set results in an insufficiently structured shapelet-transition KG. For earliness performance, the embedding dimension shows higher sensitivity, possibly because higher-dimensional embeddings better preserve time interval information in shapelet transitions, improving the detection earliness.
5.5 Case Study
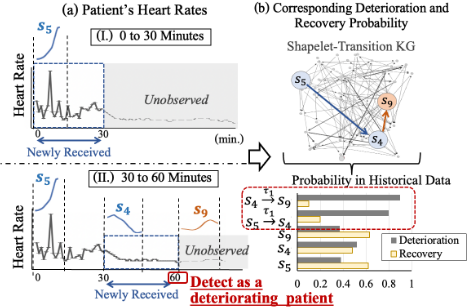
We present a case study in Figure 6, illustrating the detection process for a patient successfully identified as deteriorating with 60 minutes of heart rate monitoring.
Time window (0 to 30 minutes): Shapelet s5 is identified, but s5 has a low deterioration probability. Therefore TARL does not detect it at this stage.
Time window (30 to 60 minutes): Shapelet s4 is identified. While s4 alone still has a low deterioration probability, its transition from s5 through relation τ1 (transition within 0-30 minutes) exhibits a high deterioration probability. Moreover, s9 is identified as having a transition relation following s4 in shapelet-transition KG, and it also appears in the patient's heart rates in the next 30 minutes. The potential transition from s4 to s9 through relation τ1 further reinforces the high deterioration probability, leading TARL to detect signs of deterioration within this time window. This analysis shows that modeling shapelet relationships captures early deterioration signs and potential future transitions. It demonstrates that TARL delivers accurate and explainable detection.
6 Conclusion
In this paper, we introduce a novel framework, TARL, designed for real-time monitoring using wearable devices to enable early detection of illness deterioration by learning patient heart rate representations. We create a shapelet-transition knowledge graph to model heart rate transitions and devise a transition-aware embedding learning method to enhance shapelet relationships and assess missing data impact. With help from physicians and nurses, we gather ICU patient heart rate data from wearables and diagnostic metrics as deterioration indicators. Experimental results show that TARL achieves the best balance between detection effectiveness and earliness, maintaining strong performance even with varying levels of missing data. A case study also illustrates TARL's explainable detection process, which has the potential to help clinicians identify early signs of patient deterioration.
Acknowledgments
We sincerely thank Prof. Nai-Ying Ko, Dr. Yi-Ting Chung, and Dr. Chang-Chun Chen from the Department of Nursing, and Prof. Yu-Chen Shu from the Department of Mathematics at National Cheng Kung University (NCKU), for their invaluable support in wearable data collection, patient coordination, and access to physiological data from NCKU Hospital.
In addition, this paper was supported in part by National Science and Technology Council (NSTC), R.O.C., under Contract 113-2221-E-006-203-MY2, 114-2622-8-006-002TD1 and 113-2634-F-006-001-MBK.
@inproceedings{ijcai2025p1097,
  title     = {Early Detection of Patient Deterioration from Real-Time Wearable Monitoring System},
  author    = {Ting, Lo Pang-Yun and Chen, Hong-Pei and Liu, An-Shan and Yeh, Chun-Yin and Chen, Po-Lin and Chuang, Kun-Ta},
  booktitle = {Proceedings of the Thirty-Fourth International Joint Conference on
               Artificial Intelligence, {IJCAI-25}},
  publisher = {International Joint Conferences on Artificial Intelligence Organization},
  editor    = {James Kwok},
  pages     = {9871--9879},
  year      = {2025},
  month     = {8},
  note      = {AI and Social Good},
  doi       = {10.24963/ijcai.2025/1097},
  url       = {https://doi.org/10.24963/ijcai.2025/1097},
}
TY - CPAPER TI - Early Detection of Patient Deterioration from Real-Time Wearable Monitoring System AU - Ting, Lo Pang-Yun AU - Chen, Hong-Pei AU - Liu, An-Shan AU - Yeh, Chun-Yin AU - Chen, Po-Lin AU - Chuang, Kun-Ta T2 - Proceedings of the Thirty-Fourth International Joint Conference on Artificial Intelligence, IJCAI-25 PB - International Joint Conferences on Artificial Intelligence Organization PY - 2025 SP - 9871 EP - 9879 DO - 10.24963/ijcai.2025/1097 UR - https://doi.org/10.24963/ijcai.2025/1097 ER -Copied
Machine-readable versions of this paper, for tools and AI agents:





