
kgMBQA: Quality Knowledge Graph-driven Multimodal Blind Image Assessment
Proceedings of the Thirty-Fourth International Joint Conference on Artificial Intelligence. Main Track. Pages 4245-4253.
https://doi.org/10.24963/ijcai.2025/473
Keywords
- Humans and AI: HAI: Cognitive modeling
- Humans and AI: HAI: Cognitive systems
- Humans and AI: HAI: Personalization and user modeling
- Humans and AI: HAI: Applications
Abstract
Blind image assessment aims to simulate human prediction of image quality distortion levels and provide quality scores. However, existing unimodal quality indicators have limited representational ability when facing complex contents and distortion types, and the predicted scores also fail to provide explanatory reasons, which further affects the credibility of their prediction results. To address these challenges, we propose a multimodal quality indicator with explanatory text descriptions, called kgMBQA. Specifically, we construct an image quality knowledge graph and conduct in-depth mining to generate explanatory texts. The text modality is further aligned and fused with the image modality, thereby improving the model performance while also outputting its corresponding quality explanatory description. The experimental results demonstrate that our kgMBQA achieves the best performance compared to recent representative methods on the KonIQ-10k, LIVE Challenge, BIQ2021, TID2013, and AIGC-3K datasets.
- [Agnolucci et al., 2024] Lorenzo Agnolucci, Leonardo Gal- teri, Marco Bertini, and Alberto Del Bimbo. Arniqa: Learning distortion manifold for image quality assess- ment. In Proceedings of the IEEE/CVF Winter Conference on Applications of Computer Vision, pages 189-198, 2024.
- [Ahmed and Asif, 2022] Nisar Ahmed and Shahzad Asif. Biq2021: a large-scale blind image quality assessment database. Journal of Electronic Imaging, 31(5):053010- 053010, 2022.
- [Ghadiyaram and Bovik, 2015] Deepti Ghadiyaram and Alan C Bovik. Live in the wild image quality challenge database. Online: http://live. ece. utexas. edu/re- search/ChallengeDB/index. html[Mar, 2017], 2015. Link
- [Golestaneh et al., 2022] S Alireza Golestaneh, Saba Dad- setan, and Kris M Kitani. No-reference image quality assessment via transformers, relative ranking, and self- consistency. In Proceedings of the IEEE/CVF Winter Conference on Applications of Computer Vision (WACV), pages 1220-1230, 2022.
- [Hosu et al., 2020] Vlad Hosu, Hanhe Lin, Tamas Sziranyi, and Dietmar Saupe. Koniq-10k: An ecologically valid database for deep learning of blind image quality assess- ment. IEEE Transactions on Image Processing, 29:4041- 4056, 2020.
- [Li et al., 2023a] Chunyi Li, Zicheng Zhang, Haoning Wu, Wei Sun, Xiongkuo Min, Xiaohong Liu, Guangtao Zhai, and Weisi Lin. Agiqa-3k: An open database for ai- generated image quality assessment. IEEE Transactions on Circuits and Systems for Video Technology, pages 1-1, 2023.
- [Li et al., 2023b] Junnan Li, Dongxu Li, Silvio Savarese, and Steven Hoi. Blip-2: Bootstrapping language-image pre-training with frozen image encoders and large lan- guage models. arXiv preprint arXiv:2301.12597, 2023.
- [Liu and Liu, 2017] Tsung-Jung Liu and Kuan-Hsien Liu. No-reference image quality assessment by wide- perceptual-domain scorer ensemble method. IEEE Transactions on Image Processing, 27(3):1138-1151, 2017.
- [Liu et al., 2017] Xialei Liu, Joost Van De Weijer, and An- drew D Bagdanov. Rankiqa: Learning from rankings for no-reference image quality assessment. In Proceedings of the IEEE international conference on computer vision, pages 1040-1049, 2017.
- [Liu et al., 2019] Yutao Liu, Ke Gu, Yongbing Zhang, Xiu Li, Guangtao Zhai, Debin Zhao, and Wen Gao. Unsuper- vised blind image quality evaluation via statistical mea- surements of structure, naturalness, and perception. IEEE Transactions on Circuits and Systems for Video Technol- ogy, 30(4):929-943, 2019.
- [Luu et al., 2023] Nhan T Luu, Chibuike Onuoha, and Truong Cong Thang. Blind image quality assessment with multimodal prompt learning. In 2023 IEEE 15th Inter- national Conference on Computational Intelligence and Communication Networks (CICN), pages 614-618. IEEE, 2023.
- [Madhusudana et al., 2022] Pavan C Madhusudana, Neil Birkbeck, Yilin Wang, Balu Adsumilli, and Alan C Bovik. Image quality assessment using contrastive learning. IEEE Transactions on Image Processing, 31:4149-4161, 2022.
- [Patil and Mane, 2024] Milind S Patil and Pradip B Mane. No reference quality assessment metric for multi-spectral and multi-modal image fusion using sparse approxi- mate variational autoencoder. International Journal of Intelligent Systems and Applications in Engineering, 12(17s):724-732, 2024.
- [Ponomarenko et al., 2015] Nikolay Ponomarenko, Lina Jin, Oleg Ieremeiev, Vladimir Lukin, Karen Egiazarian, Jaakko Astola, Benoit Vozel, Kacem Chehdi, Marco Carli, Federica Battisti, et al. Image database tid2013: Peculiar- ities, results and perspectives. Signal processing: Image communication, 30:57-77, 2015.
- [Qin et al., 2023] Guanyi Qin, Runze Hu, Yutao Liu, Xiawu Zheng, Haotian Liu, Xiu Li, and Yan Zhang. Data-efficient image quality assessment with attention-panel decoder. In AAAI Conference on Artificial Intelligence (AAAI), vol- ume 37, pages 2091-2100, 2023.
- [Saha et al., 2023] Avinab Saha, Sandeep Mishra, and Alan C. Bovik. Re-iqa: Unsupervised learning for im- age quality assessment in the wild. In Proceedings of the IEEE/CVF Conference on Computer Vision and Pattern Recognition (CVPR), pages 5846-5855, June 2023.
- [Siahaan et al., 2018] Ernestasia Siahaan, Alan Hanjalic, and Judith A Redi. Semantic-aware blind image quality assessment. Elsevier Signal Processing: Image Communi- cation, 60:237-252, 2018.
- [Su et al., 2020] Shaolin Su, Qingsen Yan, Yu Zhu, Cheng Zhang, Xin Ge, Jinqiu Sun, and Yanning Zhang. Blindly assess image quality in the wild guided by a self-adaptive hyper network. In Proceedings of the IEEE/CVF Con- ference on Computer Vision and Pattern Recognition (CVPR), pages 3667-3676, 2020.
- [Sun et al., 2023] Wei Sun, Xiongkuo Min, Danyang Tu, Si- wei Ma, and Guangtao Zhai. Blind quality assessment for in-the-wild images via hierarchical feature fusion and iter- ative mixed database training. IEEE Journal of Selected Topics in Signal Processing, 2023.
- [Touvron et al., 2023] Hugo Touvron, Louis Martin, Kevin Stone, Peter Albert, Amjad Almahairi, Yasmine Babaei, Nikolay Bashlykov, Soumya Batra, Prajjwal Bhargava, Shruti Bhosale, et al. Llama 2: Open foundation and fine-tuned chat models. arXiv preprint arXiv:2307.09288, 2023.
- [Wang et al., 2023] Jianyi Wang, Kelvin CK Chan, and Chen Change Loy. Exploring clip for assessing the look and feel of images. In AAAI, 2023.
- [Wang et al., 2024] Miaohui Wang, Zhuowei Xu, Mai Xu, and Weisi Lin. Blind multimodal quality assessment of low-light images. International Journal of Computer Vi- sion, pages 1-24, 2024.
- [Wang et al., 2025] Miaohui Wang, Zhuowei Xu, Xiaofang Zhang, Yuming Fang, and Weisi Lin. Visual quality as- sessment of composite images: A compression-oriented database and measurement. IEEE Transactions on Image Processing, 30:1849-1863, 2025.
- [Wu et al., 2022] Jialian Wu, Jianfeng Wang, Zhengyuan Yang, Zhe Gan, Zicheng Liu, Junsong Yuan, and Lijuan Wang. Grit: A generative region-to-text transformer for object understanding. arXiv preprint arXiv:2212.00280, 2022.
- [Yan et al., 2018] Qingsen Yan, Dong Gong, and Yanning Zhang. Two-stream convolutional networks for blind im- age quality assessment. IEEE Transactions on Image Pro- cessing, 28(5):2200-2211, 2018.
- [Yang et al., 2022] Sidi Yang, Tianhe Wu, Shuwei Shi, Shan- shan Lao, Yuan Gong, Mingdeng Cao, Jiahao Wang, and Yujiu Yang. Maniqa: Multi-dimension attention network for no-reference image quality assessment. In Proceedings of the IEEE/CVF Conference on Computer Vision and Pat- tern Recognition (CVPR), pages 1191-1200, 2022.
- [You et al., 2023] Zhiyuan You, Zheyuan Li, Jinjin Gu, Zhenfei Yin, Tianfan Xue, and Chao Dong. Depict- ing beyond scores: Advancing image quality assessment through multi-modal language models. arXiv preprint arXiv:2312.08962, 2023.
- [Yuan et al., 2024] Jiquan Yuan, Xinyan Cao, Jinming Che, Qinyuan Wang, Sen Liang, Wei Ren, Jinlong Lin, and Xixin Cao. Tier: Text and image encoder-based regres- sion for aigc image quality assessment. arXiv preprint arXiv:2401.03854, 2024.
- [Zhai and Min, 2020] Guangtao Zhai and Xiongkuo Min. Perceptual image quality assessment: a survey. Springer Science China Information Sciences, 63:1-52, 2020.
- [Zhang et al., 2021] Weixia Zhang, Kede Ma, Guangtao Zhai, and Xiaokang Yang. Uncertainty-aware blind im- age quality assessment in the laboratory and wild. IEEE Transactions on Image Processing, 30:3474-3486, 2021.
- [Zhu et al., 2020] Hancheng Zhu, Leida Li, Jinjian Wu, Weisheng Dong, and Guangming Shi. Metaiqa: Deep meta-learning for no-reference image quality assessment. In Proceedings of the IEEE/CVF Conference on Computer Vision and Pattern Recognition (CVPR), pages 14143- 14152, 2020.
References were extracted automatically from the PDF and may contain errors.
Full text extracted automatically from the PDF; figures, tables and equations may differ. The PDF is the version of record.
1 Introduction
With the rapid development of multimedia, social networks generate billions of digital images every day. However, throughout their entire lifecycle, including stages such as acquisition, processing, compression, transmission and display, these images inevitably generate distortion [Zhai and Min, 2020; Wang et al., 2025], leading to visual quality changes. Low-quality images not only provide visual experiences for users but can also have serious negative impacts on machine vision (e.g., classification, recognition, and segmentation). Therefore, developing reliable image quality assessment (IQA) models is a highly hot research topic.
Existing blind IQA methods can be categorized into traditional and deep learning methods [Wang et al., 2024]. Traditional IQAs generally predict quality scores by utilizing statistical features, such as texture [Liu and Liu, 2017], structural information [Liu et al., 2019], and semantic information [Siahaan et al., 2018]. However, these methods heavily rely on the selected features, making it difficult to comprehensively express the quality information of various content. In contrast, deep learning-based IQAs have developed rapidly, including adaptive network proposed to address the diversity of authentic distortions [Su et al., 2020], hybrid dataset iterative training strategies proposed to solve the problem of insufficient training samples [Sun et al., 2023], and the introduction of meta-learning to address generalization issues [Zhu et al., 2020]. Although these IQA models have achieved promising results, they use quantitative scores to represent image quality and seldom provide semantic text descriptions that humans are more adept at using to perceive visual quality. As a result, this makes it difficult for users to understand the predicted quality results.
∗Corresponding author: Miaohui Wang
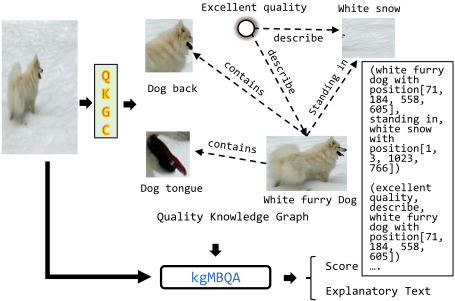
In view of this, we propose a knowledge graph-based multimodal blind quality assessment (kgMBQA) framework with explanatory text description, as shown in Figure 1. Specifically, we generate explanatory texts by a quality knowledge graph, which consists of a global quality representation and a local quality representation. Subsequently, we utilize Llama3.2 to remove parts of the unrelated text, generating information-rich explanatory text consistent with human quality perception system. This text modality and the image modality are used as the inputs to obtain quality scores as well as interpretable quality descriptions. To effectively fuse text and image features, a multimodal learning framework is also developed. Our contributions are summarized as follows.
- To generate explanatory descriptions for blind IQAs, we propose a quality knowledge graph to generate the text modality, consisting of the quality descriptions from global and local views.
- To enhance visual quality descriptions, we utilize a large language model (LLM) to integrate global and local texts. Specifically, we obtain effective prompts to guide the LLM in better removing irrelevant descriptions, thereby improving quality assessment performance.
- To address the heterogeneity between image and text modalities, we further design three key network modules in multimodal learning: feature extraction, fusion, and prediction head, aiming to further enhance the quality prediction accuracy. Experimental results validate the superior performance of our method on five benchmark image datasets.
2 RelatedWork
We review recent advances from the perspectives of unimodal and multimodal image quality assessment methods.
2.1 Unimodal Methods
Recently, a significant progress has been made in single modality quality assessment methods. For instance, Liu et al. proposed the RankIQA method [Liu et al., 2017]. Yan et al. introduced a two-stream convolutional network comprising two subcomponents that process the raw image and gradient image to more effectively learn image feature representations [Yan et al., 2018]. Zhu et al. presented a meta-learning-based blind IQA approach [Zhu et al., 2020], allowing it to easily adapt to unknown distortions. Zhang et al. trained a convolutional network to improve the characterization of image distortion [Zhang et al., 2021]. Yang et al. introduced the multi-dimensional attention network (MANIQA) to improve performance on GAN-based distortions [Yang et al., 2022]. Madhusudana et al. proposed an improved convolutional network to obtain the type and degree of image distortions [Madhusudana et al., 2022]. Golestaneh et al. first extracted local image features and then used the Transformer to address the locality bias issue, thereby obtaining more accurate prediction [Golestaneh et al., 2022]. Qin et al. proposed a lightweight architecture based on Transformer that efficiently generates quality-aware features with less data to reduce prediction uncertainty [Qin et al., 2023]. To address the complexity and diversity of distortion types in natural images, Saha et al. presented the Re-IQA by training a quality-aware and content-aware model via unsupervised methods [Saha et al., 2023]. Wang et al. has explored the CLIP ability to predict the image quality [Wang et al., 2023]. Agnolucci et al. modeled the image distortion manifold through self-supervised learning [Agnolucci et al., 2024], thereby obtaining intrinsic quality representations and emphasizing the importance of distortion type.
2.2 Multimodal Methods
In addition, multimodal information has been introduced into the field of quality assessment region. For instance, Patil et al. proposed a multispectral-oriented multimodal blind IQA method for satellite stereoscopic images [Patil and Mane, 2024]. To address the complex characterization of noise in low-light images, Wang et al. proposed a multimodal blind IQA framework for low-light images using textual descriptions and image content, effectively improving prediction performance [Wang et al., 2024]. Yuan et al. proposed a Text-Image Encoder-based Regression (TIER) framework to tackle issues in AI-generated image (AIGI) quality assessment based on human perception (AIGCIQA) [Yuan et al., 2024]. Luu et al. introduced a blind IQA model based on multimodal prompt learning, utilizing the pre-trained MaPLe network [Luu et al., 2023]. You et al. proposed the DepictQA, a painting image quality indicator based on a multimodal large language model, which overcomes the limitations of traditional score-based methods through descriptive and comparative evaluations [You et al., 2023].
3 Methodology
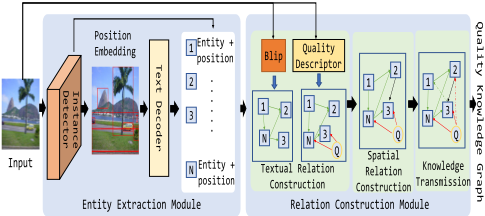
Our kgMBQA consists of two main parts: quality knowledge graph construction (QKGC) and multimodal quality learning (MQL). The overall pipeline is shown in Figure 2.
3.1 Quality Knowledge Graph Construction
In the QKGC module, we build a quality knowledge graph, which is comprised of an entity set E, a relation edge set R, and an attribute set A, denoting as the triple (E,R,A). Specifically, E is further partitioned into two subsets: the normal entity set N and the quality entity set Q, expressed as E = N ∪Q. R encompasses three subsets: the textual relation subset Rt, the spacial relation subset Rs, and the subset Rk formed by new relation edges derived from knowledge reasoning, that is, R = Rt ∪ Rs ∪ Rk. Currently, only the embedded positional information of A is utilized to discriminate among entities. Consequently, A contains solely the positional information as its sole element type.
Entity Extraction Module. For a given image Ximg, we aim to extract the entity information that is representative and can fully reflect the perceived image quality. Specifically, an entity extraction module is established by combining an instance detector Fins (·) and a text decoder Ftdr. Fins (·) is used to detect the target elements, and then the text decoder is utilized to convert the detected elements into text descriptions, thus obtaining the corresponding entity information. This entity information includes the entity N and its position ('entity' + 'position'), providing a basis for subsequent processing such as relation construction.
In Fins (·), we consider a visual encoder FV iT (·) and a foreground object extractor Fobject (·) to obtain local foreground object features. First, to more effectively extract image contextual features for extracting entities, we employ a visual encoder backbone with a global self-attention, denoted as FV iT (·). To address the incompatibility between image contextual feature scales and foreground object extractor Fobject (·), we further introduce a five-level feature pyramid network model { 18 , 1 16 , 1 32 , 1 64 , 1 128 }, denoted as Fpyr(·). Second, we employ a two-stage foreground object extractor Fobject(·), consisting of a proposal generator and a region-ofinterest head to detect foreground objects through bounding boxes and object scores.
In the text decoder, we generate corresponding foreground object text descriptions from the object features obtained in the instance detector. Specifically, we resize these object features to a fixed size (e.g., 32×32), then flatten them into one-dimensional vectors, resulting in Tobj. Further, we feed these into a text decoder with a start token '[Dense Caption]', which generates text tokens in an auto-regressive manner until the end token '[EOF]' is generated. However, when the text descriptions are used to name entities, it will result in different entities having the same text description. Therefore, we propose to embed the position information into the entities through the position embedding and use it as an attribute of the entities, so that each entity can be unique.
Relation Construction Module. The relation construction module serves as a linchpin within the overall QKGC system. By capitalizing on textual relation construction, space relation construction and knowledge transmission, it constructs the edge relations among entities embedded with position information, culminating in the generation of the ultimate quality knowledge graph.
To be more precise, image captions are incorporated to formulate semantic edges interconnecting relevant entities. For example, BLIP-V2 [Li et al., 2023b] is employed to generate captions. Subsequently, entities are distilled from these captions via text matching techniques, while the residual text descriptions lying between the entities are designated as the relationship edges. Meanwhile, with the aim of bolstering the quality relevance to a greater extent, a quality descriptor is brought into this process with a well-trained ResNet-34 model as its basis. We map the distortion intensities from low to high to five levels in the subjective quality assessment: {'Excellent Quality', 'Good Quality', 'Fair Quality', 'Poor Quality', 'Bad Quality'}, and convert them into commonly used verbal descriptions to more clearly express the subjective feelings. For ease of classification, we have normalized the subjective scores of the training images, where the subjective score intervals are (0.85, 1], (0.7, 0.85], (0.55, 0.7], (0.4, 0.55], and [0, 0.4], corresponding to the five quality levels mentioned above. Our quality descriptor introduces a new entity Q, and it has a descriptive relationship with the entities in the caption, that is (Q, describe, N).
In the spacial relation construction module, by comparing the positional attributes of different entities, we can derive the 'inclusion' relationship (where the position of entity X completely encompasses that of entity Y ) and the 'side' relationship (where the position of entity X and that of entity Y are right next to each other).
In the knowledge reasoning module, the pre-existing knowledge gets disseminated in accordance with the 'inclusion' relationship among entities. Let us assume there exist entities X and Y having the relationship (e.g., X includes Y ). In such a case, the novel relationship set for entities X and Y is formulated by taking the union of the relationship set of entity X and that of entity Y , which can be precisely expressed as RX∪Y = RX ∪ RY .
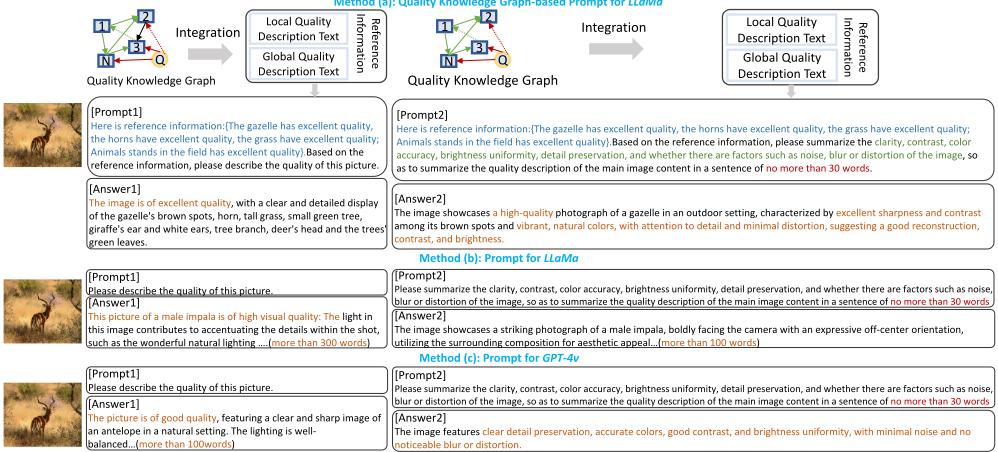
Explanatory Text Generation We combine the resulted quality knowledge graph with independently designed questions to form our 'Prompt'. This 'Prompt' information is then input into Llama3.2-11B [Touvron et al., 2023] for information filtering and integration, resulting in the final explanatory image quality text modality Xtxt.
For example, the specific structure of our 'Prompt' is given as follows. First, there is the guiding text with the specific content: "Here is the reference information:", indicating to the model that this is the knowledge graph we have constructed and can be used as the reference information. Next, we input the quality knowledge graph through sets of triples with a specific structure of (head entity, relationship, tail entity). As a result, our question can be with the specific content: "Based on the reference information, please summarize the clarity, contrast, color accuracy, brightness uniformity, detail preservation, and whether there are factors such as noise, blur or distortion of the image, so as to summarize the quality description of the main image content in a sentence of no more than 30 words." By integrating our quality knowledge graph, the model can effectively overcome the hallucination phenomenon and has a better effect on image quality description.
3.2 Multimodal Quality Learning
Our mulimodal quality learning (MQL) module consists of three parts, as shown in Figure 3: an image-text feature extraction module, a multimodal feature fusion module, and a quality prediction head.
Image-Text Feature Extraction. We have designed an effective image feature extractor Fimg. For convenience, we choose ResNet-50 as the backbone, and add a convolutional neural network (CNN) block to the features extracted from each stage of the backbone to enrich the features. The CNN block is composed of three stacked convolutional layers: the first convolutional layer has a stride of one and reduces the input channel dimension to one-fourth of the original, making the channel information more compact; the second convolutional layer has a stride of three and performs an identity mapping on the channels to enrich the channel information; the third convolutional layer has a stride of one and maps the channels to the target channel dimension. The features extracted after enrichment at each stage are summed up to obtain our preliminary image features. Subsequently, to facilitate interaction with text features more conveniently, we map the channel dimension to the specified dimension through a fully-connected layer to obtain the image feature Fimg.
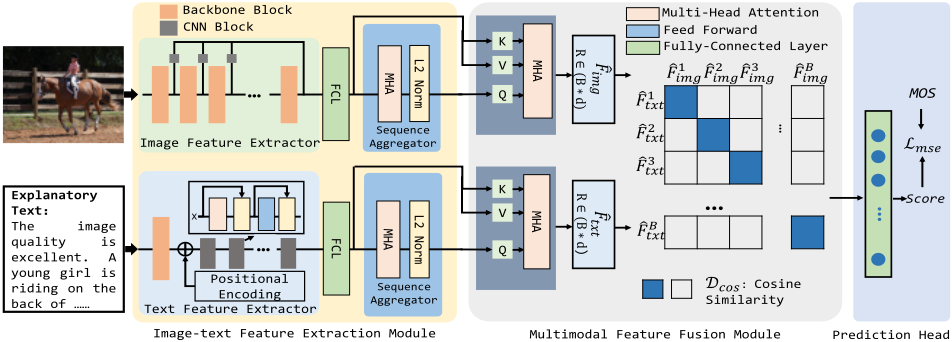
Furthermore, to reduce the burden on computing resources, we propose a sequence aggregator, which merge the spatial information of the resulted features through a multi-head selfattention with 32 heads and an L2 normalization layer Fnorm, obtaining the final feature ˜Fimg:
where Fmsha represents a 32-head self-attention pooling module, and the projection dimension is set to 2048.
For the input text Xtxt, we first perform a tokenization operation using the BERT vocabulary. Subsequently, we carry out padding or truncation processing, and adjust the channel dimension to 512. We have designed a text feature extractor Ftxt that has an embedding layer capable of converting text features into continuous dense vectors. Then, we use learnable position encoding Fpos to achieve the position embedding. To effectively highlight the features of the quality description part, we extract the text features Ftxt by stacking 12 encoder blocks of the Transformer with 32-head encoder. Considering the limitations of computing resources, we adopt the same structure as the image feature extractor Fimg, that is, we use a sequence aggregator to aggregate the information of the text features, and finally obtain the required text features ˜Ftxt.
Multimodal Feature Fusion. To enrich multimodal features, we utilize a multi-head self-attention mechanism: the obtained image feature ˜Fimg is used as the query, and the nondimensional-reduced image feature Fimg is used as the key and value to guide the feature interaction, thereby further aggregating the global information and obtaining the interacted image feature ˆFimg. The same operation is carried out on the text features to obtain ˆFtxt.
For the enhanced features ˆFimg and ˆFtxt, we need to conduct further intra-modal feature interactions to explore richer semantic information and potential correlations within each respective modality.
We quantify the relative disparity between the two enhanced features, namely ˆFimg and ˆFtxt, by leveraging the cosine similarity metric. In the process of feature fusion, our objective is to construct an embedding space in which the paired ˆFimg and ˆFtxt originating from the same instance are in close proximity to one another, whereas the non-paired features derived from different instances are substantially separated in the feature space.
For example, given the i-th image feature ˆFiimg and the j-th text feature ˆFjtxt in the current training batch B, the matching probability can be expressed as:
where ⊙ represents the dot product, ∥·∥ denotes the Euclidean distance, and τ represents the temperature parameter, with an empirical value of 0.07. Similarly, the matching probability between the j-th text feature and the i-th image feature in the current training batch B is expressed as Ptxt(j, i). We need to ensure that the matching probability of ˆFimg and ˆFtxt in each training batch is maximized, that is, Pimg(i, i) = maxk∈BPimg(i, k) and Ptxt(j, j) = maxk∈BPtxt(k, j). Therefore, the learning objective for our multimodal feature alignment is:
Quality Prediction Head. The multimodal feature fusion module integrates ˆFimg and ˆFtxt to predict the overall image quality score. The feature fusion module combines complementary information and broadens the feature representation capability. We first perform L2 normalization on the aligned features, concatenate them horizontally to get fused features, and then pass it through a fully connected layer to obtain the final predicted score.
| Datasets | Year | Number | Dis-type | Size | label |
|---|---|---|---|---|---|
| LIVE-Challenge | 2015 | 1162 | Authentic | 500×500 | MOS |
| KonIQ-10k | 2020 | 10073 | Authentic | 1024×768 | MOS |
| BIQ2021 | 2022 | 12000 | Authentic | 512×384 | MOS |
| TID2013 | 2015 | 3000 | Synthetic | 512×512 | MOS |
| AIGC-3K | 2023 | 2982 | Synthetic | 512×512 | MOS |
where W denotes the weight vector of size 1×128 for the fully-connected layer, where it is multiplied with the output of the concatenated and potentially transformed feature vector from the fusion process. b denotes the bias term that is a scalar value added to the result of the multiplication of the feature vector with the weight vector to adjust the final predicted score. The loss function of our model uses the mean squared error Lmse, as shown in Figure 3.
4 Experimental Validations
We have implemented the proposed kgMBQA on the PyTorch platform, conducted comparison experiments with recent representative methods, and carried out ablation experiments.
4.1 Experimental Setups
All experiments in this paper have been conducted on a computing platform with an Intel(R) Xeon(R) Silver 4210R@2.40GHz CPU, 62GB RAM, and NVIDIA A100PCIE-40GB×6 GPUs.
In the experiments, we randomly split the dataset into training, validation, and test sets in an 8:1:1 ratio. To alleviate memory pressure, we crop the input images to 224×224. During the training, the initial learning rate is set to 5e-5 and decreased to 90% of the original value every 10 epochs. Additionally, the batch size is set to 20, and the adaptive moment estimation method (Adam) is used to optimize the learning parameters. We directly use a pre-trained model [Wu et al., 2022] for local text generation. In the experiments, we train our kgMBQA model for a total of 100 epochs.
4.2 Validation Datasets
We have carried out the comparison experiments on five different image datasets:
KonIQ-10k [Hosu et al., 2020]: This dataset contains 10,073 natural images with a resolution of 1024×768. The original images are selected by the authors from YFCC100m using an algorithm and do not undergo artificial distortion, maintaining their authenticity. Each image score is obtained through subjective evaluations conducted by crowdsourcing, with the label recorded as the mean opinion score (MOS).
LIVE-Challenge [Ghadiyaram and Bovik, 2015]: This dataset contains 1,162 natural images with a resolution of 500×500, covering various content, including faces, people, animals, close-ups, wide-angle shots, and natural landscapes. These images are captured by cameras, including various types of distortions such as low light noise, motion blur, overexposure, underexposure, and compression artifacts. Subjective scores are obtained through crowdsourcing, with over 8,100 testers providing more than 350,000 ratings.
BIQ2021 [Ahmed and Asif, 2022]: Each image in the BIQ2021 dataset has a MOS. This dataset is divided into three subsets. The MOS values are scaled to a range of 0-1, and classified into three categories according to the content type. The first subset contains 2000 images selected from an image gallery captured by Nisar Ahmed between 2007 and 2020. These images have varying degrees and types of distortions due to the use of various image acquisition devices, serving as true representatives for evaluating IQA algorithms. The second subset contains 2000 images that are captured specifically for image quality measurement. This subset ensures the coverage of the entire spectrum of quality scores by introducing images ranging from the worst to the best. The third subset contains 8000 images acquired from Unsplash.com. The downloaded images are searched using various keywords to introduce content diversity and are specifically chosen. These scores are derived from human observers with a scale from 1 to 5 (e.g., "excellent" to "very bad"). According to ITU-T P.910 recommendations, using up to 30 diverse subjects ensures reliable judgments. The experiments are performed in a controlled lab environment, and the average of the ratings from 30 observers is used to obtain the MOS.
TID2013 [Ponomarenko et al., 2015]: TID2013 contains 25 reference images and 3,000 distorted images (25 reference images ×24 types of distortions ×5 levels of distortions). The reference images are obtained by cropping from the Kodak Lossless True Color Image Suite. All images are saved in the dataset in Bitmap format without any compression. The MOS is obtained from the results of 971 experiments carried out by observers from five countries (116 experiments in Finland, 72 in France, 80 in Italy, 602 in Ukraine, and 101 in the USA). In total, 971 observers assess 524,340 comparisons of the visual quality of distorted images, or 1,048,680 evaluations of relative visual quality in image pairs.
AIGC-3K [Li et al., 2023a]: The AIGC-3K dataset employed six different image generation models to generate 2,982 images. The MOS value is derived from a 14-session experiment, involving 21 graduate students (10 males and 11 females, from 6 different countries) who have participated in the rating process.
4.3 EvaluationMetrics
We use three commonly adopted evaluation metrics to measure the quality assessment results, including the Spearman rank order correlation coefficient (SRCC), Pearson linear correlation coefficient (PLCC), and root mean squared error (RMSE). PLCC describes the linear correlation between the distorted and original images, SRCC measures the monotonic relationship, and RMSE represents the mean square error. Both SRCC and PLCC range from 0 to 1. A superior performance should result in the absolute values of SRCC and PLCC close to 1, and RMSE should close to 0.
| Methods | KonIQ-10k | LIVE-Challenge | BIQ2021 | TID2013 | AGIQA-3K | ||||||||||
|---|---|---|---|---|---|---|---|---|---|---|---|---|---|---|---|
| SRCC↑ | PLCC↑ | RMSE↓ | SRCC↑ | PLCC↑ | RMSE↓ | SRCC↓ | PLCC↑ | RMSE↓ | SRCC↑ | PLCC↑ | RMSE↓ | SRCC↑ | PLCC↑ | RMSE↑ | |
| Zhu2020CVPR | 0.8555 | 0.8796 | 0.0839 | 0.7765 | 0.8037 | 0.1291 | 0.8367 | 0.8747 | 0.0923 | 0.9368 | 0.9575 | 0.0468 | 0.8457 | 0.8890 | 0.0955 |
| Su2020CVPR | 0.8711 | 0.8811 | 0.0848 | 0.8000 | 0.8256 | 0.1236 | 0.8862 | 0.9001 | 0.0729 | 0.9644 | 0.9722 | 0.0391 | 0.7560 | 0.8289 | 0.1146 |
| Zhang2021TIP | 0.8253 | 0.8316 | 0.1435 | 0.6936 | 0.7189 | 0.1845 | 0.8711 | 0.8711 | 0.8711 | 0.5770 | 0.6733 | 0.0688 | 0.7155 | 0.7751 | 0.0398 |
| Madhusudana2022TIP | 0.8895 | 0.8896 | 0.0814 | 0.8218 | 0.7754 | 0.1346 | 0.7964 | 0.8327 | 0.1033 | 0.8181 | 0.8374 | 0.0956 | 0.7490 | 0.7818 | 0.1526 |
| Golestaneh2022WACV | 0.8911 | 0.8814 | 0.0827 | 0.8483 | 0.8001 | 0.1911 | 0.8350 | 0.7939 | 0.1022 | 0.9711 | 0.9701 | 0.0410 | 0.8985 | 0.8632 | 0.0899 |
| Yang2022CVPR | 0.9277 | 0.9412 | 0.0580 | 0.8773 | 0.9003 | 0.0935 | 0.9015 | 0.9198 | 0.0729 | 0.9644 | 0.9741 | 0.0379 | 0.8964 | 0.9268 | 0.0771 |
| Sa2023CVPR | 0.7424 | 0.7665 | 0.1202 | 0.5517 | 0.5477 | 0.2065 | 0.6870 | 0.7574 | 0.1286 | 0.7511 | 0.8096 | 0.0980 | 0.7741 | 0.8216 | 0.1262 |
| Qin2023AAAI | 0.8398 | 0.8391 | 0.1285 | 0.7788 | 0.8214 | 0.1193 | 0.8830 | 0.8923 | 0.0900 | 0.9708 | 0.9791 | 0.0394 | 0.8555 | 0.8981 | 0.0901 |
| Wang2023AAAI | 0.6786 | 0.6945 | 0.2107 | 0.5905 | 0.5848 | 0.2274 | 0.6567 | 0.7569 | 0.2022 | 0.4994 | 0.5832 | 0.2148 | 0.6470 | 0.7075 | 0.3112 |
| Agnolucci2024WACV | 0.8787 | 0.8856 | 0.1334 | 0.7722 | 0.8563 | 0.1739 | 0.7057 | 0.7603 | 0.7516 | 0.9163 | 0.9346 | 0.1697 | 0.8158 | 0.8739 | 0.0997 |
| Proposed | 0.9442 | 0.9614 | 0.0480 | 0.9019 | 0.9486 | 0.0933 | 0.8880 | 0.9328 | 0.0699 | 0.9732 | 0.9793 | 0.0328 | 0.9570 | 0.9766 | 0.0584 |
| Methods (train on KonIQ-10k) | LIVE-Challenge | BIQ2021 | TID2013 | AGIQA-3K | ||||||||
|---|---|---|---|---|---|---|---|---|---|---|---|---|
| SRCC↑ | PLCC↑ | RMSE↓ | SRCC↑ | PLCC↑ | RMSE↓ | SRCC↓ | PLCC↑ | RMSE↓ | SRCC↑ | PLCC↑ | RMSE↓ | |
| Zhu2020CVPR | 0.7770 | 0.8344 | 0.1250 | 0.7386 | 0.7751 | 0.1301 | 0.4462 | 0.5777 | 0.1683 | 0.6297 | 0.6595 | 0.1980 |
| Su2020CVPR | 0.7296 | 0.7911 | 0.1306 | 0.6760 | 0.7111 | 0.1306 | 0.4430 | 0.6017 | 0.1333 | 0.6657 | 0.7070 | 0.1449 |
| Zhang2021TIP | 0.7164 | 0.7288 | 0.0661 | 0.2151 | 0.3944 | 0.0901 | 0.6283 | 0.6716 | 0.0825 | 0.6253 | 0.6898 | 0.0861 |
| Madhusudana2022TIP | 0.6787 | 0.6781 | 0.1891 | 0.5904 | 0.6282 | 0.1578 | 0.3005 | 0.3057 | 0.1608 | 0.6305 | 0.6638 | 0.2178 |
| Golestaneh2022WACV | 0.7964 | 0.7188 | 0.1291 | 0.7468 | 0.7042 | 0.1235 | 0.5978 | 0.5500 | 0.1378 | 0.6646 | 0.6716 | 0.1531 |
| Yang2022CVPR | 0.8717 | 0.8946 | 0.0960 | 0.7727 | 0.8242 | 0.1052 | 0.4508 | 0.5727 | 0.1374 | 0.7443 | 0.7977 | 0.1238 |
| Sa2023CVPR | 0.6133 | 0.6621 | 0.1744 | 0.5674 | 0.5867 | 0.1511 | 0.3156 | 0.4422 | 0.1711 | 0.5250 | 0.5775 | 0.2602 |
| Qin2023AAAI | 0.7405 | 0.7570 | 0.1327 | 0.7671 | 0.7951 | 0.1149 | 0.4305 | 0.5191 | 0.1427 | 0.6570 | 0.6973 | 0.1469 |
| Agnolucci2024WACV | 0.6710 | 0.7351 | 0.1674 | 0.7057 | 0.7603 | 0.1646 | 0.5839 | 0.6044 | 0.1322 | 0.6739 | 0.7129 | 0.1562 |
| Proposed | 0.8911 | 0.9770 | 0.0630 | 0.7857 | 0.8396 | 0.0982 | 0.6166 | 0.7339 | 0.1090 | 0.7540 | 0.8612 | 0.1126 |
4.4 Quantitative Experiments
Comparison Experiments. To demonstrate the overall performance of the model, we quantitatively compared kgMBQA with ten representative blind IQA methods, including Zhu2020CVPR [Zhu et al., 2020], Su2020CVPR [Su et al., 2020], Zhang2021TIP [Zhang et al., 2021], Madhusudana2022TIP [Madhusudana et al., 2022], Golestaneh2022WACV [Golestaneh et al., 2022], Yang2022CVPR [Yang et al., 2022], Sa2023CVPR [Saha et al., 2023], Qin2023AAAI [Qin et al., 2023], Wang2023AAAI [Wang et al., 2023], and Agnolucci2024WACV [Agnolucci et al., 2024]. As shown in Table 2, our kgMBQA demonstrates stable performance on different datasets, predicting the Method (a): Quality Knowledge Graph-based Prompt for LLaMa quality scores of authentic and synthetic images more accurately. In addition, Table 3 provides the cross-dataset results, demonstrating the robust performance of our kgMBQA.
| (1) | (2) | (3) | KonIQ-10k | LIVE-Challenge | ||||
|---|---|---|---|---|---|---|---|---|
| SRCC | PLCC | RMSE | SRCC | PLCC | RMSE | |||
| - | - | - | 0.9070 | 0.9352 | 0.0620 | 0.7658 | 0.7945 | 0.1264 |
| ✓ | - | ✓ | 0.9464 | 0.9688 | 0.0433 | 0.8958 | 0.9419 | 0.0990 |
| ✓ | ✓ | - | 0.9390 | 0.9607 | 0.0498 | 0.8391 | 0.9087 | 0.1230 |
| ✓ | ✓ | ✓ | 0.9442 | 0.9614 | 0.0480 | 0.9019 | 0.9486 | 0.0933 |
Ablation Study. To demonstrate the effectiveness of each module, we have performed additional ablation study, which includes separately removing the explanatory text generation module (Llama3.2-11B) and removing the multimodal feature fusion module. Finally, we tested the performance of the single image modality to verify the superiority of image-text modalities. Table 4 validates the effectiveness of each module in kgMBQA. Performance after removing a module is indicated by different symbols, where '-' indicates the module is removed, and '✓' indicates the module is retained.
4.5 Explanatory Text Experiment
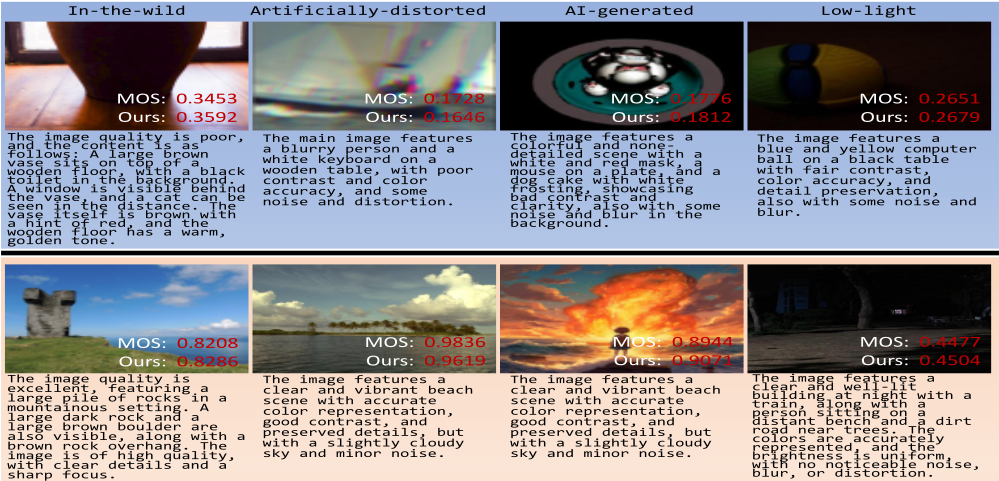
To verify the effectiveness of explanatory text in interpreting objective scores, we present some quality prediction results of four representative types of images (e.g., In-the-Wild, Artificially-distorted, AI-generated, and Low-light) in Figure 4, including objective scores and corresponding explanatory text. We can see that when the input images with lower scores correspond to explanatory text indicating poor quality, such as 'bad', 'poor', 'blur', 'noise', etc. When the input image has extremely lower quality, containing words like 'significant', 'noticeable' to emphasize the distortion. Higher quality images include words like 'good', 'excellent', 'clear', and 'accurate'.
Furthermore, we compare the differences in the explanatory texts generated by three different methods under prompts of varying complexity levels as shown in Figure 5. The comparison results consists of three different settings on two popular large language models including Llama and GPT-4V. The prompts are divided into two types: 1) the simple one is a question: 'Please describe the quality of this picture.', and the complex one, by incorporating the Chain-of-Thought (CoT), guides the model to decompose the task of generating quality-related texts. When using relatively simple prompts, we observe that both Llama and GPT-4V exhibit a strong hallucination phenomenon, containing a large amount of redundant words. In contrast, with the quality knowledge graph, the hallucination phenomenon is effectively mitigated. Moreover, the output text is more in line with the requirements, with its content closely related to the quality description.
5 Conclusion
In this paper, we propose a multimodal blind image assessment method with explanatory text descriptions for predicting quality scores, called kgMBQA. By constructing the quality knowledge graph, we provide more comprehensive textual information for image quality assessment. Additionally, we design a multimodal blind quality model that forecasts quality prediction scores with explanatory quality texts. Experimental results demonstrate that our proposed kgMBQA achieves stable prediction performance on the KonIQ-10k,LIVE Challenge, BIQ2021, TID2013, and AIGC-3K datasets.
Acknowledgements
This work was supported in part by the National Natural Science Foundation of China under Grant 62472290 and Grant 62372306, in part by the Natural Science Foundation of Guangdong Province under Grant 2024A1515011972 and Grant 2023A1515011197, and in part by the Research and Application of Key Technologies for Building a Livable, Friendly and Smart Community Service Platform under Grant CSCEC-2024-Z-30.
@inproceedings{ijcai2025p473,
  title     = {kgMBQA: Quality Knowledge Graph-driven Multimodal Blind Image Assessment},
  author    = {Xie, Wuyuan and Bian, Tingcheng and Wang, Miaohui},
  booktitle = {Proceedings of the Thirty-Fourth International Joint Conference on
               Artificial Intelligence, {IJCAI-25}},
  publisher = {International Joint Conferences on Artificial Intelligence Organization},
  editor    = {James Kwok},
  pages     = {4245--4253},
  year      = {2025},
  month     = {8},
  note      = {Main Track},
  doi       = {10.24963/ijcai.2025/473},
  url       = {https://doi.org/10.24963/ijcai.2025/473},
}
TY - CPAPER TI - kgMBQA: Quality Knowledge Graph-driven Multimodal Blind Image Assessment AU - Xie, Wuyuan AU - Bian, Tingcheng AU - Wang, Miaohui T2 - Proceedings of the Thirty-Fourth International Joint Conference on Artificial Intelligence, IJCAI-25 PB - International Joint Conferences on Artificial Intelligence Organization PY - 2025 SP - 4245 EP - 4253 DO - 10.24963/ijcai.2025/473 UR - https://doi.org/10.24963/ijcai.2025/473 ER -Copied
Machine-readable versions of this paper, for tools and AI agents:





