
scSiameseClu: A Siamese Clustering Framework for Interpreting Single-cell RNA Sequencing Data
Proceedings of the Thirty-Fourth International Joint Conference on Artificial Intelligence. Main Track. Pages 7867-7875.
https://doi.org/10.24963/ijcai.2025/875
Keywords
- Machine Learning: ML: Applications
- Data Mining: DM: Applications
- Multidisciplinary Topics and Applications: MTA: Bioinformatics
Abstract
Single-cell RNA sequencing (scRNA-seq) reveals cell heterogeneity, with cell clustering playing a key role in identifying cell types and marker genes. Recent advances, especially graph neural networks (GNNs)-based methods, have significantly improved clustering performance. However, the analysis of scRNA-seq data remains challenging due to noise, sparsity, and high dimensionality. Compounding these challenges, GNNs often suffer from over-smoothing, limiting their ability to capture complex biological information. In response, we propose scSiameseClu, a novel Siamese Clustering framework for interpreting single-cell RNA-seq data, comprising of 3 key steps: (1) Dual Augmentation Module, which applies biologically informed perturbations to the gene expression matrix and cell graph relationships to enhance representation robustness; (2) Siamese Fusion Module, which combines cross-correlation refinement and adaptive information fusion to capture complex cellular relationships while mitigating over-smoothing; and (3) Optimal Transport Clustering, which utilizes Sinkhorn distance to efficiently align cluster assignments with predefined proportions while maintaining balance. Comprehensive evaluations on seven real-world datasets demonstrate that scSiameseClu outperforms state-of-the-art methods in single-cell clustering, cell type annotation, and cell type classification, providing a powerful tool for scRNA-seq data interpretation.
- [Bo et al., 2020] Deyu Bo, Xiao Wang, Chuan Shi, Meiqi Zhu, Emiao Lu, and Peng Cui. Structural deep clustering network. In Proceedings of the web conference 2020, pages 1400-1410, 2020.
- [Butler et al., 2018] Andrew Butler, Paul Hoffman, Peter Smibert, Efthymia Papalexi, and Rahul Satija. Integrat- ing single-cell transcriptomic data across different condi- tions, technologies, and species. Nature biotechnology, 36(5):411-420, 2018.
- [Cheng and Ma, 2022] Yi Cheng and Xiuli Ma. scgac: a graph attentional architecture for clustering single-cell rna- seq data. Bioinformatics, 38(8):2187-2193, 2022.
- [Ciortan and Defrance, 2022] Madalina Ciortan and Matthieu Defrance. Gnn-based embedding for clustering scrna-seq data. Bioinformatics, 38(4):1037-1044, 2022.
- [Ding et al., 2018] Jiarui Ding, Anne Condon, and Sohrab P Shah. Interpretable dimensionality reduction of single cell transcriptome data with deep generative models. Nature communications, 9(1):2002, 2018.
- [Ding et al., 2022] Kaize Ding, Zhe Xu, Hanghang Tong, and Huan Liu. Data augmentation for deep graph learning: A survey. ACM SIGKDD Explorations Newsletter, 24(2):61- 77, 2022.
- [Eraslan et al., 2019] Gökcen Eraslan, Lukas M Simon, Maria Mircea, Nikola S Mueller, and Fabian J Theis. Single- cell rna-seq denoising using a deep count autoencoder. Na- ture communications, 10(1):390, 2019.
- [Fuglede and Topsoe, 2004] Bent Fuglede and Flemming Topsoe. Jensen-shannon divergence and hilbert space em- bedding. In International symposium onInformation theory, 2004. ISIT 2004. Proceedings., page 31. IEEE, 2004.
- [Gan et al., 2022] Yanglan Gan, Xingyu Huang, Guobing Zou, Shuigeng Zhou, and Jihong Guan. Deep structural clustering for single-cell rna-seq data jointly through au- toencoder and graph neural network. Briefings in Bioinfor- matics, 23(2):bbac018, 2022.
- [Haghverdi et al., 2016] Laleh Haghverdi, Maren Büttner, F Alexander Wolf, Florian Buettner, and Fabian J Theis. Diffusion pseudotime robustly reconstructs lineage branch- ing. Nature methods, 13(10):845-848, 2016.
- [Hassani and Khasahmadi, 2020] Kaveh Hassani and Amir Hosein Khasahmadi. Contrastive multi-view repre- sentation learning on graphs. In International conference on machine learning, pages 4116-4126. PMLR, 2020.
- [Horn, 1990] Roger A Horn. The hadamard product. In Proc. Symp. Appl. Math, volume 40, pages 87-169, 1990.
- [Kiselev et al., 2019] Vladimir Yu Kiselev, Tallulah S An- drews, and Martin Hemberg. Challenges in unsupervised clustering of single-cell rna-seq data. Nature Reviews Ge- netics, 20(5):273-282, 2019.
- [Levine et al., 2015] Jacob H Levine, Erin F Simonds, Sean C Bendall, Kara L Davis, D Amir El-ad, Michelle D Tadmor, Oren Litvin, Harris G Fienberg, Astraea Jager, Eli R Zunder, et al. Data-driven phenotypic dissection of aml reveals progenitor-like cells that correlate with prognosis. Cell, 162(1):184-197, 2015.
- [Liu et al., 2022] Yue Liu, Wenxuan Tu, Sihang Zhou, Xin- wang Liu, Linxuan Song, Xihong Yang, and En Zhu. Deep graph clustering via dual correlation reduction. In Pro- ceedings of the AAAI conference on artificial intelligence, volume 36, pages 7603-7611, 2022.
- [Lopez et al., 2018] Romain Lopez, Jeffrey Regier, Michael B Cole, Michael I Jordan, and Nir Yosef. Deep generative modeling for single-cell transcriptomics. Nature methods, 15(12):1053-1058, 2018.
- [Lu et al., 2022] Jianchao Lu, Yuzhe Tian, Shuang Wang, Michael Sheng, and Xi Zheng. Pearnet: A pearson correlation-based graph attention network for sleep stage recognition. In 2022 IEEE 9th International Conference on Data Science and Advanced Analytics (DSAA), pages 1-8. IEEE, 2022.
- [Luo et al., 2021] Zixiang Luo, Chenyu Xu, Zhen Zhang, and Wenfei Jin. A topology-preserving dimensionality reduc- tion method for single-cell rna-seq data using graph autoen- coder. Scientific reports, 11(1):20028, 2021.
- [Ning et al., 2022] Zhiyuan Ning, Pengfei Wang, Pengyang Wang, Ziyue Qiao, Wei Fan, Denghui Zhang, Yi Du, and Yuanchun Zhou. Graph soft-contrastive learning via neigh- borhood ranking. arXiv preprint arXiv:2209.13964, 2022.
- [Ning et al., 2025] Zhiyuan Ning, Zaitian Wang, Ran Zhang, Ping Xu, Kunpeng Liu, Pengyang Wang, Wei Ju, Pengfei Wang, Yuanchun Zhou, Erik Cambria, et al. Deep cut- informed graph embedding and clustering. arXiv preprint arXiv:2503.06635, 2025.
- [Page et al., 1998] Lawrence Page, Sergey Brin, Rajeev Mot- wani, and Terry Winograd. The pagerank citation ranking: Bring order to the web. Technical report, Technical report, stanford University, 1998.
- [Park and Zhao, 2018] Seyoung Park and Hongyu Zhao. Spectral clustering based on learning similarity matrix. Bioinformatics, 34(12):2069-2076, 2018.
- [Shapiro et al., 2013] Ehud Shapiro, Tamir Biezuner, and Sten Linnarsson. Single-cell sequencing-based technolo- gies will revolutionize whole-organism science. Nature Reviews Genetics, 14(9):618-630, 2013.
- [Sinkhorn, 1967] Richard Sinkhorn. Diagonal equivalence to matrices with prescribed row and column sums. The American Mathematical Monthly, 74(4):402-405, 1967.
- [Strehl and Ghosh, 2002] Alexander Strehl and Joydeep Ghosh. Cluster ensembles-a knowledge reuse framework for combining multiple partitions. Journal of machine learning research, 3(Dec):583-617, 2002.
- [Tian et al., 2019] Tian Tian, Ji Wan, Qi Song, and Zhi Wei. Clustering single-cell rna-seq data with a model-based deep learning approach. Nature Machine Intelligence, 1(4):191- 198, 2019.
- [Tian et al., 2021] Tian Tian, Jie Zhang, Xiang Lin, Zhi Wei, and Hakon Hakonarson. Model-based deep embedding for constrained clustering analysis of single cell rna-seq data. Nature communications, 12(1):1873, 2021.
- [Tu et al., 2021] Wenxuan Tu, Sihang Zhou, Xinwang Liu, Xifeng Guo, Zhiping Cai, En Zhu, and Jieren Cheng. Deep fusion clustering network. In Proceedings of the AAAI Conference on Artificial Intelligence, volume 35, pages 9978-9987, 2021.
- [Van der Maaten and Hinton, 2008] Laurens Van der Maaten and Geoffrey Hinton. Visualizing data using t-sne. Journal of machine learning research, 9(11), 2008.
- [Van Dijk et al., 2018] David Van Dijk, Roshan Sharma, Juozas Nainys, Kristina Yim, Pooja Kathail, Ambrose J Carr, Cassandra Burdziak, Kevin R Moon, Christine L Chaffer, Diwakar Pattabiraman, et al. Recovering gene interactions from single-cell data using data diffusion. Cell, 174(3):716-729, 2018.
- [Vinh et al., 2009] Nguyen Xuan Vinh, Julien Epps, and James Bailey. Information theoretic measures for clus- terings comparison: is a correction for chance necessary? In Proceedings of the 26th annual international conference on machine learning, pages 1073-1080, 2009.
- [Wan et al., 2022] Hui Wan, Liang Chen, and Minghua Deng. scname: neighborhood contrastive clustering with ancil- lary mask estimation for scrna-seq data. Bioinformatics, 38(6):1575-1583, 2022.
- [Wang et al., 2018] Bo Wang, Daniele Ramazzotti, Luca De Sano, Junjie Zhu, Emma Pierson, and Serafim Bat- zoglou. Simlr: A tool for large-scale genomic analyses by multi-kernel learning. Proteomics, 18(2):1700232, 2018.
- [Wang et al., 2021a] Hai-Yun Wang, Jian-ping Zhao, and Chun-Hou Zheng. Suscc: secondary construction of feature space based on umap for rapid and accurate clustering large- scale single cell rna-seq data. Interdisciplinary Sciences: Computational Life Sciences, 13:83-90, 2021.
- [Wang et al., 2021b] Juexin Wang, Anjun Ma, Yuzhou Chang, Jianting Gong, Yuexu Jiang, Ren Qi, Cankun Wang, Hongjun Fu, Qin Ma, and Dong Xu. scgnn is a novel graph neural network framework for single-cell rna-seq analyses. Nature communications, 12(1):1882, 2021.
- [Wang et al., 2021c] Zhaokang Wang, Yunpan Wang, Chun- feng Yuan, Rong Gu, and Yihua Huang. Empirical analysis of performance bottlenecks in graph neural network train- ing and inference with gpus. Neurocomputing, 446:165- 191, 2021.
- [Wang et al., 2024] Zaitian Wang, Pengfei Wang, Kunpeng Liu, Pengyang Wang, Yanjie Fu, Chang-Tien Lu, Charu C Aggarwal, Jian Pei, and Yuanchun Zhou. A compre- hensive survey on data augmentation. arXiv preprint arXiv:2405.09591, 2024.
- [Wang et al., 2025] Pengfei Wang, Wenhao Liu, Jiajia Wang, Yana Liu, Pengjiang Li, Ping Xu, Wentao Cui, Ran Zhang, Qingqing Long, Zhilong Hu, et al. sccompass: An inte- grated multi-species scrna-seq database for ai-ready. Ad- vanced Science, page 2500870, 2025.
- [Xie et al., 2016] Junyuan Xie, Ross Girshick, and Ali Farhadi. Unsupervised deep embedding for clustering anal- ysis. In International conference on machine learning, pages 478-487. PMLR, 2016.
- [Xu et al., 2024] Ping Xu, Zhiyuan Ning, Meng Xiao, Guihai Feng, Xin Li, Yuanchun Zhou, and Pengfei Wang. sccdcg: Efficient deep structural clustering for single-cell rna-seq via deep cut-informed graph embedding. In International Conference on Database Systems for Advanced Applica- tions, pages 172-187. Springer, 2024.
- [Zbontar et al., 2021] Jure Zbontar, Li Jing, Ishan Misra, Yann LeCun, and Stéphane Deny. Barlow twins: Self- supervised learning via redundancy reduction. In Inter- national conference on machine learning, pages 12310- 12320. PMLR, 2021.
- [Zhan et al., 2023] Youlin Zhan, Jiahan Liu, and Le Ou-Yang. scmic: a deep multi-level information fusion framework for clustering single-cell multi-omics data. IEEE Journal of Biomedical and Health Informatics, 2023.
- [Žurauskienė and Yau, 2016] Justina Žurauskienė and Christopher Yau. pcareduce: hierarchical clustering of single cell transcriptional profiles. BMC bioinformatics, 17:1-11, 2016.
References were extracted automatically from the PDF and may contain errors.
Full text extracted automatically from the PDF; figures, tables and equations may differ. The PDF is the version of record.
1 Introduction
Single-cell RNA sequencing (scRNA-seq) technology represents a significant advancement in bioinformatics, enabling the capture of comprehensive genetic information from individual cells [Shapiro et al., 2013]. Cell clustering, a key step in single-cell RNA sequencing analysis, groups cells by their gene expression patterns to uncover the complex characteristics of distinct cell populations and provide insights into their biological functions and interactions [Kiselev et al., 2019]. Moreover, clustering gene expression patterns further contributes to various downstream tasks, such as marker gene identification and cell type annotation [Haghverdi et al., 2016]. Cluster analysis of scRNA-seq data has been a vibrant research area over the past decade.
* Corresponding authors.
† Code and datasets are all available at the link: https://github.com/ XPgogogo/scSiameseClu.
In recent years, advanced computational methods have been increasingly explored to address the challenges of analyzing high-dimensional and sparse scRNA-seq data. Classical clustering methods, such as K-means, are straightforward and computationally efficient but struggle to capture the complex, nonlinear relationships in scRNA-seq data. Meanwhile, recent research has focused on applying deep learning frameworks for learning representations of scRNA-seq data and classifying samples into distinct clusters. A commonly used method is self-supervised learning methods, which uncover effective representations of scRNA-seq data by reconstructing the original input data [Eraslan et al., 2019; Lopez et al., 2018; Tian et al., 2019]. However, these methods primarily focus on extracting features from individual cells, overlooking the complex relationships between cells that are essential for understanding cellular diversity. Benefiting from the powerful utilization of graph information, graph neural networks (GNNs) have been applied to analyze scRNA-seq data by modeling cells as nodes and their interactions as edges, effectively capturing both gene expressions and cell graphs to comprehensively represent cellular heterogeneity [Wang et al., 2021b; Gan et al., 2022; Zhan et al., 2023].
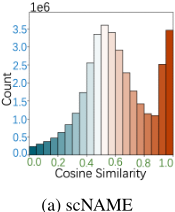
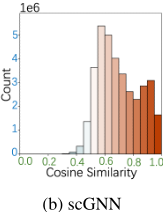
Though good performance has been achieved, previous GNN-based works still face limitations when tackling the following challenges: (1) Deficient exploration on intercellular information: when applying GNN-based models to singlecell data, the graph construction process often overlooks the sparsity and noise inherent in scRNA-seq data, frequently leading to reduced model robustness. Most current methods rely on simple topologies, like cosine similarity, to build cell graphs from gene expression matrices [Gan et al., 2022; Wang et al., 2021c], but do not handle the sparsity and noise inherent in scRNA-seq data. This leads to fragile graph representations, weakening GNNs' ability to capture cellular interactions and limiting clustering performance and insights into cellular dynamics. (2) Insufficient prevention of representation collapse in cell embeddings: GNNs-based models for scRNA-seq data frequently encounter representation collapse, where embeddings of biologically distinct cells become overly similar in latent space. This issue arises from the inability of current methods to preserve the diversity of cell representations in sparse and noisy scRNA-seq data. As shown in Fig.1, both the deep learning-based scNAME [Wan et al., 2022] and the GNN-based scGNN [Wang et al., 2021b] exhibit varying degrees of representation collapse. The problem is more pronounced in scGNN, where the cosine similarity between almost all cell embeddings exceeds 0.5, indicating a severe loss of diversity in cell embeddings. Such collapse diminishes the discriminative power of embeddings, blurring cluster boundaries and limiting the ability to distinguish different cell populations, ultimately degrading the effectiveness of GNN models in clustering tasks [Zbontar et al., 2021].
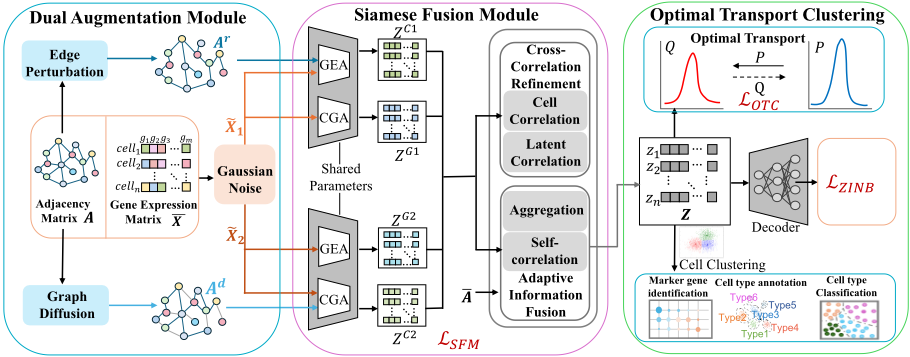
To tackle the aforementioned challenge, we propose scSiameseClu, a Siamese Clustering framework for interpreting single-cell RNA sequencing data. scSiameseClu is designed to capture and refine complex intercellular information while learning discriminative and robust representations across both gene and cellular features. scSiameseClu leverages three key components: dual augmentation module to enrich data, siamese fusion module to preserve critical information and reduce redundancy, and optimal transport clustering to align cluster distributions. It effectively explores intricate information, mitigates representation collapse, and achieves clearer cell population separation, excelling in scRNA-seq clustering and other biological tasks.
Our framework offers the following contributions:
- We present scSiameseClu, a novel Siamese-based clustering framework tailored for scRNA-seq data that captures intricate information from gene expression and cell graphs to learn discriminative and robust cell embeddings, improving clustering outcomes and downstream tasks.
- We introduce key components: (i) dual augmentation
- with distinct noise on gene expression and cell graphs to mitigate dropout effects and improve robustness; (ii) siamese fusion for cross-correlation and adaptive information fusion to enhance robustness; and (iii) optimal transport clustering to align distributions.
- Experimental results on seven datasets demonstrate that scSiameseClu outperforms state-of-the-art (SOTA) methods in clustering and other biological tasks.
2 RelatedWork
Deep Clustering for scRNA-seq. In scRNA-seq data analysis, early clustering algorithms like Phenograph [Levine et al., 2015], MAGIC [Van Dijk et al., 2018], and Seurat [Wang et al., 2025] utilize k-nearest neighbor (KNN) graphs to model cell relationships, while SIMLR [Wang et al., 2018] and MPSSC [Park and Zhao, 2018] employ multiple kernel functions to derive robust similarity measures from different data representations. These methods, however, often struggle with high-dimensional data and complex nonlinear features, making them susceptible to noise. Deep learning approaches have since become prominent. DCA [Eraslan et al., 2019] employs a Zero-Inflated Negative Binomial (ZINB) autoencoder to model scRNA-seq data distributions, capturing nonlinear gene dependencies. SCVI [Lopez et al., 2018] and SCVIS [Ding et al., 2018], which rely on autoencoders for dimensionality reduction, often face over-regularization due to their Gaussian distribution assumption. Additionally, scDeepCluster [Tian et al., 2019] combines ZINB-based autoencoders with deep embedding clustering to optimize feature learning and clustering. Most approaches ignore inter-gene and inter-cell correlations, focusing solely on individual cell expression profiles.
Graph Clustering for scRNA-seq. Recently, graph-based clustering methods have gained considerable attention for their effectiveness [Tu et al., 2021; Liu et al., 2022; Ning et al., 2025]. Methods like scGAE [Luo et al., 2021] and graphsc [Ciortan and Defrance, 2022] utilize graph autoencoders to embed scRNA-seq data while preserving topological structures. scGAC [Cheng and Ma, 2022] constructs cell graphs and employs a self-optimization approach for simultaneous representation learning and clustering. Notably, scGNN [Wang et al., 2021b] uses GNNs and multi-modal autoencoders to aggregate cell-cell relationships and model gene expression patterns, while scDSC [Gan et al., 2022] combines a ZINB model-based autoencoder with GNN modules using a mutually supervised strategy. These methods often struggle with representation collapse, severely limiting their ability to accurately model cell relationships.
3 Methodology
This section introduces the proposed scSiameseClu, including the highlighted dual augmentation module, siamese fusion module, optimal transport clustering. More details are provided in the supplementary material, e.g., gene expression autoencoders (GEAs) and cell graph autoencoders (CGAs).
3.1 ProblemFormulation
Given a single-cell expression matrix X ∈ RN×D , where xij (1 ≤ i ≤ N, 1 ≤ j ≤ D) shows the expression of the jth gene in the i-th cell. We construct an undirected graph GC = (V, E) using KNN based on the gene expression matrix, where V = {v1, v2, · · · , vN} is the set of N nodes, E is the set of edges. Each node corresponds to a single cell, and edges indicate similarity between cells, quantified with the Pearson Correlation Coefficient [Ding et al., 2022; Lu et al., 2022]. The KNN graph is defined with the preprocessed data matrix ¯X, as specified in Section 4.1, and adjacency matrix A = (aij)N×N, where aij = 1 if vi and vj are connected, and aij = 0, otherwise. The associated degree matrix is D = diag(d1, d2, · · · , dN) ∈ RN×N , where di = ∑(vi,vj)∈E aij represents the degree of node vi. To account for self-loops and normalize the adjacency matrix, we compute ˜A ∈ RN×N as D-1 (A+ I), where I ∈ RN×N is the identity matrix. Our goal is to partition the graph GC into C categories by assigning each node vi ∈ V to one of the C categories based on E and gene expression features.
3.2 Framework Overview
We propose scSiameseClu, an enhanced graph autoencoderbased siamese clustering framework for interpreting scRNAseq data. We aim to improve the performance of scRNA-seq clustering and related downstream tasks by learning more accurate and distinctive cell embeddings. As Fig. 2 shows, our framework consists of three components: (i) a dual augmentation module that enhances the gene expression matrix and the cell graph relationships; (ii) a siamese fusion module to map the augmented data into a lower-dimensional latent space, generating cell embeddings; and (iii) an optimal transport clustering strategy for self-supervision learning, which refines the latent representations and generates clustering assignments.
3.3 Dual AugmentationModule
To enhance robustness against noise and generalization across diverse datasets, biologically plausible augmentations are introduced at both gene and cell levels. These augmentations capture the variation in scRNA-seq, helping the model extract biologically meaningful representations.
Gene Expression Augmentation. To enhance robustness at the gene level, biologically plausible augmentations are introduced by adding controlled noise to the gene expression profiles. Specifically, Gaussian noise is applied to simulate natural variability in gene expression. Let ⊙ denote the Hadamard product [Horn, 1990], and N ∈ RN×D represent a random noise matrix drawn from a Gaussian distribution N(1, 0.1).
The augmented gene expression matrix ˜X is computed as:
as illustrated in Fig. 2, two augmented gene expression matrices, ˜X1 and ˜X2, were generated using Gaussian distributions with distinct parameters.
Cell Graph Augmentation. Cell graph augmentation aims to improve model robustness and enhance representation learning by introducing perturbations to the cell graph, specifically through edge perturbation and graph diffusion [Wang et al., 2024]. These two strategies provide distinct, yet complementary, perspectives on the cell graph, enabling the model to capture diverse interactions between cells.
(i) Edge perturbation. We employ an edge removal strategy to refine the cell graph while preserving the most meaningful and biologically relevant relationships. Removing weaker edges reduces graph noise and improves model robustness. In contrast, edge addition is avoided to prevent spurious connections that may distort the graph and compromise its biological validity. Specifically, a mask matrix M ∈ RN×N is constructed based on the pairwise cosine similarity matrix computed in the latent space. The 10% of edges with the lowest similarity values are identified and removed using this mask. Finally, the adjacency matrix Ar ∈ RN×N is normalized for proper scaling, calculated as:
(ii) Graph diffusion. We use a graph diffusion strategy to refine the cell graph by enhancing meaningful relationships between cells [Hassani and Khasahmadi, 2020]. Specifically, the normalized adjacency matrix is transformed into a diffusion adjacency matrix using the Personalized PageRank (PPR) algorithm [Page et al., 1998]. The teleport probability controls information propagation across the graph, helping to emphasize biologically meaningful relationships. The diffusion adjacency matrix Ad would be computed as:
Thus, we define two distinct adjacency matrices, Ar and Ad , from edge perturbation and graph diffusion, respectively.
3.4 Siamese FusionModule
We propose the Siamese Fusion Module (SFM), a novel framework that integrates cross-correlation refinement and adaptive information fusion to learn discriminative and robust sample representations and avoid the over-smoothing issue of GNN-based methods [Ning et al., 2022]. By minimizing the deviation of cross-correlation matrices from the ideal identity matrix across cells and genes and adaptive information fusion, SFM effectively reduces redundancy while preserving critical information [Zbontar et al., 2021; Tu et al., 2021; Liu et al., 2022]. This enhances the cell representations and avoids representation collapse, enabling more accurate cell population separation and improving clustering performance. Cross-Correlation Refinement. The cross-correlation refinement process is designed to effectively encode and integrate the augmented data from genes and cells, ensuring the information from different augmentations is unified. We construct two gene expression autoencoders (GEAs) to process the augmented gene expression matrices ˜X1 and ˜X2, generating gene expression embeddings ZG1 ∈ RN×d and ZG2 ∈ RN×d , where d represents the latent embedding dimensionality. Similarly, we construct two cell graph autoencoders (CGAs) to process the augmented cell graph matrices ˜X1,Ar and ˜X2,Ad , producing cell graph embeddings ZC1 ∈ RN×d and ZC2 ∈ RN×d .
Cell Correlation Refinement. Cell correlation refinement (CCR) optimizes cell relationships across different augmented views by aligning corresponding embeddings and reducing redundant correlations. We can calculate the refined
To ensure the cell correlation matrix RC1 , RC2 aligns with an identity matrix IC ∈ RN×N , we minimize loss:
By ensuring the diagonal elements of RC1 , RC2 are equal to 1 and the off-diagonal elements are equal to 0, we can guarantee the alignment of embeddings for each view and minimize the consistency of embeddings for different cells across different views. This helps scSiameseClu reduce redundant information and learn more discriminative representations.
Latent Correlation Refinement. Similarly, latent correlation refinement (LCR) optimizes relationships between latent embeddings across different augmented views by aligning corresponding embeddings. First, we project gene expression embeddings ZG1 and ZG2 into ˜ZG1 and ˜ZG2 ∈ Rd×K with using a readout function R(·) : Rd×N → Rd×K , formulated as ˜ZG1 = R ((ZG1 )T), ˜ZG1 = R ((ZG2 )T). Likewise, we can project cell graph embeddings ZC1 and ZC2 into ˜ZC1 = R ((ZC1 )T) and ˜ZC2 = R ((ZC2 )T).
Then we can calculate the refine latent correlation matrix by RL1 ij = ( ˜ZG1 i )( ˜ZG2 j )T ∥˜ZG1 i ∥∥˜ZG2 j ∥ ,RL2 ij = ( ˜ZC1 i )( ˜ZC2 j )T ∥˜ZC1 i ∥∥˜ZC2 j ∥ , ∀i, j ∈ [1, d], which denotes the correlation between the embeddings learned from enhanced gene expression matrix.
To ensure the latent correlation matrix RL1 ,RL2 aligns with an identity matrix IL ∈ Rd×d , we minimize the loss:
Adaptive Information Fusion. To enhance clustering performance, we propose an adaptive information fusion mechanism that integrates cell relationships through embedding aggregation, self-correlation learning, and dynamic recombination. We first aggregate the embeddings achieved with GEA and CGA with a linear combination operation:
Then, we apply a graph convolution-like operation (i.e., message passing) to process the combined information, enhancing the initial fused embedding ZA ∈ RN×d . Specifically, we enhance ZA by propagating cell graph ˜A, i.e., ZE = ˜AZA. To capture the relationships among cell graphs in the enhanced embedding space, we compute a normalized self-correlation matrix RS ∈ RN×N . Each element of RS is defined as
RS encodes the relative similarity between cells, providing a mechanism to model relationships in the embedding space. Thus, we can recombine the embedding matrix ZE to dynamically adjust the embedding representations. Specifically, the recombined embedding matrix ZR is computed as ZR = RSZE . Each cell integrates information from others through learned relationships, enhancing embeddings for clustering.
To preserve the initial fused embedding information while incorporating the recombined embeddings, we adopt a skip connection to fuse ZE and ZR. The final clustering-oriented latent embeddings Z ∈ RN×d are computed as:
where β is a learnable scale parameter, initialized to 0 and updated during training. This fusion mechanism effectively filters out redundant information and preserves discriminative features in the latent space, enabling the network to learn robust and meaningful representations that enhance clustering performance while avoiding representation collapse.
Propagated Regularization. The reconstruction loss, LREC minimizes the joint mean square error (MSE) of reconstruction loss of gene expression and cell graph matrix. To further enhance representation quality, we introduce a propagation regularization. Drawing inspiration from [Liu et al., 2022], formulated as follows:
where JSD(·) refers the Jensen-Shannon divergence [Fuglede and Topsoe, 2004]. Utilizing Eq. 8, the network can capture long-range dependencies even with a shallow network architecture, thereby reducing over-smoothing as the propagated information deepens within the framework. Finally, the overall objective of the SFM module can be computed by:
where γ is a trade-off parameter balancing the contribution of the propagation regularization.
3.5 Optimal Transport Clustering
We utilize a self-supervised method to perform unsupervised clustering of scRNA-seq data [Xie et al., 2016], which learn directly from the data without requiring labeled inputs. Specifically, we employ Student's t-distribution [Van der Maaten and Hinton, 2008] as a kernel function to measure the similarity qij between each cell embedding hi and the cluster center cj. By assigning higher weights to closer points, this method effectively captures the non-linear relationships in scRNA-seq data. The assignment distribution is represented as a matrix Q = [qij ], where each element indicates the probability or similarity between sample i and cluster center j. To further refine clustering, we compute a target distribution matrix P = [pij], which sharpens the soft assignments in Q by emphasizing high-confidence samples. This sharpening process improves cluster separation and ensures well-defined clusters. The clustering process is optimized by minimizing the divergence between Q and P , iteratively refining results to group similar cells and separate dissimilar ones. In the target distribution P , each assignment in Q is squared and normalized to enhance assignment confidence [Bo et al., 2020].
To avoid degenerate solutions that would allocate all data points to a single label, we establish constraints that synchronize the label distribution with the mixing proportions. This ensures that each cell contributes equally to the loss calculation, improving clustering accuracy and preserving a balanced effect during learning process. We construct the target probability matrix P using the following optimal transport strategy to ensure this alignment and enhance the robustness of our clustering outcomes:
In this context, we regard the target distribution P as the transport plan matrix derived from optimal transport theory, while -logQ serves as the cost matrix. We impose the constraint P T 1N = Nπ, where π indicates the proportion of cells assigned to each cluster, estimated from intermediate clustering results. Thus, we can ensure that the resulting cluster distribution aligns with the defined mixing proportions. Given the substantial computational expense associated with direct optimization techniques, we utilize the Sinkhorn distance [Sinkhorn,
1967] to facilitate quicker optimization through an entropic constraint. The optimization problem, which includes a Lagrange multiplier for the entropy constraint is formulated as:
where H is the entropy function measuring uncertainty in the distribution, and λ is the smoothness parameter that maintains cluster balance. The transport plan P is guaranteed to exist and be unique, with the solution efficiently obtained through Sinkhorn's method [Sinkhorn, 1967] as follows:
at each iteration t, u(t) is updated as 1N/(Qλv(t-1) ) and v is calculated as Nπ/(Qλu(t) ). We begin with the initial value set as v(0) = 1N. Upon convergence, the optimal transport plan matrix ˆ P is obtained.
During training, ˆ P is fixed and Q is aligned with ˆ P. This alignment is crucial for evaluating model performance, allowing us to define the clustering loss function as follows:
3.6 Joint Optimization
The Zero-Inflated Negative Binomial (ZINB) loss LZINB is commonly used to handle the sparsity and overdispersion of scRNA-seq data by modeling excess zeros and variability, ensuring accurate data reconstruction [Eraslan et al., 2019]. Thus, in the proposed method, the overall optimization objective consists of three parts: the SFM loss, the OTC loss, and the ZINB loss, which are formulated as:
where the hyperparameters ρ and σ balance the components, facilitating effective embedding learning and clustering.
4 Experiments
In this section, we first validate our method through extensive experiments, demonstrating its superior performance in scRNA-seq clustering. We then show that the embeddings generated by our method effectively mitigate the embedding collapse issue in graph-based models. We also evaluate its utility in downstream tasks, like cell type annotation.
4.1 Experimental Setup
Dataset Preprocessing. We evaluated scSiameseClu on seven real scRNA-seq datasets. First, genes expressed in fewer than three cells were filtered out, followed by normalization, logtransformed (logTPM), and selection of highly variable genes based on predefined mean and dispersion thresholds. Finally, the preprocessed data were used as input.
Baseline Methods. To verify the superior performance of the proposed approach, we compare it against nine competing SOTA clustering methods. Among them, pcaReduce [Žurauskien˙e and Yau, 2016] and SUSSC [Wang et al., 2021a] represent early traditional clustering techniques. Additionally, we consider four deep neural network-based clustering methods, DEC [Xie et al., 2016], scDeepCluster [Tian et al., 2019], scDCC [Tian et al., 2021], and scNAME [Wan et al., 2022], which train an autoencoder to obtain representations followed by clustering. scDSC [Gan et al., 2022], scGNN [Wang et al., 2021b], and scCDCG [Xu et al., 2024] are representative GNN-based clustering methods that incorporate both node attributes and structural information for latent representation. Implementation Details. We implemented scSiameseClu in Python 3.7 using PyTorch, with DCRN [Liu et al., 2022] as the backbone. Each experiment was repeated 10 times, reporting the mean and variance. Detailed parameter settings are provided in the supplementary material.
| Dataset | Metric | pcaReduce | SUSSC | DEC | scDeepCluster | scDCC | scNAME | scDSC | scGNN | scCDCG | OURS | ||||||||
|---|---|---|---|---|---|---|---|---|---|---|---|---|---|---|---|---|---|---|---|
| Shekhar mouse retina cells | ACC NMI ARI | 21.27 ± 0.14 25.54 ± 0.05 10.01 ± 0.03 | 25.04 ± 0.73 43.35 ± 0.36 19.69 ± 0.52 | 24.55 ± 2.29 40.32 ± 3.50 17.96 ± 3.59 | 47.26 ± 3.34 80.45 ± 1.28 52.66 ± 5.77 | 74.14 ± 2.31 81.20 ± 0.68 62.44 ± 4.50 | 79.84 ± 2.77 75.19 ± 11.89 81.66 ± 7.05 | 67.54 ± 4.08 62.46 ± 14.53 54.53 ± 8.34 | 78.56 ± 3.95 79.89 ± 5.28 77.58 ± 9.59 | 76.04 ± 1.85 76.71 ± 1.47 60.65 ± 6.47 | 89.16 ± 3.52 82.72 ± 1.22 88.93 ± 2.15 | ||||||||
| Macosko mouse retina cells | ACC NMI ARI | 16.40 ± 0.33 23.35 ± 0.19 11.44 ± 0.79 | 30.34 ± 0.40 50.72 ± 0.13 18.89 ± 0.53 | 33.32 ± 2.97 52.20 ± 2.14 27.55 ± 6.65 | 54.45 ± 3.03 76.83 ± 2.09 40.90 ± 1.44 | 63.31 ± 11.09 79.13 ± 0.94 52.38 ± 2.78 | 78.97 ± 7.76 82.64 ± 1.44 84.72 ± 0.17 | 72.16 ± 0.77 67.04 ± 0.49 61.55 ± 0.82 | 62.80 ± 2.26 68.25 ± 3.36 | 69.78 ± 0.70 68.71 ± 2.52 | 87.13 ± 2.15 86.62 ± 2.31 | ||||||||
| QS mouse lung cells | ACC NMI ARI | 33.70 ± 0.21 16.10 ± 0.54 11.68 ± 0.25 | 40.82 ± 0.10 43.08 ± 0.01 ± | 38.07 ± 1.40 37.27 ± 3.76 | 47.16 ± 3.35 70.18 ± 2.24 | 48.29 ± 5.51 50.40 ± 7.24 | 69.84 ± 71.41 ± 5.40 | 67.54 ± 69.48 ± 7.11 | 69.46 ± 1.88 64.20 ± 2.10 75.90 ± 0.97 | 70.58 ± 0.87 70.13 ± 1.92 | 87.16 ± 1.52 86.07 ± 1.04 | ||||||||
| 28.07 0.04 | 23.08 ± 3.75 | ± 4.07 | 42.76 ± 10.05 | 74.01 ± 2.25 | 58.99 ± 2.69 | 90.92 ± 3.74 | |||||||||||||
| ACC NMI 28.28 | 60.14 | 46.87 | 73.16 | 48.98 | 2.77 | 4.08 | 72.83 | 64.21 | 61.70 | 68.57 | 68.71 | ||||||||
| ARI 5.09 ACC | ± 0.19 ± 0.04 | ± 0.04 32.84 ± 4.51 | ± 9.23 23.55 ± 10.25 | 51.21 | 1.31 2.60 66.06 | ± 7.06 ± 3.37 | ± 3.25 ± 2.15 | 3.21 1.75 79.32 ± | 1.7 1.4 | 52.51 | ± 0.75 67.56 ± 1.17 | ||||||||
| ± 3.20 | 76.76 ± 7.24 | ± 0.78 | 84. 49 ± 3.44 | ||||||||||||||||
| 41.37 | 45.50 | 80.67 | |||||||||||||||||
| CITE-CMBC | 28.15 ± 0.07 | 47.19 ± 0.02 | 41.88 ± 5.35 | 67.59 ± 4.40 | 69.04 ± 3.46 | 60.22 ± 5.87 | 68.79 ± 0.87 | 66.71 ± 1.65 | 71.75 ± 1.8 | 74.70 ± 0.51 | |||||||||
| ACC | 35.04 ± 0.14 | ± 0.06 | ± 6.76 | ± 8.61 | 72.90 ± 4.02 | 74.55 ± 5.30 | ± 2.23 | ± 3.4 | ± 1.7 | 88.33 ± 1.74 | |||||||||
| Human liver cells | 47.96 | 46.32 | 61.32 | 70.90 | 72.33 | 75.34 | |||||||||||||
| NMI | 32.43 ± 0.33 | 67.17 ± 0.00 | 52.24 ± 3.44 | 78.09 ± 2.50 | 78.81 ± 1.50 | 77.42 ± 12.00 | 71.63 ± 2.75 | 73.56 ± 2.7 | 79.34 ± 2.6 | 88.82 ± 1.24 | |||||||||
| ARI | 10.24 ± 1.42 | 35.27 ± 0.00 | 31.04 ± 10.90 | 58.28 ± 10.61 | 70.47 ± 1.93 | 79.91 ± 2.93 | 75.34 ± 3.56 | 76.01 ± 2.6 | 81.26 ± 2.7 | 91.90 ± 0.48 | |||||||||
| Human kidney cells | ACC | 41.38 ± 0.24 | 44.18 ± 0.22 | 38.91 ± 2.71 | 59.81 ± 4.69 | 67.89 ± 6.22 | 73.71 ± 3.90 | 75.32 ± 2.81 | 77.73 ± 1.41 | 79.55 ± 0.29 | 86.08 ± 0.89 | ||||||||
| ± 0.13 | 37.35 ± 0.02 | 28.78 ± 5.10 | 63.67 ± 3.70 | 66.53 ± 4.91 | ± 68.39 ± 2.41 | ± 2.12 ± | 1.07 | 67.98 ± 2.62 | 80.86 ± 0.96 | ||||||||||
| NMI | 24.31 24.56 ± 0.29 | 30.78 ± 0.02 | 61.39 4.70 | 69.41 67.74 ± 4.52 | 72.29 ± 1.59 | 64.91 ± 0.88 | ± 2.07 | ||||||||||||
| ARI | 19.97 ± 5.06 | 47.53 ± 5.44 | 50.37 ± 7.22 | 3.96 | 74.23 | ||||||||||||||
| 51.17 ± 0.66 | 76.29 ± 0.02 | 72.22 ± 5.51 | 74.70 ± 2.69 | 86.65 ± 5.76 | 89.63 ± 5.83 | 1.34 | 92.65 ± 1.9 | 94.95 ± 0.15 | |||||||||||
| Human pancreas cells | NMI | 57.71 ± 0.67 | 82.31 ± 0.13 | 76.29 ± 2.73 | 79.32 ± 0.32 | 83.81 ± | 86.70 ± 7.79 | 75.89 ± 0.61 | 78.76 ± 5.60 | 86.19 ± 0.34 | |||||||||
| ARI | 37.00 ± | 64.24 ± 0.01 | 61.76 ± 5.55 | 64.59 ± 2.49 | ± | ± 3.13 | 75.42 ± | 78.81 ± 3.17 | 91.37 ± 1.21 | 91.59 ± 0.35 | |||||||||
| 84.93 | |||||||||||||||||||
| 1.22 | |||||||||||||||||||
| 79.83 10.79 | |||||||||||||||||||
| 0.45 | |||||||||||||||||||
| 2.94 | |||||||||||||||||||
| ± 1.0 | |||||||||||||||||||
| 79.42 | 85.81 | ||||||||||||||||||
Evaluation Metrics. To illustrate the effectiveness of our approach, we evaluate clustering performance through three widely recognized metrics: Accuracy (ACC), Normalized Mutual Information (NMI) [Strehl and Ghosh, 2002], and Adjusted Rand Index (ARI) [Vinh et al., 2009].
4.2 Overall Performance
Quantitative Analysis. Tab. 1 compares the clustering performance of our method with nine competitive baselines across seven benchmark datasets. Based on the results, we can observe that: 1) scSiameseClu significantly outperforms traditional single-cell clustering methods, demonstrating its superior ability to handle scRNA-seq data. 2) Compared to deep learning-based methods, which rely solely on node information for clustering, scSiameseClu achieves consistently better results, highlighting its ability to leverage both gene and cell information effectively. 3) While GNN-based methods incorporate cell graph information, they suffer from redundant embeddings and representation collapse. In contrast, scSiameseClu learns more discriminative representations of scRNA-seq data, thereby enhancing clustering performance. Overall, scSiameseClu outperforms the competing methods on three metrics across all datasets. On average, scSiameseClu achieves a significant average improvement of 8.41% in ACC, 5.89% in NMI, 4.34% in ARI than the second-best method.
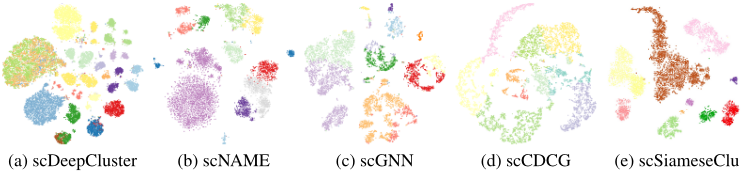
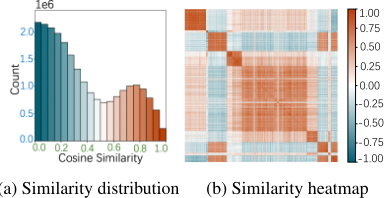
Qualitative Analysis. To evaluate clustering performance, we used t-SNE to project the learned embeddings from different methods into a two-dimensional space on the Human liver cells dataset. As Fig. 3 shows, scSiameseClu produces well-separated clusters with clear boundaries, effectively distinguishing different cell types regardless of cluster size. In contrast, methods like scDeepCluster show dispersed clusters, failing to group similar cell types. We further analyze the embeddings from scSiameseClu with the cosine similarity matrices. As shown in Fig. 4, the bimodal distribution of cosine similarities (approaching a multivariate Gaussian) and the distinct heatmap patterns preserve meaningful cluster structures in the latent space. scSiameseClu mitigates representation collapse and effectively captures latent cluster structures, unlike other deep learning and GNN-based methods (Fig1).
4.3 Biological Analysis
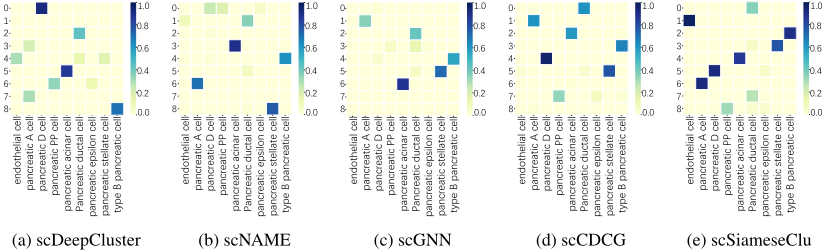
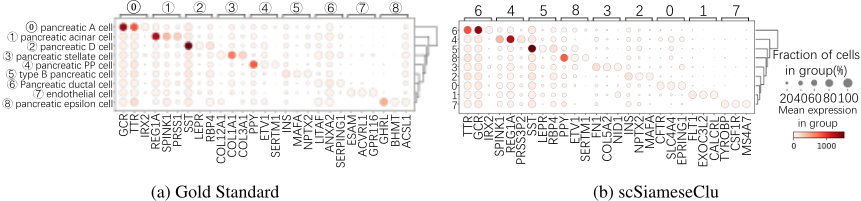
Cell Type Annotation. To demonstrate that our clustering method enables more effective downstream analysis, we first identified differentially expressed genes (DEGs) and marker genes for each cluster using the "FindAllMarkers" function in Seurat [Butler et al., 2018]. Then, we compared the top 50 marker genes identified by scSiameseClu and other methods to the gold standard on the human pancreas cells dataset, and our method accurately annotated clusters with cell types, achieving over 90% similarity in marker genes for most clusters. As Fig. 5 shows, cluster 1 was identified as endothelial cell type, and cluster 2 as type B pancreatic cells, etc. Additionally, Fig. 6 shows scSiameseClu identifies marker genes for each cluster, e.g., cluster 6 is characterized as pancreatic A cell type with marker genes TTR, GCG, and IRX2. Our method effectively matched clusters with known cell types, providing reliable support for mechanistic studies.
| Metric | pcaReduce | scDCC | scDSC | scCDCG | scGNN | scSiameseClu |
|---|---|---|---|---|---|---|
| Accuracy | 83.17 | 86.34 | 91.71 | 98.05 | 99.02 | 99.51 |
| Precision | 57.40 | 66.69 | 89.30 | 92.70 | 88.50 | 99.69 |
| Recall | 49.34 | 67.65 | 79.41 | 93.45 | 98.98 | 99.09 |
| F1 | 48.17 | 65.82 | 78.84 | 93.06 | 99.23 | 99.36 |
Cell Type Classification. To evaluate the discriminative power and generalization ability of the learned representations, we conducted classification experiments. Tab. 2 shows that scSiameseClu outperforms the baseline models on human pancreatic cells dataset across four metrics, including accuracy and F1-score. This demonstrates scSiameseClu's superior performance in identifying cellular heterogeneity and the robustness and effectiveness in cell type classification.
5 Conclusion
scSiameseClu integrates dual augmentation module, siamese fusion module, and optimal transport clustering to enhance representation learning while preserving biological relevance. Experimental results on seven datasets demonstrate that scSiameseClu not only outperforms nine baselines on scRNA-seq clustering but also alleviates the representation collapse issue common in GNN-based approaches. In addition, we conduct biological analyses, including cell type annotation and classification, underscoring the scSiameseClu's potential as a powerful tool for advancing single-cell transcriptomics.
Acknowledgements
This work is partially supported by the National Natural Science Foundation of China (Grant No. 92470204 and 62406306), the National Key Research and Development Program of China (Grant No. 2024YFF0729201), and the Science and Technology Development Fund (FDCT), Macau SAR (file no. 0123/2023/RIA2, 001/2024/SKL).
@inproceedings{ijcai2025p875,
  title     = {scSiameseClu: A Siamese Clustering Framework for Interpreting Single-cell RNA Sequencing Data},
  author    = {Xu, Ping and Ning, Zhiyuan and Li, Pengjiang and Liu, Wenhao and Wang, Pengyang and Cui, Jiaxu and Zhou, Yuanchun and Wang, Pengfei},
  booktitle = {Proceedings of the Thirty-Fourth International Joint Conference on
               Artificial Intelligence, {IJCAI-25}},
  publisher = {International Joint Conferences on Artificial Intelligence Organization},
  editor    = {James Kwok},
  pages     = {7867--7875},
  year      = {2025},
  month     = {8},
  note      = {Main Track},
  doi       = {10.24963/ijcai.2025/875},
  url       = {https://doi.org/10.24963/ijcai.2025/875},
}
TY - CPAPER TI - scSiameseClu: A Siamese Clustering Framework for Interpreting Single-cell RNA Sequencing Data AU - Xu, Ping AU - Ning, Zhiyuan AU - Li, Pengjiang AU - Liu, Wenhao AU - Wang, Pengyang AU - Cui, Jiaxu AU - Zhou, Yuanchun AU - Wang, Pengfei T2 - Proceedings of the Thirty-Fourth International Joint Conference on Artificial Intelligence, IJCAI-25 PB - International Joint Conferences on Artificial Intelligence Organization PY - 2025 SP - 7867 EP - 7875 DO - 10.24963/ijcai.2025/875 UR - https://doi.org/10.24963/ijcai.2025/875 ER -Copied
Machine-readable versions of this paper, for tools and AI agents:





