
Cross-Modal Dynamic Hypergraph Computation via Functional-Structural Brain Network for Brain Disorder Diagnosis
Proceedings of the Thirty-Fifth International Joint Conference on Artificial Intelligence. Main Track. Pages 3603-3611.
https://doi.org/10.24963/ijcai.2026/401
Keywords
- Humans and AI: Brain sciences
Abstract
Cross-modal brain networks characterize the complex connections between different brain regions from both functional and structural perspectives, which is of significant importance for brain network analysis and the diagnosis of brain diseases. However, existing methods have failed to fully exploit the complementary information between functional and structural brain networks, neglecting the guiding role of topology in the transmission of functional modal information, as well as the potential associations of cross-modal high-order information. To address these challenges, this paper proposes a cross-modal dynamic hypergraph computing (CDHGC) framework for brain disease diagnosis and an in-depth analysis of coupled functional-structural brain networks. The CDHGC comprises two key modules: the topology-guided dynamic hypergraph generation module, which combines the topology-constrained KNN and topology-guided centroid sampling methods to uncover high-order correlations among brain regions across modalities based on topological structure. This module dynamically optimizes the hypergraph structure during training to explore potential associations of cross-modal information. The cross-modal hypergraph convolution module efficiently aggregates information from functional-structural brain networks through a cross-modal attention mechanism during message-passing, resulting in high-order joint representations. Experiments conducted on the ADNI and ABIDE datasets demonstrate that the proposed method outperforms current state-of-the-art approaches. Interpretability analysis reveals that the proposed method can discover multi-modal biomarkers associated with brain diseases.
- [Cai et al., 2023] Hongmin Cai, Zhixuan Zhou, Defu Yang, Guorong Wu, and Jiazhou Chen. Discovering brain net- work dysfunction in alzheimer's disease using brain hy- pergraph neural network. In International Conference on Medical Image Computing and Computer-Assisted Inter- vention, pages 230-240. Springer, 2023.
- [Corso et al., 2024] Gabriele Corso, Hannes Stark, Stefanie Jegelka, Tommi Jaakkola, and Regina Barzilay. Graph neural networks. Nature Reviews Methods Primers, 4(1):17, 2024.
- [Cui et al., 2022] Hejie Cui, Wei Dai, Yanqiao Zhu, Xuan Kan, Antonio Aodong Chen Gu, Joshua Lukemire, Liang Zhan, Lifang He, Ying Guo, and Carl Yang. Braingb: a benchmark for brain network analysis with graph neu- ral networks. IEEE transactions on medical imaging, 42(2):493-506, 2022.
- [Dyrba et al., 2015] Martin Dyrba, Michel Grothe, Thomas Kirste, and Stefan J Teipel. Multimodal analysis of functional and structural disconnection in alzheimer's dis- ease using multiple kernel svm. Human brain mapping, 36(6):2118-2131, 2015.
- [Feng et al., 2019] Yifan Feng, Haoxuan You, Zizhao Zhang, Rongrong Ji, and Yue Gao. Hypergraph neural net- works. In Proceedings of the AAAI conference on artificial intelligence, volume 33, pages 3558-3565, 2019.
- [Fotiadis et al., 2024] Panagiotis Fotiadis, Linden Parkes, Kathryn A Davis, Theodore D Satterthwaite, Russell T Shinohara, and Dani S Bassett. Structure-function cou- pling in macroscale human brain networks. Nature Re- views Neuroscience, 25(10):688-704, 2024.
- [Friston, 2011] Karl J Friston. Functional and effective con- nectivity: a review. Brain connectivity, 1(1):13-36, 2011.
- [Gao et al., 2022] Yue Gao, Yifan Feng, Shuyi Ji, and Ron- grong Ji. Hgnn+: General hypergraph neural networks. IEEE Transactions on Pattern Analysis and Machine In- telligence, 45(3):3181-3199, 2022.
- [Heinsfeld et al., 2018] Anibal Sólon Heinsfeld, Alexan- dre Rosa Franco, R Cameron Craddock, Augusto Buch- weitz, and Felipe Meneguzzi. Identification of autism spectrum disorder using deep learning and the abide dataset. NeuroImage: Clinical, 17:16-23, 2018.
- [Honey et al., 2009] Christopher J Honey, Olaf Sporns, Leila Cammoun, Xavier Gigandet, Jean-Philippe Thiran, Reto Meuli, and Patric Hagmann. Predicting human resting- state functional connectivity from structural connectiv- ity. Proceedings of the National Academy of Sciences, 106(6):2035-2040, 2009.
- [Jack et al., 2010] Clifford R Jack, David S Knopman, William J Jagust, Leslie M Shaw, Paul S Aisen, Michael W Weiner, Ronald C Petersen, and John Q Trojanowski. Hy- pothetical model of dynamic biomarkers of the alzheimer's pathological cascade. The Lancet Neurology, 9(1):119- 128, 2010.
- [Jack Jr et al., 2008] Clifford R Jack Jr, Matt A Bern- stein, Nick C Fox, Paul Thompson, Gene Alexander, Danielle Harvey, Bret Borowski, Paula J Britson, Jennifer L. Whitwell, Chadwick Ward, et al. The alzheimer's dis- ease neuroimaging initiative (adni): Mri methods. Jour- nal of Magnetic Resonance Imaging: An Official Jour- nal of the International Society for Magnetic Resonance in Medicine, 27(4):685-691, 2008.
- [Ji et al., 2022] Junzhong Ji, Yating Ren, and Minglong Lei. Fc-hat: hypergraph attention network for functional brain network classification. Information Sciences, 608:1301- 1316, 2022.
- [Jie et al., 2020] Biao Jie, Mingxia Liu, Chunfeng Lian, Feng Shi, and Dinggang Shen. Designing weighted cor- relation kernels in convolutional neural networks for func- tional connectivity based brain disease diagnosis. Medical Image Analysis, 63:101709, 2020.
- [Kana et al., 2015] Rajesh K Kana, Jose O Maximo, Diane L Williams, Timothy A Keller, Sarah E Schipul, Vladimir L Cherkassky, Nancy J Minshew, and Marcel Adam Just. Aberrant functioning of the theory-of-mind network in children and adolescents with autism. Molecular autism, 6:1-12, 2015.
- [Katti et al., 2011] Girish Katti, Syeda Arshiya Ara, and Ayesha Shireen. Magnetic resonance imaging (mri)-a re- view. International journal of dental clinics, 3(1):65-70, 2011.
- [Kingma, 2014] Diederik P Kingma. Adam: A method for stochastic optimization. arXiv preprint arXiv:1412.6980, 2014.
- [Kipf and Welling, 2016] Thomas N Kipf and Max Welling. Semi-supervised classification with graph convolutional networks. arXiv preprint arXiv:1609.02907, 2016.
- [Li et al., 2021] Xiaoxiao Li, Yuan Zhou, Nicha Dvornek, Muhan Zhang, Siyuan Gao, Juntang Zhuang, Dustin Scheinost, Lawrence H Staib, Pamela Ventola, and James S Duncan. Braingnn: Interpretable brain graph neu- ral network for fmri analysis. Medical Image Analysis, 74:102233, 2021.
- [Liu et al., 2022] Liangliang Liu, Yu-Ping Wang, Yi Wang, Pei Zhang, and Shufeng Xiong. An enhanced multi-modal brain graph network for classifying neuropsychiatric dis- orders. Medical image analysis, 81:102550, 2022.
- [Mitchell et al., 2002] Thomas W Mitchell, Elliott J Mufson, Julie A Schneider, Elizabeth J Cochran, Jonathan Nis- sanov, Li-Ying Han, Julia L Bienias, Virginia M-Y Lee, John Q Trojanowski, David A Bennett, et al. Parahip- pocampal tau pathology in healthy aging, mild cognitive impairment, and early alzheimer's disease. Annals of Neu- rology: Official Journal of the American Neurological As- sociation and the Child Neurology Society, 51(2):182- 189, 2002.
- [Monk et al., 2009] Christopher S Monk, Scott J Peltier, Jil- lian Lee Wiggins, Shih-Jen Weng, Melisa Carrasco, Susan Risi, and Catherine Lord. Abnormalities of intrinsic func- tional connectivity in autism spectrum disorders. Neuroim- age, 47(2):764-772, 2009.
- [Park and Friston, 2013] Hae-Jeong Park and Karl Friston. Structural and functional brain networks: from connec- tions to cognition. Science, 342(6158):1238411, 2013.
- [Pievani et al., 2011] Michela Pievani, Willem de Haan, Tao Wu, William W Seeley, and Giovanni B Frisoni. Func- tional network disruption in the degenerative dementias. The Lancet Neurology, 10(9):829-843, 2011.
- [Van Hoesen et al., 2000] Gary W Van Hoesen, Jean C Au- gustinack, Jason Dierking, Sarah J Redman, and Ra- masamy Thangavel. The parahippocampal gyrus in alzheimer's disease: clinical and preclinical neuroanatom- ical correlates. Annals of the New York Academy of Sci- ences, 911(1):254-274, 2000.
- [Wang et al., 2023] Junqi Wang, Hailong Li, Gang Qu, Kim M Cecil, Jonathan R Dillman, Nehal A Parikh, and Lili He. Dynamic weighted hypergraph convolutional net- work for brain functional connectome analysis. Medical Image Analysis, 87:102828, 2023.
- [Wang et al., 2024] Wei Wang, Li Xiao, Gang Qu, Vince D Calhoun, Yu-Ping Wang, and Xiaoyan Sun. Multiview hyperedge-aware hypergraph embedding learning for mul- tisite, multiatlas fmri based functional connectivity net- work analysis. Medical Image Analysis, 94:103144, 2024.
- [Xia et al., 2025] Jing Xia, Yi Hao Chan, Deepank Girish, and Jagath C Rajapakse. Interpretable modality-specific and interactive graph convolutional network on brain func- tional and structural connectomes. Medical Image Analy- sis, 102:103509, 2025.
- [Xiao et al., 2019] Li Xiao, Junqi Wang, Peyman H Kas- sani, Yipu Zhang, Yuntong Bai, Julia M Stephen, Tony W Wilson, Vince D Calhoun, and Yu-Ping Wang. Multi- hypergraph learning-based brain functional connectivity analysis in fmri data. IEEE transactions on medical imag- ing, 39(5):1746-1758, 2019.
- [Yang et al., 2023] Yanwu Yang, Chenfei Ye, Xutao Guo, Tao Wu, Yang Xiang, and Ting Ma. Mapping multi-modal brain connectome for brain disorder diagnosis via cross- modal mutual learning. IEEE Transactions on Medical Imaging, 2023.
- [Ye et al., 2023] Hongting Ye, Yalu Zheng, Yueying Li, Ke Zhang, Youyong Kong, and Yonggui Yuan. Rh-brainfs: regional heterogeneous multimodal brain networks fusion strategy. Advances in Neural Information Processing Sys- tems, 36:59286-59303, 2023.
- [Zheng et al., 2024] Kaizhong Zheng, Shujian Yu, Baojuan Li, Robert Jenssen, and Badong Chen. Brainib: Inter- pretable brain network-based psychiatric diagnosis with graph information bottleneck. IEEE Transactions on Neu- ral Networks and Learning Systems, 2024.
- [Zhou et al., 2024] Houliang Zhou, Lifang He, Brian Y Chen, Li Shen, and Yu Zhang. Multi-modal diagnosis of alzheimer's disease using interpretable graph convolu- tional networks. IEEE Transactions on Medical Imaging, 2024.
- [Zhu et al., 2022] Yanqiao Zhu, Hejie Cui, Lifang He, Lichao Sun, and Carl Yang. Joint embedding of structural and functional brain networks with graph neural networks for mental illness diagnosis. In 2022 44th Annual Interna- tional Conference of the IEEE Engineering in Medicine & Biology Society (EMBC), pages 272-276. IEEE, 2022.
References were extracted automatically from the PDF and may contain errors.
Full text extracted automatically from the PDF; figures, tables and equations may differ. The PDF is the version of record.
1 Introduction
The technology for brain network analysis based on multimodal neuroimaging data aids in revealing the potential relationships between brain function and structure, which is crucial for brain disease diagnosis. Brain networks can be classified into functional brain networks and structural brain networks. The functional brain network is constructed from signals extracted through functional magnetic resonance imaging (fMRI), which reflects the activation patterns of interregional connections in the brain during various cognitive and behavioral processes. In contrast, the structural brain network is built from white matter fiber tracts measured by diffusion tensor imaging (DTI) [Katti et al., 2011], describing the physical connections of neural fibers between brain regions.
∗Corresponding author.
Existing studies have indicated that there is a coupling relationship between functional brain networks and structural brain networks [Park and Friston, 2013; Fotiadis et al., 2024]. For example, during language tasks, the brain facilitates information processing through synergistic interactions among multiple brain regions, and such functional interaction is based on structural connections [Friston, 2011]. However, how to model and learn the relationship between functional and structural brain networks in order to facilitate in-depth brain network analysis and advance the diagnosis of brain diseases remains a major challenge in current research.
The core of brain disease diagnosis based on brain network analysis lies in modeling and learning the correlations between brain regions. Graph neural networks (GNNs) and hypergraph neural networks (HGNNs) are commonly used methods for learning inter-regional correlations within brain networks, and they have attracted considerable attention in the field of neuroscience in recent years. GNNs excel in capturing the structural information contained in feature interactions within the graph domain, demonstrating promising performance in brain disease diagnosis. BrainGNN [Li et al., 2021] is a typical application of graph convolutional networks for functional brain network analysis, achieving commendable performance in brain disease diagnosis tasks. However, GNNs are unable to capture high-order information within brain networks. Hypergraphs, as an extension of graphs, allow hyperedges to connect an arbitrary number of nodes, which offers significant advantages for modeling high-order correlations among multiple brain regions. Existing studies have introduced hypergraph learning methods into brain network analysis [Xiao et al., 2019; Wang et al., 2024]. For instance, DwHGCN [Wang et al., 2023] learns the high-order representations of functional brain networks by adaptively updating hyperedge weights during the training process, improving the accuracy of brain disease diagnosis. However, previous hypergraph-based brain network analysis methods have primarily focused on unimodal brain networks, lacking exploration of high-order correlations across crossmodal brain networks.
Furthermore, existing research has conducted coupling analyses of functional and structural brain networks while utilizing cross-modal information for disease diagnosis. BrainNN [Zhu et al., 2022] treats functional and structural brain networks as multi-view data, extracting features from both types of brain networks through graph neural networks (GNNs) and employing contrastive learning for multi-modal integration, thereby enhancing the accuracy of brain disease diagnosis. However, such methods fail to fully capitalize on the complementary information between the two networks, overlooking the guiding role of structural connectivity in the transmission of cross-modal information and the potential high-order correlations within cross-modal brain networks.
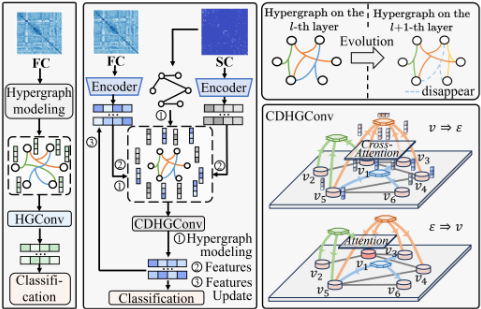
To address these issues, we propose a cross-modal dynamic hypergraph computation method. As illustrated in Figure 1, in contrast to conventional hypergraph-based brain network classification, the proposed method first models the high-order correlations of cross-modal brain networks based on structural connectivity using a topology-guided dynamic hypergraph generation approach. During training, the hypergraph structure is iteratively optimized to dynamically learn the hidden complex correlations between cross-modal brain networks. Based on the constructed hypergraph, the cross-modal hypergraph convolution computation method efficiently integrates functional and structural brain network information during the cross-modal node convolution phase through a cross-modal attention mechanism, aggregating this information to hyperedges. In the hyperedge attention convolution phase, an attention mechanism aggregates the hyperedge features back to the nodes, achieving an efficient crossmodal message propagation pattern that merges high-order information from functional and structural brain networks. In summary, this paper presents three main contributions:
- We propose a cross-modal dynamic hypergraph com-
- putation method that integrates high-order information from functional and structural brain networks for accurate brain disease diagnosis. Experimental results on the ADNI and ABIDE datasets demonstrate that the proposed method outperforms state-of-the-art approaches.
- We introduce a topology-guided dynamic hypergraph construction method, which models cross-modal highorder correlations in topological space by combining the topology-constrained KNN method and the centroid sampling method. The hypergraph structure is dynamically optimized during training to uncover potential cross-modal high-order correlation patterns.
- We propose a cross-modal hypergraph convolution for integrating functional and structural brain network information. This approach efficiently merges highorder information within functional and structural brain networks through a cross-modal attention mechanism, achieving functional-structural coupling from the perspective of high-order correlations.
2 RelatedWork
2.1 Graph-based and Hypergraph-based Brain Network Analysis
Graph-based Methods. Graph-based methods establish brain networks by representing brain regions as nodes and functional or structural connections as edges [Li et al., 2021]. GNNs [Kipf and Welling, 2016] are introduced to aggregate node information along edges that have proven potential in brain network analysis [Corso et al., 2024]. [Cui et al., 2022] developed BrainGB, a benchmark that standardizes the construction of brain networks and the design of GNNs. However, graph-based methods concentrate on pairwise relationships and rely on a low-order network structure.
Hypergraph-based Methods. Hypergraph-based methods are designed to capture high-order relationships that extend beyond pairwise correlations and have been introduced for brain network analysis. For example, [Wang et al., 2023] introduced the DwHGCN, which generates hyperedges through sparse representation and adaptively updates the hyperedge weights during training to capture functional connectivity better. [Cai et al., 2023] proposed a brain network-tailored hypergraph neural network to identify the propagation patterns in AD. Although hypergraph-based methods incorporate high-order information, they still face challenges in adapting to heterogeneous, multi-modal brain imaging data.
2.2 Multi-modal Brain Network Analysis
Unimodal methods, which rely on a single type of data source such as fMRI or DTI, offer convenience but cannot fully capture the wide variability of different tissues, cortexes, and structures in the brain. To overcome these limitations, multi-modal brain network fusion methods have been proposed for brain network analysis [Xia et al., 2025; Zhou et al., 2024]. The simplest approach involves concatenating cross-modal features and feeding them into classifiers for prediction, such as [Dyrba et al., 2015]. In addition, [Jie et al., 2020] proposed an enhanced multi-modal graph convolutional network (MME-GCN) [Liu et al., 2022] that adjusts the edge weights of the functional graph network using features from the structural graph network for disease diagnosis. However, these methods fail to fully leverage the complementary information between modalities and lack the ability to model high-order cross-modal associations.
3 Method
3.1 Preliminaries
This paper employs a hypergraph approach to model the highorder correlations within functional and structural brain networks respectively. Given a hypergraph H = {V, E,W}, V and E refer the vertex set and the hyperedge set of the hypergraph structure, respectively. The structure of the hypergraph H can be represented by an incidence matrix H ∈ R|V|×|E| , which encodes the binary 0/1 relationships between nodes and hyperedges:
3.2 High-order Feature Extraction
We employ the hypergraph structure to model high-order correlations among brain regions of functional and structural brain networks.
Functional Modality. Each scanned brain space is parcellated into N brain regions based on the automated anatomical labeling (AAL) atlas. For fMRI images, we extract N time series from corresponding brain regions, employing these to compute the Pearson correlation coefficients Xf for quantifying the functional connectivity strength between brain regions. The N brain regions are defined as the set of nodes V = {v1, . . . , vN} in the functional hypergraph, the initial node feature being represented by Xf . To capture local similarities within the functional brain network, the K-Nearest Neighbors (KNN) is employed to identify k1 - 1 nearest neighbors for each node vi, thereby forming hyperedges and constructing the functional hypergraph Hf .
Subsequently, the set {Xf ,Hf} is input into the hypergraph convolution [Gao et al., 2022] to facilitate the learning of high-order functional correlations and feature representations Xlf in functional brain networks. The hypergraph convolution process is represented as below:
where Dv and De are the vertex degree matrix and the hyperedge degree matrix, respectively. W denotes the hyperedge weight matrix, which is typically set to the identity matrix, and Θl is a learnable parameter matrix.
StructuralModality. The process of high-order feature extraction for structural brain networks is similar to that for brain functional networks. A structural connectivity (SC) matrix is derived based on DTI data, representing the number of fibers between different brain regions, and is used as the initial node features Xs for the structural modality. Subsequently, a structural hypergraph Hs is constructed using the KNN method, and high-order structural correlations among brain regions are preliminarily learned through hypergraph convolution. In addition, binaryizing the SC matrix yields a topological graph Gs that reflects the brain's structural connectivity. This topological graph Gs will be used to guide the hypergraph construction process in the next section.
Finally, the high-order features of the functional and structural brain networks are initially extracted from each modal network through hypergraph computation.
3.3 Cross-modal Dynamic Hypergraph Computation
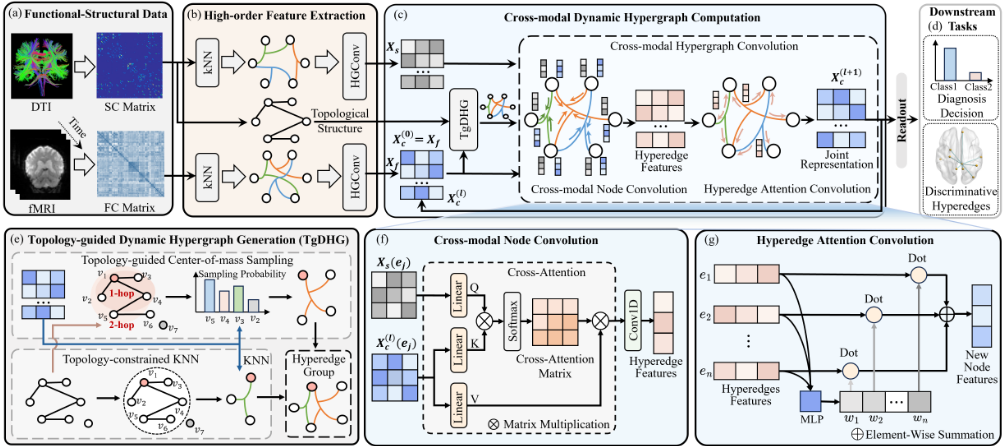
As depicted in Figure 2, we propose a cross-modal dynamic hypergraph computation framework to effectively integrate the functional and structural information within each respective modality. The proposed framework comprises a topology-guided dynamic hypergraph generation module and a cross-modal hypergraph convolution module. The topology-guided dynamic hypergraph generation module updates the hypergraph structure dynamically during training, capturing potential cross-modal high-order correlation patterns. Meanwhile, guided by multi-modal information, the cross-modal hypergraph convolution extracts and integrates high-order functional and structural correlations to obtain a cross-modal joint representation Xlc . Please note that in the first iteration, X0c is equivalent to Xf .
Topology-guided Dynamic Hypergraph Generation
The topological information of structural brain networks reflects the physical connections between brain regions, and its topological structure can guide the modeling of high-order correlations in cross-modal brain networks. Specifically, the topological connectivity of a structural brain network can be represented as a graph Gs. Given a Gs, the function Φ(vi, vj) represents the shortest topology path between vi and vj (i.e., the smallest number of hops) if the two nodes are connected. Otherwise, the output of Φ is set to -1. The Φ(vi, vj) derived from structural connections represents the relationship between brain regions in the topological space. Based on this, the topology-guided dynamic hypergraph generation consists of two hyperedge construction strategies: topologyconstrained KNN and topology-guided centroid sampling.
Topology-constrained KNN Method. The transmission of information in brain networks relies on the topological connectivity of the structural brain network [Honey et al., 2009]. Based on this biological mechanism, the topologyconstrained KNN method first determines the topological connectivity between each node and other nodes to filter candidate nodes for each node. For node vi, vj is considered as a candidate node with vi as the central hyperedge only when vj has a topological direct or indirect connection relationship with it (i.e., Φ(vi, vj) ̸= -1). This process enables the identification of a candidate node set D(vi) for node vi. The hyperedge centered on vi is formed by selecting the k2 - 1 nodes with the greatest similarity to the joint representation Xlc,i of vi from D(vi). For the topology-constrained KNN, the similarity Si,j between nodes is measured using the reciprocal of the Euclidean distance:
where dl denotes the feature dimension. The Xlc,i [p] and Xlc,j [p] respectively denote the p-th feature value of the joint representation vectors for nodes vi and vj in the l-th layer, and the hypergraph structure is optimized as the joint representation embedding Xlc changes during training.
Topology-guided Centroid Sampling. To further capture the important role of topology key nodes in information transfer throughout the brain network, we propose a topologyguided centroid sampling for generating hyperedges, which is achieved by selecting highly centrally located nodes throughout the network and biased sampling with these nodes as the center. Specifically, we measure the importance of each brain region in Gs by calculating its degree of centrality based on the topology of structural connections. We select the k3 nodes with the highest degree of centrality to form the set of central nodes Ntopk3 . For the central node vi in the Ntopk3 , sampling centered on vi is restricted to the m-hop (i.e., Φ(vi, vj) ≤ m) range of the topology, focusing on the information of the nearby nodes and reducing the effect of the noise introduced by remote nodes. For the node vj that satisfies Φ(vi, vj) ≤ m, its sampling probability can be computed using Eq. (3) based on the joint representation Xlc . Nodes whose joint representation vectors are more similar to vi will have a higher probability of being included in the hyperedge centered at vi, and the node vi will select the topk4 nodes with the highest probability within an m-hop range to form a hyperedge.
For node vi, by combining the hyperedges obtained from each of the two hypergraph generation methods described above, a hyperedge group centered on it can be constructed to model cross-modal high-order correlations in topological space. Since node embeddings change continuously with network depth, the hypergraph is dynamically updated in each iteration to capture potential cross-modal high-order correlations that are not captured by the initial structure.
Cross-modal Hypergraph Convolution
The cross-modal hypergraph convolution efficiently integrates structural and functional brain network information through a cross-modal message-passing scheme to obtain a joint representation. The proposed convolution comprises two phases: cross-modal node convolution and hyperedge attention convolution. During the cross-modal node convolution, information is aggregated to the hyperedge through a cross-modal attention mechanism. In the hyperedge attention convolution phase, features from adjacent hyperedges are integrated into the nodes via an attention mechanism.
Cross-modal Node Convolution. The cross-modal node convolution updates the hyperedge features by aggregating the node features contained in the hyperedge. A crossmodal attention mechanism is introduced to fuse functional and structural modal information during node convolution, guided by joint representation to adjust the importance of nodes in the hyperedge. Compared with previous unimodal information aggregation methods, the cross-modal node convolution can leverage cross-modal complementary information, in which the cross-modal attention mechanism effectively captures the correspondence between structural and functional brain networks, highlighting the contribution of important node features to hyperedges, thereby optimizing the aggregation of cross-modal information.
Specifically, for any hyperedge ej, the cross-modal attention integrates structural and functional modality features and learns a transformation matrix Tl (ej) based on the joint representations Xlc (ej) and the structural features Xs(ej) of the nodes contained in the hyperedge via Eq. (4). This matrix Tl (ej) captures the relationship between the cross-modal information of the involved nodes. Following this, the learned transform matrix Tl (ej) is multiplied with the input vertex feature matrix to obtain the aligned and weighted functional brain network feature matrix. This process is equivalent to combining the features of the structural modal to guide the information-weighted aggregation of the functional modal features. Finally, the transformed features are compressed using 1-D convolution to obtain the features of hyperedge ej , denoted as ylj . This step aggregates the node information into the hyperedge. The above process can be formalized as follows:
whereWlQ,WlK ,WlV are learnable parameter matrices, and dlK is the first dimension of WlK .
Hyperedge Attention Convolution. The hyperedge attention convolution is employed to aggregate the feature matrix of hyperedges Yl = {yl1 , . . . , ylj , . . . } obtained by crossmodal node convolution to obtain the updated node joint representation Xl+1 c = {xl+1 1 , . . . , xl+1 i , . . . }. To highlight important hyperedges, a self-attention mechanism is used. The hyperedge attention convolution uses an multilayer perceptron (MLP) to generate a weighted score for each hyperedge, thus discriminating the importance of multiple hyperedges corresponding to the center node. Ultimately, the output features of the center node are calculated as a weighted sum of the input hyperedge features. This process is formulated as:
where wli,j denotes the attention score of the ej towards vi, Wl is a learnable parameter matrix and |Adj(vi)| denotes the size of the adjacent hyperedge set of vi. In general, the crossmodal hypergraph convolution fuses structural and functional features through cross-modal node convolution, resulting in a hyperedge feature matrix Yl . During hyperedge attention convolution, hyperedge features are aggregated by an attention mechanism to obtain updated joint representation Xl+1 c .
3.4 Readout and Classification
After L layers of cross-modal dynamic hypergraph convolution, the obtained representation XLc effectively integrates cross-modal information. We concatenate the node representations to obtain the hypergraph-level representation ˆxc, which is then fed into an MLP for classification. The whole process is supervised with weighted cross-entropy loss.
4 Experiments
4.1 Dataset and Preprocessing
ADNI. The ADNI dataset [Jack Jr et al., 2008] is a longitudinal, multi-site, multi-modal neuroimaging dataset. This study uses a subset of the ADNI with a total of 468 cases, including 94 alzheimer's disease (AD) patients, 174 mild cognitive impairment (MCI) patients, and 200 normal controls (NCs). We preprocess the original fMRI by DPARSF, and the original DTI via PANDA.
ABIDE. The ABIDE [Heinsfeld et al., 2018] is collected from 17 international imaging sites. After data selection, only 125 subjects have both fMRI and DTI data, including 69 patients with autism spectrum disorder (ASD) and 56 NCs. The data processing procedure for the fMRI and DTI is the same as that for ADNI.
4.2 Experimental Settings
Compared Methods. The compared methods correspond to two categories. The first category refers to unimodal methods based on DTI or fMRI, including BrainGNN [Li et al., 2021], BrainIB [Zheng et al., 2024], HGNN [Feng et al., 2019], FC-HAT [Ji et al., 2022]. The second category refers to multi-modal methods based on DTI and fMRI, including BrainNN [Zhu et al., 2022], MME-GCN [Liu et al., 2022] RH-BrainFS [Ye et al., 2023], Cross-GNN [Yang et al., 2023], SGCN [Zhou et al., 2024] and MS-Inter-GCN [Xia et al., 2025].
Implement. Models are implemented in PyTorch and trained on NVIDIA 4090. Adam optimizer [Kingma, 2014] is used with an initial learning rate of 1 × 10⁻⁴ and a weight decay of 1 × 10⁻⁴ . The model is trained for 100 epochs. Using grid search, the optimal value of k in the topologyconstrained KNN is set to 3 for all classification tasks. In the topology-guided centroid sampling method, the optimal parameters k3, m, and k4 are set to 8, 3, and 5 for the AD vs. NC classification task; 9, 3, and 6 for the AD vs. MCI task; 8, 4, and 7 for the MCI vs. NC task; and 10, 4, and 6 for the ASD vs. NC task, respectively. The optimal number of layers L in the cross-modal hypergraph convolution is 2. Five-fold cross-validation is employed on the dataset, and the proposed method is evaluated in terms of four metrics: accuracy (ACC), specificity (SPE), sensitivity (SEN) and area under the curve (AUC).
4.3 Comparison Results and Analysis
Table 1 shows the comparison results of all the methods on the four brain disease tasks. Our proposed CDHGC achieves the best classification performance on all datasets. The hypergraph-based methods achieved higher accuracy in most cases compared to graph-based methods, indicating that hypergraphs can capture high-order correlations that are beneficial for classification. Most multi-modal methods outperform unimodal methods, indicating that combining functional and structural brain networks provides more comprehensive information for analyzing disease-related abnormal connectivity. In the MCI vs. NC classification task, our method increases the accuracy by more than 7.17% compared to unimodal approaches and by more than 4.90% compared to multi-modal methods. Similar improvements are observed in the other classification tasks. The key lies in the fact that the brain topology information guides the proposed method, dynamically optimizes the cross-modal hypergraph during training, and captures cross-modal high-order complementary information through the cross-modal hypergraph convolution based on the dynamic hypergraph.
| Datasets (Tasks) | AD vs. NC | AD vs. MCI | |||||||
|---|---|---|---|---|---|---|---|---|---|
| Modality | Method | ACC (%) | SPE (%) | SEN (%) | AUC (%) | ACC (%) | SPE (%) | SEN (%) | AUC (%) |
| fMRI | BrainGNN BrainIB HGNN FC-HAT | 72.11±3.80 73.82±3.57 76.20±1.73 77.22±2.70 | 73.50±5.39 81.00±4.64 79.00±1.22 80.00±2.74 | 69.11±4.09 58.42±8.22 70.29±3.74 71.34±3.81 | 73.98±4.30 75.10±4.74 76.89±5.00 76.89±4.85 | 67.66±2.23 68.04±2.08 70.26±1.55 71.00±1.42 | 70.27±5.71 72.03±4.31 76.57±1.14 74.28±4.43 | 62.75±5.82 60.64±4.08 58.54±5.91 64.85±10.95 | 63.00±6.24 61.00±7.14 65.51±4.72 67.98±9.30 |
| DTI | BrainGNN BrainIB HGNN FC-HAT | 70.41±3.43 70.41±3.43 73.80±3.36 74.82±1.42 | 72.00±5.10 70.50±5.10 75.00±5.24 77.50±1.58 | 67.01±3.91 70.16±4.44 71.22±3.05 69.12±2.38 | 73.53±4.10 73.16±3.90 74.43±3.80 75.12±4.77 | 64.52±1.41 64.90±1.51 67.92±2.07 69.28±1.50 | 67.25±1.32 67.25±1.32 70.72±3.47 74.52±3.21 | 59.47±6.14 60.53±6.23 62.75±0.82 59.59±3.98 | 59.94±4.66 58.06±3.84 59.05±4.13 62.31±4.56 |
| fMRI&DTI | BrainNN MME-GCN RH-BrainFS Cross-GNN SGCN MS-Inter-GCN CDHGC | 76.88±1.62 78.91±1.71 77.55±1.16 79.25±1.26 77.90±1.74 77.56±2.44 83.32±2.60 | 79.00±2.00 80.50±3.32 80.00±3.16 81.00±2.55 81.50±4.64 80.50±2.45 86.00±2.36 | 72.40±3.57 75.56±4.06 72.40±7.56 75.56±4.06 70.11±4.94 71.34±3.81 77.66±2.04 | 75.87±5.63 77.92±4.74 75.89±3.62 77.61±5.08 75.37±6.65 77.71±4.05 80.25±5.66 | 71.54±3.69 73.11±4.40 72.03±3.32 73.11±3.84 72.35±5.69 71.50±5.16 77.23±2.96 | 72.31±4.47 75.23±5.37 73.62±4.72 74.12±5.22 76.00±3.88 73.92±5.22 80.47±2.04 | 70.12±9.53 69.06±5.70 69.06±10.49 71.17±8.98 65.38±9.56 66.96±6.47 71.23±5.61 | 70.00±10.10 67.94±4.77 71.55±8.96 70.95±8.81 68.50±4.45 66.78±4.68 76.32±4.02 |
| Datasets (Tasks) | MCI vs. NC | ASD vs. NC | |||||||
| Modality | Method | ACC (%) | SPE (%) | SEN (%) | AUC (%) | ACC (%) | SPE (%) | SEN (%) | AUC (%) |
| fMRI | BrainGNN BrainIB HGNN FC-HAT | 62.77±2.44 61.91±4.13 63.50±4.77 65.30±6.12 | 62.34±8.94 58.33±9.65 64.50±9.67 67.37±9.12 | 65.74±8.90 66.07±6.26 62.29±9.76 62.87±9.06 | 65.26±6.05 60.08±6.35 57.00±3.19 58.55±5.55 | 64.21±3.94 65.26±6.32 66.31±4.21 69.47±2.10 | 64.00±4.66 61.28±5.96 65.46±8.91 68.55±7.08 | 64.45±10.15 70.56±6.66 67.50±10.00 70.56±10.33 | 66.63±5.52 74.29±11.65 71.84±11.18 75.57±10.53 |
| DTI | BrainGNN BrainIB HGNN FC-HAT | 60.58±2.10 60.05±2.18 61.23±2.80 62.58±4.26 | 56.33±7.91 52.33±8.79 59.50±10.05 62.50±11.83 | 65.49±6.14 68.92±6.85 63.14±6.66 62.62±5.26 | 57.63±4.00 55.66±1.75 58.14±3.72 59.13±5.07 | 61.05±4.21 61.05±2.58 62.10±3.94 64.21±5.16 | 61.09±6.76 61.46±6.02 64.73±10.82 63.64±9.96 | 61.11±8.38 60.28±6.55 58.33±13.18 65.00±9.35 | 66.70±4.51 67.93±5.18 63.08±12.97 68.52±10.99 |
| fMRI&DTI | BrainNN MME-GCN RH-BrainFS Cross-GNN SGCN | 66.64±4.68 66.57±2.29 66.84±2.04 67.12±2.78 67.04±3.68 67.57±3.16 | 68.87±5.71 69.50±5.57 71.50±3.00 74.00±9.82 70.37±5.91 72.37±3.07 | 64.02±7.82 63.14±7.36 61.43±6.88 59.17±8.05 63.14±7.58 62.00±7.54 | 62.79±3.74 64.80±4.45 65.70±3.69 66.95±2.70 63.25±4.06 63.29±4.06 | 71.58±4.21 75.79±5.37 71.58±4.21 74.73±6.14 70.52±9.76 69.47±2.10 | 70.00±6.14 73.27±8.88 73.82±10.47 72.00±9.68 72.55±13.23 70.37±3.53 | 73.61±5.69 79.45±11.05 68.89±10.15 78.89±11.19 68.06±8.70 68.06±6.86 | 75.62±7.79 79.59±9.63 73.97±10.48 75.42±8.14 76.64±12.39 77.11±8.77 |
| MS-Inter-GCN CDHGC | 72.47±3.92 | 75.50±4.85 | 68.99±4.02 | 72.44±3.64 | 81.05±2.58 | 84.00±4.90 | 77.78±7.03 | 83.54±2.53 | |
4.4 Ablation Study
To validate the effectiveness of the topology-guided dynamic hypergraph generation (TDHG) and the cross-modal hypergraph convolution (CHGConv) modules, we conduct ablation experiments, with results shown in Table 2. When the entire TDHG module is replaced with the static functional hypergraph structure, the model classification performance deteriorates. This demonstrates that TDHG can dynamically optimize the hypergraph structure to uncover potential correlations. When TDHG generates hyperedges using only the topology-constrained KNN method (T-KNN) or topologyguided centroid sampling (TCS), it results in a decrease in accuracy. This indicates that the TDHG method leverages both strengths. When the CHGConv module is replaced with an unimodal self-attention method based on FC, the accuracy decreases by more than 4.24% across the four classification tasks. This demonstrates that our method can better capture the cross-modal complementary information in the functional-structural brain network, improving the accuracy of brain disease diagnosis.
4.5 Quantitative Analysis
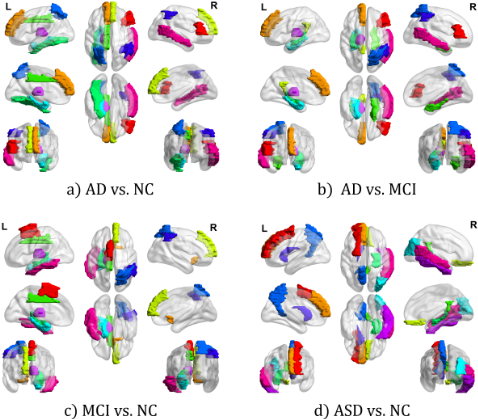
Discriminative Brain Regions Analysis. To identify the brain regions that contribute most to the classification, we measure the significance of nodes using the independent ttest and visualize the top 10 most discriminative brain regions with the smallest p-values for each task, as shown in Figure 3. For AD vs. NC, the parahippocampal gyrus (PHG), thalamus (THA), and hippocampus (HIP) show discriminative characteristics. For AD vs. MCI, regions such as the inferior parietal lobule (IPL), inferior temporal gyrus (ITG), and PHG are consistently significant, suggesting that they serve as common neural substrates affected as MCI progresses to AD [Jack et al., 2010]. For MCI vs. NC, CDHGC identifies the important regions such as superior parietal gyrus (SPG), PHG, IPL, etc. In addition to cognitive decline in MCI patients, [Mitchell et al., 2002] and [Van Hoesen et al., 2000] reported that the volume structure of the PHG is reduced in MCI patients compared to NCs, which can be an important morphological indicator. For ASD vs. NC, the precuneus (PCUN), middle temporal gyrus (MTG) and HIP are highlighted in cross-modal brain networks. As mentioned in [Kana et al., 2015], when ASD patients infer their own or others' mental states, the activation of PCUN decreases.
| TDHG | CHGConv | ADNI (AD vs. NC) | ADNI (AD vs. MCI) | ADNI (MCI vs. NC) | ABIDE (ASD vs. NC) | ||||
|---|---|---|---|---|---|---|---|---|---|
| T-KNN TCS | unimodal | cross-modal | ACC(%) | AUC(%) | ACC(%) | AUC(%) | ACC(%) | AUC(%) ACC(%) | AUC(%) |
| ✓ ✓ ✓ ✓ ✓ ✓ | ✓ | ✓ ✓ ✓ ✓ | 79.24±3.69 81.96±3.20 77.20±5.00 78.22±4.51 83.32±2.60 | 76.21±2.67 78.72±4.60 75.42±3.35 76.18±3.97 80.25±2.36 | 71.98±5.06 75.75±3.01 71.24±4.07 72.99±5.50 77.23±2.96 | 71.25 ±5.07 74.37±3.09 69.89±4.98 72.62±3.68 76.32±4.02 | 68.20±5.18 70.87±4.31 66.59±3.34 67.66±2.71 72.47±3.92 | 68.78±3.49 75.79±5.37 71.03±2.56 78.94±3.33 66.99±2.51 73.68 ±3.33 68.44±3.94 74.73±6.14 72.44±3.64 81.05±2.58 | 76.89±4.69 80.36±3.35 72.35±3.99 73.12±5.68 83.54±2.53 |
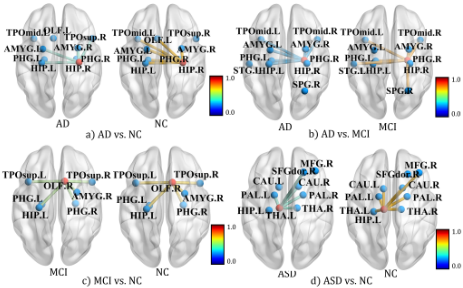
Discriminative Hyperedge Analysis. We analyze the discriminative connectivity of cross-modal brain networks in diseased and normal groups for each classification task, from a high-order correlation perspective. By performing a independent t-test on the hyperedge features, we identify significant hyperedges, which are visualized in Figure 4. For AD vs. NC, the centroid of the discriminative hyperedge is HIP.R. AD patients have fewer connections with PHG.L and left olfactory cortex (OLF.L) compared to normal brains. Also, the connection between HIP and the amygdala (AMYG) weakens, indicating reduced memory and cognitive functions. Conversely, HIP gains a connection to right superior temporal gyrus (TPOsup.R), which might be a compensatory mechanism for semantic memory impairment [Pievani et al., 2011]. For ASD vs. NC, the centroid of the discriminative hyperedge is THA.L. Compared to NCs, THA.L in ASD patients loses connections with HIP.L and MFG.R, with overall reduced connection strength. This suggests that cross-modal connectivity between the THA, HIP, and frontal regions is weakened, reflecting sensory and social cognition abnormalities in ASD patients, where the THA.L-MFG.R disconnection may be related to attention deficits [Monk et al., 2009]. Please see the appendix for details.
5 Conclusion
In this study, we introduce a cross-modal dynamic hypergraph computation to achieve accurate brain disease diagnosis by integrating information from functional and structural brain networks. The proposed CDHGC framework comprises two key modules: the topology-guided dynamic hypergraph generation models high-order correlations within the cross-modal brain networks based on topological structure and dynamically optimizes the hypergraph structure to mine potential correlations during training. The cross-modal hypergraph convolution aggregates functional-structural brain network information through a cross-modal attention mechanism in message passing to obtain high-order joint representations. Experimental results on two datasets demonstrate the superior performance of the proposed method.
Acknowledgments
This work was supported by the National Key Research and Development Program of China under Grant No. 2025ZD0217300, Fundamental and Interdisciplinary Disciplines Breakthrough Plan of the Ministry of Education of China under Grant No. JYB2025XDXM504, the National Natural Science Foundation of China under Grant Nos. 62501462 and 62125305, Guangdong Major Project of Basic and Applied Basic Research under Grant No. 2023B0303000009, the Postdoctoral Research Funding Project of Shaanxi Province under Grant No. 2025BSHSDZZ023, and the Science and Technology Projectof China Huaneng Group Co., Ltd. under Grant No. HNKJ23-HF67.
@inproceedings{ijcai2026p401,
  title     = {Cross-Modal Dynamic Hypergraph Computation via Functional-Structural Brain Network for Brain Disorder Diagnosis},
  author    = {Feng, Jingxi and Xu, Heming and Xue, Rundong and Cai, Junhao and Chen, Xudong and Zhang, Dong and Du, Shaoyi},
  booktitle = {Proceedings of the Thirty-Fifth International Joint Conference on
               Artificial Intelligence, {IJCAI-26}},
  publisher = {International Joint Conferences on Artificial Intelligence Organization},
  editor    = {Diego Calvanese},
  pages     = {3603--3611},
  year      = {2026},
  month     = {8},
  note      = {Main Track},
  doi       = {10.24963/ijcai.2026/401},
  url       = {https://doi.org/10.24963/ijcai.2026/401},
}
TY - CPAPER TI - Cross-Modal Dynamic Hypergraph Computation via Functional-Structural Brain Network for Brain Disorder Diagnosis AU - Feng, Jingxi AU - Xu, Heming AU - Xue, Rundong AU - Cai, Junhao AU - Chen, Xudong AU - Zhang, Dong AU - Du, Shaoyi T2 - Proceedings of the Thirty-Fifth International Joint Conference on Artificial Intelligence, IJCAI-26 PB - International Joint Conferences on Artificial Intelligence Organization PY - 2026 SP - 3603 EP - 3611 DO - 10.24963/ijcai.2026/401 UR - https://doi.org/10.24963/ijcai.2026/401 ER -Copied
Machine-readable versions of this paper, for tools and AI agents:





