
Multiscale-adaptive and Size-adaptive PSO-based Feature Selection for Gene Expression Analysis
Proceedings of the Thirty-Fifth International Joint Conference on Artificial Intelligence. AI and Health. Pages 6689-6697.
https://doi.org/10.24963/ijcai.2026/744
Keywords
- Genomic data analysis: Genomic data analysis
- Health data mining: Health data mining
Abstract
In gene expression analysis, high dimension low sample size data limits the applicability of deep learning, motivating increasing interest in variable-length evolutionary algorithm–based feature selection methods (VLEAs). However, existing VLEAs suffer from unreliable single-metric discrimination under dynamic search-space variation, mismatches between population size and search space dimensionality, and particle performance degradation after search space changes. To this end, a Multiscale-adaptive and Size-adaptive Particle Swarm Optimization (MASA-PSO) is proposed for gene expression analysis. MASA-PSO adopts a multiscale-adaptive weighting framework to explore feature subsets that distinguish between-class sample distributions during search spaces changes, and theoretically proves it enables the collaborative evaluation of multiple metrics. Meanwhile, it proposes an adaptive population division that explicitly models the functional relationship between the population size and the search space to resolve the mismatch. Furthermore, a particle degradation phenomenon impairing the performance of VLEAs is observed and alleviated through a hybrid elite strategy. Experiments on ten gene expression datasets verify that MASA-PSO outperforms state-of-the-art methods in classification accuracy while capturing smaller feature subsets.
- [Ahadzadeh et al., 2023] Behrouz Ahadzadeh, Moloud Ab- dar, Fatemeh Safara, Abbas Khosravi, Mohammad Bagher Menhaj, and Ponnuthurai Nagaratnam Suganthan. Sfe: A simple, fast, and efficient feature selection algorithm for high-dimensional data. IEEE Transactions on Evolution- ary Computation, 27(6):1896-1911, 2023.
- [Antonio and Coello, 2013] Luis Miguel Antonio and Carlos A. Coello Coello. Use of cooperative coevolution for solv- ing large scale multiobjective optimization problems. In 2013 IEEE Congress on Evolutionary Computation, pages 2758-2765, 2013.
- [Bonyadi and Michalewicz, 2017] Mohammad Reza Bonyadi and Zbigniew Michalewicz. Particle swarm optimization for single objective continuous space prob- lems: a review. Evolutionary computation, 25(1):1-54, 2017.
- [Chattopadhyay and Lu, 2019] Amrita Chattopadhyay and Tzu-Pin Lu. Gene-gene interaction: the curse of dimen- sionality. Annals of translational medicine, 7(24):813, 2019.
- [Deng et al., 2020] Li-Bao Deng, Li-Li Zhang, Ning Fu, Hai-li Sun, and Li-Yan Qiao. Erg-de: An elites regen- eration framework for differential evolution. Information Sciences, 539:81-103, 2020.
- [Derrac et al., 2011] Joaquín Derrac, Salvador García, Daniel Molina, and Francisco Herrera. A practical tutorial on the use of nonparametric statistical tests as a method- ology for comparing evolutionary and swarm intelligence algorithms. Swarm and Evolutionary Computation, 1(1):3-18, 2011.
- [Dubey and Saxena, 2016] Vimal Kumar Dubey and Amit Kumar Saxena. Cosine similarity based filter technique for feature selection. In 2016 International Conference on Control, Computing, Communication and Materials (ICCCCM), pages 1-6. IEEE, 2016.
- [Han et al., 2025] Fei Han, Yutao Liang, Qinghua Ling, and Henry Han. An improved conditional wasserstein gan with gradient penalty for gene expression profiling data aug- mentation based on data segmentation and depth feature constraint. IEEE Transactions on Computational Biology and Bioinformatics, 2025.
- [Happy et al., 2017] S L Happy, Ramanarayan Mohanty, and Aurobinda Routray. An effective feature selection method based on pair-wise feature proximity for high dimensional low sample size data. In 2017 25th European Signal Pro- cessing Conference (EUSIPCO), pages 1574-1578, 2017.
- [Hinton and Roweis, 2002] Geoffrey E Hinton and Sam Roweis. Stochastic neighbor embedding. Advances in neu- ral information processing systems, 15, 2002.
- [Horn and Johnson, 2012] Roger A Horn and Charles R Johnson. Matrix analysis. Cambridge university press, 2012.
- [Huang et al., 2023] Siquan Huang, Yijiang Li, Chong Chen, Leyu Shi, and Ying Gao. Multi-metrics adaptively identi- fies backdoors in federated learning. In 2023 IEEE/CVF International Conference on Computer Vision (ICCV), pages 4629-4639, 2023.
- [Kucharavy and De Guio, 2011] Dmitry Kucharavy and Roland De Guio. Application of s-shaped curves. Procedia Engineering, 9:559-572, 2011.
- [Liu et al., 2017] Bo Liu, Ying Wei, Yu Zhang, and Qiang Yang. Deep neural networks for high dimension, low sam- ple size data. In IJCAI, volume 2017, pages 2287-2293, 2017. IJCAI
- [Loaiza-Ganem et al., 2024] Gabriel Loaiza-Ganem, Bren- dan Leigh Ross, Rasa Hosseinzadeh, Anthony L Caterini, and Jesse C Cresswell. Deep generative models through the lens of the manifold hypothesis: A survey and new connections. arXiv preprint arXiv:2404.02954, 2024.
- [Min et al., 2017] Seonwoo Min, Byunghan Lee, and Sun- groh Yoon. Deep learning in bioinformatics. Briefings in bioinformatics, 18(5):851-869, 2017.
- [Noor and Ige, 2025] Mohd Halim Mohd Noor and Ayokunle Olalekan Ige. A survey on state-of-the-art deep learning applications and challenges. Engineering Applications of Artificial Intelligence, 159:111225, 2025.
- [Qu et al., 2023] Litao Qu, Weibin He, Jianfei Li, Hua Zhang, Cheng Yang, and Bo Xie. Explicit and size- adaptive pso-based feature selection for classification. Swarm and Evolutionary Computation, 77:101249, 2023.
- [Rangasamy et al., 2021] Devi Priya Rangasamy, Sivaraj Rajappan, Anitha Natarajan, Rajadevi Ramasamy, and De- visurya Vijayakumar. Variable population-sized particle swarm optimization for highly imbalanced dataset classifi- cation. Computational Intelligence, 37(2):873-890, 2021.
- [Ravindran and Gunavathi, 2023] U Ravindran and C Guna- vathi. A survey on gene expression data analysis using deep learning methods for cancer diagnosis. Progress in Biophysics and Molecular Biology, 177:1-13, 2023.
- [Reshef et al., 2011] David N Reshef, Yakir A Reshef, Hi- lary K Finucane, Sharon R Grossman, Gilean McVean, Peter J Turnbaugh, Eric S Lander, Michael Mitzenmacher, and Pardis C Sabeti. Detecting novel associations in large data sets. science, 334(6062):1518-1524, 2011.
- [Saadatmand and Akbarzadeh-T, 2024] Hassan Saadatmand and Mohammad-R Akbarzadeh-T. Many-objective jaccard-based evolutionary feature selection for high- dimensional imbalanced data classification. IEEE Trans- actions on Pattern Analysis and Machine Intelligence, 46(12):8820-8835, 2024.
- [Tran et al., 2016] Binh Tran, Mengjie Zhang, and Bing Xue. A pso based hybrid feature selection algorithm for high-dimensional classification. In 2016 IEEE congress on evolutionary computation (CEC), pages 3801-3808. IEEE, 2016.
- [Tran et al., 2017] Binh Tran, Bing Xue, and Mengjie Zhang. A new representation in pso for discretization- based feature selection. IEEE Transactions on Cybernet- ics, 48(6):1733-1746, 2017.
- [Tran et al., 2018] Binh Tran, Bing Xue, and Mengjie Zhang. Variable-length particle swarm optimization for feature selection on high-dimensional classification. IEEE Transactions on Evolutionary Computation, 23(3):473- 487, 2018.
- [Wang et al., 2020] Hongzhi Wang, Chengquan He, and Zhuping Li. A new ensemble feature selection ap- proach based on genetic algorithm. Soft Computing, 24(20):15811-15820, 2020.
- [Xue et al., 2015] Bing Xue, Mengjie Zhang, Will N Browne, and Xin Yao. A survey on evolutionary compu- tation approaches to feature selection. IEEE Transactions on evolutionary computation, 20(4):606-626, 2015.
- [Yazdani et al., 2023] Delaram Yazdani, Danial Yazdani, Donya Yazdani, Mohammad Nabi Omidvar, Amir H Gan- domi, and Xin Yao. A species-based particle swarm optimization with adaptive population size and deactiva- tion of species for dynamic optimization problems. ACM Transactions on Evolutionary Learning and Optimization, 3(4):1-25, 2023.
- [Yu and Zhang, 2014] Xiang Yu and Xueqing Zhang. En- hanced comprehensive learning particle swarm optimiza- tion. Applied Mathematics and Computation, 242:265- 276, 2014.
- [Zhou et al., 2012] Xinyu Zhou, Zhijian Wu, and Hui Wang. Elite opposition-based differential evolution for solving large-scale optimization problems and its implementation on gpu. In 2012 13th international conference on parallel and distributed computing, applications and technologies, pages 727-732. IEEE, 2012.
- [Zhou et al., 2022] Junhai Zhou, Quanwang Wu, Mengchu Zhou, Junhao Wen, Yusuf Al-Turki, and Abdullah Abu- sorrah. Lagam: A length-adaptive genetic algorithm with markov blanket for high-dimensional feature selec- tion in classification. IEEE Transactions on Cybernetics, 53(11):6858-6869, 2022.
References were extracted automatically from the PDF and may contain errors.
Full text extracted automatically from the PDF; figures, tables and equations may differ. The PDF is the version of record.
1 Introduction
Gene expression analysis and cancer diagnosis are representative and widely studied problems in the bioinformatics and medical research [Ravindran and Gunavathi, 2023]. These tasks typically involve numerous features, and the high cost acquisition severely limits the sample sizes, resulting in high-dimension low-sample size (HDLSS) datasets[Liu et al., 2017] and the curse of dimensionality [Chattopadhyay and Lu, 2019]. Despite the success of deep learning (DL) in vision and language domains, significant challenges remain in this fields [Noor and Ige, 2025]. The characteristics of HDLSS datasets make it difficult for most DL approaches based on manifold assumptions to learn informative and interpretable representations [Loaiza-Ganem et al., 2024]. Moreover, the class imbalance in biological data further increases the risk of overfitting [Min et al., 2017].
*Corresponding author: Fei Han; Code and datasets are available at https://anonymous.4open.science/r/MASA-PSO-15FE/.
In this context, feature selection (FS), particularly evolutionary algorithm (EA) methods, receives considerable attention due to its ability to significantly reduce dimensionality, enhance interpretability, and avoid manifold assumptions [Xue et al., 2015]. Among EAs, particle swarm optimization (PSO) has been widely applied to optimization tasks as its fast convergence and robustness in high-dimensional spaces [Bonyadi and Michalewicz, 2017]. However, EAs often suffer from high computational and memory costs in HDLSS biological datasets. To address this, Tran et al. [Tran et al., 2018] proposed VLPSO, which dynamically adjusts the search space via length-adaptive and mutual learning mechanisms, enabling more efficient discovery of compact feature subsets with better classification performance. It has inspired subsequent variable-length mechanisms EAs (VLEAs) in bioinformatics and medical applications. For instance, Qu et al. [Qu et al., 2023] designed a PSO with the explicit feature representation (ESAPSO) to further reduces computational cost and memory usage. Nonetheless, existing VLEAs [Tran et al., 2018; Qu et al., 2023; Zhou et al., 2022] typically construct different search space sizes through feature grouping, while overlooking the mismatch between population size and space size. A subgroup with the excessively small search space may impair collaborative search and miss the global optimum, while a subgroup with too large search space may lead to redundant exploration of similar regions, resulting in wasted search resources and increased computational cost [Antonio and Coello, 2013].
In addition, due to the curse of dimensionality, most existing EAs including VLEAs commonly adopt Manhattan distance to measure sample distances to capture differences in distributions among different labels [Tran et al., 2018; Qu et al., 2023; Antonio and Coello, 2013]. However, the effect of a single distance metric is less desirable for HDLSS FS problems [Happy et al., 2017]. During the variable-length process, the sample distribution dynamically changes with the search space, making single distance metrics like Manhattan distance potentially unreliable for consistent identification. [Huang et al., 2023].
Remarkably, in the study of VLEAs, we observed that a certain number of particles experience a sudden drop in performance after search space changes. This phenomenon has not been explicitly reported in prior VLEAs.
To this end, a novel multiscale adaptive and size-adaptive PSO algorithm (MASA-PSO) for gene expression analysis is proposed. It not only includes an adaptive weighting discrimination framework but also resolves the mismatch between population size and search space. Additionally, a hybrid elite strategy is proposed to mitigate the degradation of particles. The main contributions are as follows:
- A novel multiscale-adaptive weighting framework is creatively proposed, which integrates three distance metrics to measure sample distributions for fitness evaluation, aiming at enhancing the algorithm's discrimination and stability.
- Designing an adaptive division mechanism that initializes population based on a function measuring the matching degree between the population and the search space, addressing the imbalance of search capabilities among groups.
- Discovering and analyzing the degradation of particles induced by search space variation, and proposing a hybrid strategy to alleviate this problem.
- Extensive experiments on ten HDLSS gene expression datasets show that MASA-PSO outperforms compared stateof-the-art (SOTA) methods.
2 RelatedWork
2.1 Variable-Length Particle SwarmOptimization
As an important branch of EAs [Bonyadi and Michalewicz, 2017], PSO iteratively updates a swarm of particles in a Ddimensional search space, where each particle represents a candidate solution characterized by a position and a velocity. The quality of each particle's current candidate solution is evaluated by a fitness function. Guided by its local best (pbest) and the global best (gbest) among the swarm, particles move toward the promising regions and find the optimal solution based on the following equations,
where xti,d and vt i,d are the dth position and velocity of the ith particle at time t, respectively. pbestti,d and gbesttd are the local best position of the ith particle and global best position for the whole swarm in dimension d at time t. c1 and c2 are two positive constants. ω is the inertia weight. r1 and r2 are two random values uniformly distributed ranging from 0 to 1.
VLPSO [Tran et al., 2018] is the first length-adaptive PSO in high-dimensional FS, adopting the feature grouping from cooperative coevolution and a comprehensive learning strategy [Yu and Zhang, 2014] to accelerate convergence. Specifically, VLPSO relies on pbest alone for particle guidance and introduces a self-adaptive probability. It achieves a smaller feature subset and better classification accuracy in less time. However, VLEAs[Tran et al., 2018; Qu et al., 2023] ignored the population size in division which led to inefficient utilization of search resources. Yazdani et al. [Yazdani et al., 2023] suggested that there is a lack of a functional relationship between population and the search.
2.2 Distance metrics in high-dimensional FS
In high-dimensional FS, some EAs aim for higher accuracy and smaller feature subsets that introduced distance metrics. Most VLEAs [Tran et al., 2018; Qu et al., 2023] utilized the Manhattan distance as in Eq.(3).
Yuan et al. [Dubey and Saxena, 2016] applied cosine distance for FS as Eq.(4), which is also noteworthy.
Moreover, Huang et al. [Huang et al., 2023] showed that Euclidean distance as Eq.(5) may not be entirely ineffective in high-dimensional spaces.
2.3 Maximal Information Coefficient
Maximal Information Coefficient (MIC) is a correlation measure that features generality and equitability [Reshef et al., 2011]. It finds partitions schemes via grid search to maximize the mutual information, assessing the association between two variables. The formula is as follows,
where a, b are the partition numbers in directions of features F and labels C, with the constraint ab ≤ B(n). n is the dataset size. Ia,b(F;C) is the maximum mutual information under constraint a, b. MIC(F;C) ∈ [0, 1], where a higher value means a stronger correlation between F and C, and vice-versa. Typically, B(n) = n0.6 .
3 The ProposedMethod
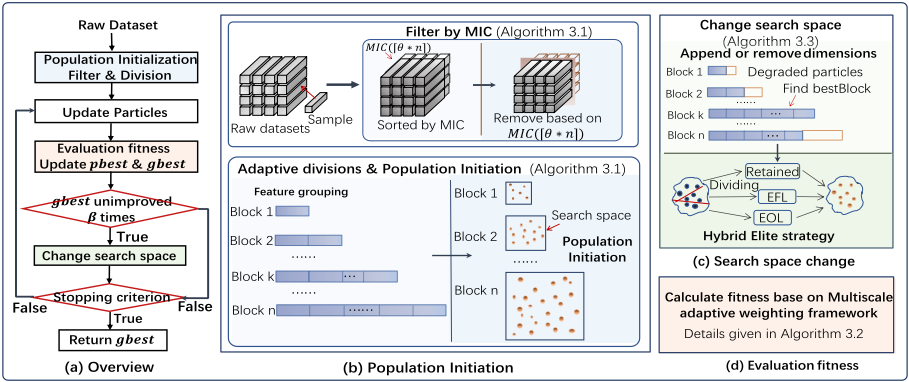
This section elaborates the proposed MASA-PSO. As shown in Figure.1, the MASA-PSO is divided into three main parts. The initial part covers a filtering step to eliminate useless features and an adaptive division mechanism for initializing population that make it suitable for corresponding search spaces. In the second part, we propose a fitness with multiscale adaptive discrimination framework based on adaptive weighting of multiple metrics. The last part proposes a hybrid elite strategy to mitigate the particles degradation phenomenon in most existing VLEAs when search space changes.
3.1 Particle Initialization
Feature Ranking and Filtering In this study, the filtering threshold is MIC(⌈θr · m⌉), where m is the number of raw features. It denotes the value ranked in descending order at position ⌈θr·m⌉. Features with weak correlations to labels are removed. The remaining features form a set F in descending order based on MIC values. Note that θr = 0.7.
Adaptive Division and Population Initialization Existing VLEAs divides the population into several equal-size subpopulations for cooperation learning, which may lead to inefficient resource utilization when search space sizes vary significantly across different subpopulation [Yazdani et al., 2023]. Inspired by the S-shaped growth curve of species in constrained environments [Kucharavy and De Guio, 2011; Rangasamy et al., 2021], we design a novel adaptive division mechanism that measures the relationship between population and search space based on Eqs.(7)(8). By approximating the S-curve growth pattern, this mechanism dynamically adjusts initial population sizes according to each block's search space dimensions, thereby enhancing search efficiency.
where i, ˜ι is the block number and the median number of blocks, F is the number of features, M is the total number of blocks. Popmin is the minimum population size, Popup is the maximum increase number of populations. This function allows the search space to expand as the number of groups increases, with the corresponding population size growing accordingly until it reaches Popmin +Popup. (The whole operations see Algorithm 1)
3.2 Multiscale Adaptive Discrimination
VLEAs typically evaluate candidate solutions via a fitness function that combines classification accuracy with singledistance-based discrimination scores [Tran et al., 2018; Qu et al., 2023]. However, these single-distance metrics are difficult to maintain desired identification during search-space variation. To this end, we propose a fitness with the classification accuracy and a multiscale adaptive discrimination framework as Eq.(9). This framework dynamically weights Manhattan, Euclidean, and cosine distances to calculate an aggregation score. A logistic function is then constructed to maximize within-class aggregation while minimizing betweenclass aggregation.(Algorithm 2)
where γ is a weight set to 0.8, BACC is the balanced accuracy [Tran et al., 2016] for the imbalanced high-dimensional datasets as Eq.(10). Scoreagg is the aggregation score based on the adaptive weighting of three distances.
where C is the number of classes, TP c and Nc are the number of true positive samples and the total number of samples for the cth class, respectively.
Multiscale Adaptive Weighting Mechanism For a given feature subset, the distances between samples are calculated upon Eqs.(3-5), as distance sets {Dstl (si, sj ) | 1 ≤ i, j ≤ n, i ̸= j}, where l only denotes Manhattan, Euclidean, and cosine distance in this paper.
For each class c, the sample set is divided into the cclass set Sc = {sci |i = 1, 2, . . . , nc} and the non-c class set S¬c = {s¬c i |i = 1, 2, . . . , n¬c}, where nc and n¬c are the number of samples of Sc and S¬c. The distances of within-class sample pairs in Sc and of between-class sample pairs between Sc and S¬c are formulated as distance sets Dstl(Sc) = {Dstl(sci , scj ) | 1 ≤ i, j ≤ nc} and Dstl(Sc, S¬c) = {Dstl(sci , s¬c j )| 1 ≤ j ≤ n¬c}.
Algorithm 1 The particles initialization.
Input: Raw training set D, the number of blocks M, minimum population size Popmin, maximum population growth size Popup, the total number of features m, se-
lect threshold θr. Output: {Blocki|Blocki = {Xi,1,Xi,2, · · · ,Xi,pSizei }, i = 1, · · ·,M}. ▷ Swarm 1: CalculateMICj for each feature fj on D. ▷ Eq.(6) 2: Sort {fj} in descending order of {MICj}. 3: τ ←MIC(⌈θr · m⌉). 4: D← {fj ∈ D |MICj ≥ τ}. ▷ Filter step 5: for i = 1 toM do ▷ Adaptive division mechanism 6: Calculate feature space ParLeni of block i. ▷ Eq.(7) 7: Calculate population size pSizei of block i. ▷ Eq.(8) 8: for p = 1 to pSizei do ▷ Initializing swarm 9: for d = 1 to ParLeni do 10: posdi,p ←rand(0, 1). ▷ Position of particle Xi,p 11: if posdi,p > θr then 12: fd ← 1 13: else 14: fd ← 0 15: end if 16: end for 17: pbestp ← Xp, f itness(pbestp) ← f itness(Xp). 18: end for 19: end for 20: gbest ← argmax Xi,p {fitness(Xi,p)}. ▷ Initialize gbest 21: return {Blocki|Blocki = {Xi,1, · · · ,Xi,pSizei }, i = 1,· · ·,M}.Then the within-class and between-class joint distance vectors for each sample sci is constructed as follows,
where Dstl(sci ,Sc) and Dstl(sci ,S¬c) are selected from Dstl(Sc) and Dstl(Sc, S¬c), representing distances between sci and samples of Sc and of S¬c, respectively. Within-class vector Dstw(sci ) is defined as the three maximum distance metrics in Dstl(sci , Sc), reflecting the clustering degree of class c centered on sci , while between-class vector Dstb(sci ) is the three minimum distance metrics in Dstl(sci , S¬c), indicating the distance from ¬c samples.
For all c class samples, the within-class matrix Xw(c) and the between-class matrix Xb(c) are constructed as follows,
where Xw(c) and Xb(c) are 3×nc matrices, with columns denoting the maximum within-class and the minimum betweenclass joint distance vectors, respectively.
Algorithm 2 The fitness calculation procedure.
Input: Training set S = {si|1 ≤ i ≤ n}, Classes of training
- set C, particle Xp, and outlier threshold θz. Output: fitness(Xp). 1: for each sample si ∈ S do ▷ Select features 2: Remove features not selected by particle Xp in si 3: end for 4: for l ∈{Eul,Man,Cos} do ▷ Calculate three distances 5: Calculate{Dstl(si,sj)| ∀(si,sj)∈S} via Eqs.(3-5). 6: end for 7: for class c ∈ C do ▷ Calculate the aggregation score 8: Sc←{sci | i = 1, . . . , nc}, S¬c ←S \ Sc. 9: Dstl(Sc)←{Dstl(sci , scj )| 1 ≤ i, j ≤ nc} 10: Dstl(Sc, S¬c) ← {Dstl(sci , s¬c j )| 1 ≤ j ≤ n¬c}. 11: for each sample sci ∈ Sc do 12: Obtain Dstw(sci ),Dstb(sci ) based on Eqs.(11)(12). 13: end for 14: Xw(c) ← {Dstw(sci ) | i = 1, 2, . . . , nc } ▷ Eq.(13) 15: Xb(c) ← {Dstb(sci ) | i = 1, 2, . . . , nc } ▷ Eq.(14) 16: Calculate δw(c) and δb(c) via Eqs.(15)(16). 17: end for 18: δw ← 1C ∑Cc=1 δw(c), δb ← 1C ∑Cc=1 δb(c). ▷ Average score 19: f ←- δw-δb len , Scoreagg ← 1 1+ef . ▷ Normalize scores 20: fitness(Xp)←γ·BACC+(1-γ)·Scoreagg. ▷ Eq.(9) 21: return fitness(Xp).
To integrate three distance metrics for collaboratively discriminating the dynamically changing sample distributions, while eliminating interference from correlations and dimensional inconsistency among these distance metrics, this paper develops a novel adaptive weighting framework based on precision matrix [Horn and Johnson, 2012] (Proof of decorrelation and dimension unity is in Supplementary A). Specifically, for each class c, the aggregation score of within-class δw(c) and the aggregation score of between score δb(c) are carried out via weighting operation as follows,
where k = {w, b}, µk(c) is the average joint distance vector for all samples in Xk(c). The precision matrix Pk(c) is the inverse of covariance matrix Σk(c) calculated by Eq.(16).
where the constrain nc > 3 ensures that the precision matrix can be obtained, and the main diagonal elements of the precision matrix measure the guidance ability of three distance metrics in the given feature space [Horn and Johnson, 2012].
The average within-class score δw and the average between-class score δb are calculated, based on δk = 1C ∑Cc=1 δk(c), where C is the number of classes. Inspired by the work [Tran et al., 2017], the fitness is integrated by maximizing δw, minimizing δb, and normalizing the score to [0, 1]. Since the precision matrix implies the information of features
Algorithm 3 The procedure of Elite hybrid strategy.
Output: {Blocki|Blocki ={Xi,1,Xi,2,· · · ,Xi,pSizei }, i =
1, · · ·,M}.
▷ New Swarm
- 1: E← argmax Blocki∈Swarm∑fitness(Xi,j),j=1,...,pSizei. ▷ Elite
- 2: for Blocki in Swarm do
- 3: for each Xi,j ∈Blocki do ▷ Compute forgotten value 4: Calculate the difference of fitness(Xi,j) before and after the search space changes, as fgj.
- 5: if fgj < 0 then ▷ Collect the degraded particles 6: SF ← SF ∪ {Xi,j}.
- 7: end if
- 8: end for
- 9: Sort SF by fgj in descending order.
- 10: EOL←The bottom ⌈θe· |SF |⌉ particles in SF .
- 11: EFL←The next ⌈θe· |SF |⌉ particles in SF .
- 12: R←The rest particles in SF .
13: EOL←EOLS(EOL, θs).
▷ EOL strategy
14: EFL←EFLS(EFL,E, θs).
▷ EFL strategy
- 15: Blocki ←EOL∪EFL∪R. ▷ Update block
- 16: end for
- 17: return Swarm.
[Horn and Johnson, 2012], a larger feature subset contains more information but hinder compact exploration, a regularization term len (the size of feature subset) is introduced to constrain the subset size.
3.3 Hybrid Elite Strategy for Degraded Particles
In experiments, we observed that many particles in VLEAs experience performance degradation as the search space shifts toward more promising regions. VLEAs alter particle lengths by truncating or appending features, causing deviations from the search direction. The search efficiency of these particles is impaired. Although it is inherently inevitable, a hybrid strategy based on elite forward learning (EFL) [Deng et al., 2020] and elite opposition learning (EOL) [Zhou et al., 2012] is proposed to alleviate it. Specifically, degraded particles of each block are divided among EOL, EFL and retention group R based on their degradation degree, where the most severely degraded ⌈θe · |SF |⌉ particles are assigned to EOL, the next ⌈θe · |SF |⌉ particles undergo EFL, and the remaining particles form R. The reinitialized particles from both elite strategies, combined with R, form a new population for each block. Note that θe is the elite select threshold, SF is the degraded particles set (Algorithm 3). The pseudocode of EFL and EOL strategy are in Supplementary B.
Elite Forward Learning Strategy For EFL group, the block with the highest average fitness is selected as the elite population E = {E1,E2, · · · ,En}. The selection probability of each feature is calculated as the ratio of times each feature is selected to the total number of occurrences of all features in E, the probability of each feature is as follows,
where Fnumi represents the times of feature Fi selected by E, d is the given subset size. A roulette wheel selection [Wang et al., 2020] is constructed to re-initialize particles based on these probabilities. The fitness of particles is evaluated before and after re-initialization, with only the higher fitness particles being retained.
Elite Opposition Learning Strategy For EOL group, since severe degradation after space changes indicates that the development value of their opposition space may exceed that of their original space [Zhou et al., 2012]. Hence, an elite opposition learning strategy is introduced to tackle variable-length forgetting. Let Pi = (pi,1, pi,2,· · ·,pi,d), i = 1, 2, · · · , n. represents the position of the ith degraded particles of Blocki. The opposition solution ˇ Pi is defined as follows,
where k ∈ U(0, 1) is a coefficient representing the magnitude of opposition, daj and dbj are the upper and lower bounds of Blocki in feature dimension j, as follows,
These particles are re-initialized based on the opposition solutions, and their fitness before and after initialization are compared. Particles with higher fitness are retained.
4 Experiments and Results Analysis
4.1 Experimental Setup
Benchmark Datasets 10 widely used gene expression datasets are selected to verify the performance of MASAPSO. These datasets are described in Table 1, which includes the ratio of the largest and smallest classes. Most of them are imbalanced, high-dimensional, and low-sample size that make classification particularly challenging and representative of many real-world bioinformatics and medical diagnosis problems. Experimental results on these datasets effectively demonstrate the performance of the proposed algorithm.
Baseline Methods To evaluate the performance of MASAPSO, this paper compares it with six SOTA methods in gene expression analysis, including VLPSO, ESAPSO, ManyObjective Jaccard-Based Evolutionary algorithm (JSEMO) [Saadatmand and Akbarzadeh-T, 2024], a Simple, Fast, and Efficient FS Algorithm (SFE) [Ahadzadeh et al., 2023], and an Improved Conditional Wasserstein GAN With Gradient Penalty (CWGANGP) [Han et al., 2025]. These methods involve VLEAs, other FS methods, and deep learning-based models, all of which have demonstrated competitive performance in gene expression analysis and are therefore representative baselines for comparison.(The comparative experiments with other SOTA methods and hyperparameter optimization are shown in Supplementary D and E)
| Dataset | Feature | Sample | Class | Min(%) | Max(%) |
|---|---|---|---|---|---|
| SRBCT | 2,308 | 83 | 4 | 13 | 35 |
| DLBCL | 5,469 | 77 | 2 | 25 | 75 |
| 9 Tumors | 5,726 | 60 | 9 | 3 | 15 |
| Leukemia1 | 5,327 | 72 | 3 | 13 | 53 |
| Leukemia2 | 11,225 | 72 | 3 | 28 | 39 |
| Brain Tumor1 | 5,920 | 90 | 5 | 4 | 67 |
| Brain Tumor2 | 10,367 | 50 | 4 | 14 | 30 |
| Prostate | 10,509 | 102 | 2 | 49 | 51 |
| Lung Cancer | 12,600 | 203 | 5 | 3 | 68 |
| 11 Tumors | 12,533 | 174 | 11 | 4 | 16 |
| Parameters | Setting |
|---|---|
| Maximum iterations | 100 |
| c1, c2 | 1.49445 |
| w | 0.9 - 0.5· Itercurr Itermax |
| Threshold for selected feature(θs) | 0.6 |
| Max iterations for renew exemplars (α) | 7 |
| Max iterations for length changing(β) | 9 |
| Minimum population size (Popmin) | 10 |
| Maximum population growth size (Popup) | 20 |
| The number of block (M) | 5 |
| Feature filtering threshold (θr) | 0.7 |
| Particles grouping threshold (θe) | 0.2 |
Experiment Settings ALL baselines use the authors' recommended settings, while MASA-PSO parameters are detailed in Table 2. To ensure fairness, all FS methods employed K-nearest neighbor (KNN) with K = 1 classifier. Each dataset undergoes 30 independent runs using ten-fold cross validation. Leave-one-out validation on the training set evaluates candidate solutions. Performance is measured by the mean and standard deviation of BACC and the size of selected features. The Wilcoxon significance test [Derrac et al., 2011] with a 5% significance level is applied. All experiments are conducted on PC with Intel Core I7-14700KF @3.4GHz.
4.2 Experimental Results and Discussion
This section comprehensively presents the performance of MASA-PSO and five SOTA methods. Table 3 displays the results on ten gene expression datasets. " " denotes the size of final feature subset, "Best" represents the best result over 30 runs. "S" indicates the Wilcoxon significance test results, where "+" signifies a significant improvement of our algorithm over the baseline, "-" indicates that our method's BACC is significantly lower than the baseline, and "=" means no significant difference. (The computational and time cost analysis is detailed in Supplementary C)
(1) Comapred with CWGAN-GP, MASA-PSO achieves significantly better classification performance on most datasets, especially on highly imbalanced datasets (e.g., DLBCL, Bran Tumor1,and Lung Cancer).It suggests that the deep models are vulnerable to noise and prone to overfitting in HDLSS scenarios, while MASA-PSO effectively identifies informative feature subsets and offers robustness and interpretability, which is beneficial for subsequent gene analysis.
| Dataset | Method | Size | Best | Mean±Std(%) | S |
|---|---|---|---|---|---|
| SRBCT | SFE | 76.50 | 98.75 | 96.26±2.06 | + |
| VLPSO | 49.10 | 100 | 99.67±0.52 | = | |
| ESAPSO | 47.80 | 100 | 99.50±0.76 | = | |
| CWGAN-GP | 128 | 100 | 99.17±0.65 | = | |
| JSEMO | 53.96 | 100 | 99.43±0.62 | = | |
| MASA-PSO | 42.99 | 100 | 99.62±0.54 | ||
| DLBCL | SFE | 52.17 | 93.12 | 89.92±2.72 | + |
| VLPSO | 73.46 | 93.33 | 86.51±3.52 | + | |
| ESAPSO | 53.67 | 99.17 | 92.37±3.09 | + | |
| CWGAN-GP | 128 | 95.12 | 92.93±2.17 | + | |
| JSEMO | 38.24 | 99.57 | 93.72±3.98 | + | |
| MASA-PSO | 56.13 | 100 | 94.45±3.73 | ||
| 9 Tumors | SFE | 71.10 | 53.97 | 49.26±3.20 | + |
| VLPSO | 44.20 | 61.67 | 55.11±4.71 | + | |
| ESAPSO CWGAN-GP | 82.90 128 | 61.67 | 55.28±4.97 55.16±4.09 | + + | |
| 1671.4 | 63.50 | 55.04±5.38 | |||
| JSEMO | 58.35 | + | |||
| MASA-PSO | 78.16 | 63.40 | 56.50±4.61 | ||
| Leukemia1 | SFE | 132.20 | 94.32 | 87.04±3.81 | + |
| VLPSO | 54.70 | 97.92 | 93.31±2.34 | + | |
| ESAPSO | 50.30 | 98.75 | 96.15±1.87 | = | |
| CWGAN-GP | 128 | 97.89 | 95.86±1.69 | + | |
| JSEMO MASA-PSO | 218.27 47.90 | 98.40 99.17 | 95.61±1.91 96.59±1.79 | + | |
| Leukemia2 | SFE VLPSO | 129.33 35.20 | 90.12 94.44 | 89.63±0.42 91.56±1.84 | + + |
| ESAPSO | 86.53 | 96.67 | 94.35±1.23 | = | |
| CWGAN-GP | 128 | 96.99 | 93.12±1.92 | + | |
| JSEMO | 191.99 | 99.26 | 94.02±2.31 93.94±1.97 | = | |
| MASA-PSO | 73.40 110.43 | 98.02 80.83 | 76.17±2.13 | + | |
| Brain Tumor1 | SFE VLPSO | 26.80 | 79.17 | 71.19±3.52 | + |
| ESAPSO | 66.41 | 83.75 | 76.17±3.30 | + | |
| CWGAN-GP | 128 | 79.48 | 76.18±3.42 | + | |
| JSEMO | 102.13 | 81.13 | 76.36±3.62 | + | |
| MASA-PSO | 33.51 | 84.17 | 77.15±3.60 | ||
| Brain Tumor2 | SFE | 116.17 | 82.41 73.33 | 74.51±4.23 66.78±4.10 | = + |
| VLPSO ESAPSO | 81.5 106.45 | 80.00 | 74.21±3.94 | = | |
| CWGAN-GP | 128 | 77.08 | 73.51±2.36 | + | |
| JSEMO | 204.24 | 78.89 | 73.33±2.33 | + | |
| MASA-PSO | 80.95 | 79.62 | 74.27±3.60 | ||
| Prostate | 90.74 | 87.56±1.39 | + | ||
| SFE VLPSO | 106.40 26.40 | 94.17 | 89.82±2.28 91.85±1.67 | + | |
| ESAPSO | 48.17 128 | 94.33 | 91.69±1.65 | = | |
| CWGAN-GP | 94.17 | + | |||
| JSEMO MASA-PSO | 112.95 30.30 | 94.86 95.17 | 91.18±2.53 92.65±1.79 | + | |
| Lung Cancer | SFE | 140.25 | 89.07 | 84.69±2.77 | + |
| VLPSO | 176.10 100.35 | 94.08 94.44 | 89.47±2.18 90.11±2.18 | + + | |
| ESAPSO CWGAN-GP | 128 | 95.24 | 91.80±1.81 91.78±1.90 | + | |
| JSEMO | 131.41 73.75 | 94.51 | + | ||
| MASA-PSO | 95.75 | 92.95±1.96 | |||
| 11 Tumors | SFE | 95.67 | 90.10 | 84.09±2.26 | + |
| 85.16 | 80.81±2.32 | + + | |||
| VLPSO | 246.70 116.60 | 89.16 | 84.70±2.16 | ||
| ESAPSO | 128 | 88.50 | 84.01±2.70 | + | |
| CWGAN-GP JSEMO | 126.20 | 88.57 | 84.48±2.93 | + | |
| MASA-PSO | 104.74 | 89.98 | 85.70±2.29 |
(2) Compared with SFE and JSEMO, MASA-PSO not only achieves superior classification accuracy on most datasets but also captures fewer features than these methods. For instance, on Leukemia1, MASA-PSO collects approximately 80 fewer features than SFE, while on 9 Tumors, it reduces the features by nearly 1,500 compared with JSEMO. These results indicate that the variable-length mechanism enables MASA-PSO to identify more compact feature subsets while maintaining or improving performance. (3) Compared with VLPSO and ESAPSO, MASA-PSO consistently achieves higher classification accuracy on most datasets (e.g., more than 2.18% increase on DLBCL, over 2.84% increase on Lung Cancer). Even on datasets where comparable accuracy is obtained, MASA-PSO selects significantly fewer features than these VLEAs, demonstrating its effectiveness in addressing the limitations of existing VLEAs. (A detailed comparison of optimization efficiency with VLEAs is in Supplementary E).
Overall, MASA-PSO demonstrates superior search capability over baseline methods, rapidly identifying better candidate solutions and finding more promising and smaller search space, thereby improving classification accuracy and capturing smaller feature subset. Meanwhile, it ensures the interpretability of the selected features for subsequent biological significance research.
4.3 Ablation Study
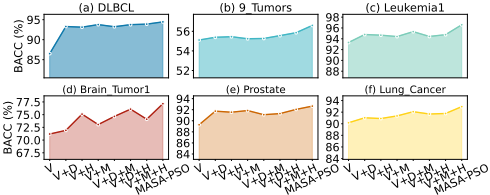
Experiments have verified that MASA-PSO outperforms the compared methods in classification accuracy, feature subset size and convergence speed. To further assess its effectiveness, ablation studies are conducted by adding or removing components. Figure.2 present the ablation results on six representative gene datasets (Results on more datasets are in the Supplementary of Figure.F4), where "D","M", and "H" denote the adaptive division, the mulitiscale framework and the hybrid elite mechanism, respectively. "+" means the inclusion of corresponding components. VLPSO is adopted as the basic algorithm, denoted as "V".
As Figure.2 shown, the introduction of D leads to varying degrees of BACC improvement. Combining the mechanism with other modules results in better BACC than when tested in isolation. For effect of M, it demonstrates the significant improvements for those applying the framework on most datasets, particularly on high-dimensional datasets (Prostate, and Lung Cancer). It indicates that M effectively adapts to dynamic search spaces, improving BACC and capturing smaller feature set. As for H, Figure.2 reveals significant BACC improvements across all datasets with the strategy, especially on DLBCL and Brain Tumor1, with increases of 7% and 4%.
4.4 Analysis of Selected Features
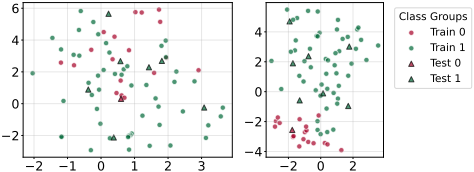
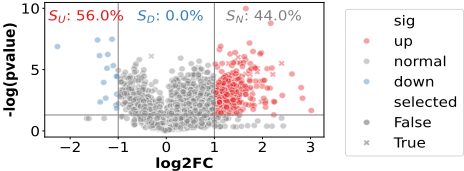
MASA-PSO is further examined through visualization and theoretical analysis. Figure.3 shows the distribution of selected features on DLBCL via t-SNE [Hinton and Roweis, 2002]. It shows that MASA-PSO successfully turns highdimensional features into a compact subset, enhancing between-class separability. Figure.4 reveals that more than 75% of features selected by MASA-PSO are in the significant region, with few representation from non-significant regions. It demonstrates the algorithm's capability to effectively identify biologically relevant differentially expressed features, rather than merely optimizing classification performance. (More analysis are in Supplementary G)
5 Conclusions
In this study, we propose a novel size-adaptive PSO algorithm for HDLSS gene expression analysis (MASA-PSO). a multiscale adaptive discrimination framework, an adaptive division mechanism, and a hybrid elite strategy are designed to enhance classification performance, improve search efficiency, and mitigate particle degradations. Experiments on ten gene expression datasets show MASA-PSO outperforms SOTA methods. Moreover, the selected feature subsets exhibit statistical and biological significance, facilitating the subsequent research and diagnosis. Future work will explore combining multiscale discrimination and variablelength mechanisms with deep learning models to advance bioinformatics and medical research.
Acknowledgments
This work was supported by the National Natural Science Foundation of China under Grant nos. 62576154 and
62102002.
@inproceedings{ijcai2026p744,
  title     = {Multiscale-adaptive and Size-adaptive PSO-based Feature Selection for Gene Expression Analysis},
  author    = {Deng, Weihao and Zhao, Lingyun and Han, Fei},
  booktitle = {Proceedings of the Thirty-Fifth International Joint Conference on
               Artificial Intelligence, {IJCAI-26}},
  publisher = {International Joint Conferences on Artificial Intelligence Organization},
  editor    = {Diego Calvanese},
  pages     = {6689--6697},
  year      = {2026},
  month     = {8},
  note      = {AI and Health},
  doi       = {10.24963/ijcai.2026/744},
  url       = {https://doi.org/10.24963/ijcai.2026/744},
}
TY - CPAPER TI - Multiscale-adaptive and Size-adaptive PSO-based Feature Selection for Gene Expression Analysis AU - Deng, Weihao AU - Zhao, Lingyun AU - Han, Fei T2 - Proceedings of the Thirty-Fifth International Joint Conference on Artificial Intelligence, IJCAI-26 PB - International Joint Conferences on Artificial Intelligence Organization PY - 2026 SP - 6689 EP - 6697 DO - 10.24963/ijcai.2026/744 UR - https://doi.org/10.24963/ijcai.2026/744 ER -Copied
Machine-readable versions of this paper, for tools and AI agents:





