
Prior Knowledge-enhanced Spatio-temporal Epidemic Forecasting
Proceedings of the Thirty-Fifth International Joint Conference on Artificial Intelligence. AI and Health. Pages 6868-6876.
https://doi.org/10.24963/ijcai.2026/764
Keywords
- Public health: Public health
- Timeseries prediction: Timeseries prediction
Abstract
Spatio-temporal epidemic forecasting is critical for public health management, yet existing methods often struggle with insensitivity to weak epidemic signals, over-simplified spatial relations, and unstable parameter estimation. To address these challenges, we propose the Spatio-Temporal priOr-aware Epidemic Predictor (STOEP), a novel hybrid framework that integrates implicit spatio-temporal priors and explicit expert priors. STOEP consists of three key components: (1) Case-aware Adjacency Learning (CAL), which dynamically adjusts mobility-based regional dependencies using historical infection patterns; (2) Space-informed Parameter Estimating (SPE), which employs learnable spatial priors to amplify weak epidemic signals; and (3) Filter-based Mechanistic Forecasting (FMF), which uses an expert-guided adaptive thresholding strategy to regularize epidemic parameters. Extensive experiments on real-world COVID-19 and influenza datasets demonstrate that STOEP outperforms the best baseline by 11.1% in RMSE. The system has been deployed at a provincial CDC in China to facilitate downstream applications.
- [Arora et al., 2020] Parul Arora, Himanshu Kumar, and Bi- jaya Ketan Panigrahi. Prediction and analysis of covid- 19 positive cases using deep learning models: A descrip- tive case study of india. Chaos, solitons & fractals, 139:110017, 2020.
- [Bai et al., 2020] Lei Bai, Lina Yao, Can Li, Xianzhi Wang, and Can Wang. Adaptive graph convolutional recurrent network for traffic forecasting. Advances in neural infor- mation processing systems, 33:17804-17815, 2020.
- [Cao et al., 2022] Qi Cao, Renhe Jiang, Chuang Yang, Zipei Fan, Xuan Song, and Ryosuke Shibasaki. Mepognn: Metapopulation epidemic forecasting with graph neural networks. In Joint European Conference on Machine Learning and Knowledge Discovery in Databases, pages 453-468, 2022.
- [Deng et al., 2020] Songgaojun Deng, Shusen Wang, Huzefa Rangwala, Lijing Wang, and Yue Ning. Cola-gnn: Cross- location attention based graph neural networks for long- term ili prediction. In Proceedings of the 29th ACM inter- national conference on information & knowledge manage- ment, pages 245-254, 2020.
- [Fujita and Akutsu, 2025] Satoki Fujita and Tatsuya Akutsu. Enhancing epidemic forecasting with a physics- informed spatial identity neural network. PLoS One, 20(9):e0331611, 2025.
- [Gao et al., 2021] Junyi Gao, Rakshith Sharma, Cheng Qian, Lucas M Glass, Jeffrey Spaeder, Justin Romberg, Jimeng Sun, and Cao Xiao. Stan: spatio-temporal attention net- work for pandemic prediction using real-world evidence. Journal of the American Medical Informatics Association, 28(4):733-743, 2021.
- [Gao et al., 2022] Junyi Gao, Cao Xiao, Lucas M Glass, and Jimeng Sun. Popnet: Real-time population-level disease prediction with data latency. In Proceedings of the ACM Web Conference 2022, pages 2552-2562, 2022.
- [Han et al., 2025] Shuai Han, Lukas Stelz, Thomas R Sokolowski, Kai Zhou, and Horst Stöcker. Epidemiology- informed spatiotemporal graph neural network for heterogeneity-driven interpretable epidemic forecast- ing. Engineering Applications of Artificial Intelligence, 162:112764, 2025.
- [Hu et al., 2025] Yifan Hu, Peiyuan Liu, Peng Zhu, Dawei Cheng, and Tao Dai. Adaptive multi-scale decomposition framework for time series forecasting. In Proceedings of the AAAI Conference on Artificial Intelligence, 2025.
- [Huang et al., 2025] Songtao Huang, Zhen Zhao, Can Li, and LEI BAI. TimeKAN: KAN-based frequency decom- position learning architecture for long-term time series forecasting. In The Thirteenth International Conference on Learning Representations, 2025.
- [Kapoor et al., 2020] Amol Kapoor, Xue Ben, Luyang Liu, Bryan Perozzi, Matt Barnes, Martin Blais, and Shawn O'Banion. Examining covid-19 forecasting using spatio- temporal graph neural networks. 2020.
- [Kermack and McKendrick, 1927] William Ogilvy Kermack and Anderson G McKendrick. A contribution to the math- ematical theory of epidemics. Proceedings of the royal society of london. Series A, Containing papers of a mathe- matical and physical character, 115(772):700-721, 1927.
- [Kufel, 2020] Tadeusz Kufel. Arima-based forecasting of the dynamics of confirmed covid-19 cases for selected euro- pean countries. Equilibrium. Quarterly Journal of Eco- nomics and Economic Policy, 15(2):181-204, 2020.
- [Li et al., 2018] Yaguang Li, Rose Yu, Cyrus Shahabi, and Yan Liu. Diffusion convolutional recurrent neural net- work: Data-driven traffic forecasting. In International Conference on Learning Representations, 2018.
- [Long et al., 2024] Qingqing Long, Zheng Fang, Chen Fang, Chong Chen, Pengfei Wang, and Yuanchun Zhou. Unveil- ing delay effects in traffic forecasting: a perspective from spatial-temporal delay differential equations. In Proceed- ings of the ACM Web Conference 2024, pages 1035-1044, 2024.
- [Mao et al., 2024] Junkai Mao, Yuexing Han, and Bing Wang. Mpstan: Metapopulation-based spatio-temporal attention network for epidemic forecasting. Entropy, 26(4):278, 2024.
- [Paparrizos and Gravano, 2015] John Paparrizos and Luis Gravano. k-shape: Efficient and accurate clustering of time series. In Proceedings of the 2015 ACM SIGMOD international conference on management of data, pages 1855-1870, 2015.
- [Perrotta et al., 2017] Daniela Perrotta, Michele Tizzoni, and Daniela Paolotti. Using participatory web-based surveil- lance data to improve seasonal influenza forecasting in italy. In Proceedings of the 26th International Conference on World Wide Web, pages 303-310, 2017.
- [Qian et al., 2021] Zhaozhi Qian, Ahmed M Alaa, and Mi- haela van der Schaar. Cpas: the uk's national ma- chine learning-based hospital capacity planning system for covid-19. Machine Learning, 110(1):15-35, 2021.
- [Qiu et al., 2025] Xiangfei Qiu, Xingjian Wu, Yan Lin, Chenjuan Guo, Jilin Hu, and Bin Yang. Duet: Dual clus- tering enhanced multivariate time series forecasting. In SIGKDD, pages 1185-1196, 2025.
- [Rizoiu et al., 2018] Marian-Andrei Rizoiu, Swapnil Mishra, Quyu Kong, Mark Carman, and Lexing Xie. Sir- hawkes: Linking epidemic models and hawkes processes to model diffusions in finite populations. In Proceedings of the 2018 world wide web conference, pages 419-428, 2018.
- [Shen et al., 2023] Tong Shen, Yang Li, and José MF Moura. Forecasting covid-19 dynamics: Clustering, generalized spatiotemporal attention, and impacts of mobility and geo- graphic proximity. In 2023 IEEE 39th International Con- ference on Data Engineering (ICDE), pages 2892-2904. IEEE, 2023.
- [Tang et al., 2023] Yinzhou Tang, Huandong Wang, and Yong Li. Enhancing spatial spread prediction of infectious diseases through integrating multi-scale human mobility dynamics. In Proceedings of the 31st ACM International Conference on Advances in Geographic Information Sys- tems, pages 1-12, 2023.
- [Wang et al., 2018] Jingyuan Wang, Xiaojian Wang, and Junjie Wu. Inferring metapopulation propagation network for intra-city epidemic control and prevention. In Proceed- ings of the 24th ACM SIGKDD International Conference on Knowledge Discovery & Data Mining, pages 830-838. ACM, 2018.
- [Wang et al., 2022] Lijing Wang, Aniruddha Adiga, Jiangzhuo Chen, Adam Sadilek, Srinivasan Venkatra- manan, and Madhav Marathe. Causalgnn: Causal-based graph neural networks for spatio-temporal epidemic forecasting. In Proceedings of the AAAI conference on artificial intelligence, volume 36, pages 12191-12199, 2022.
- [Wang et al., 2024] Yiheng Wang, Guanjie Zheng, Hexi Jin, Yi Sun, Kan Wu, and Jie Fang. Precise control balances epidemic mitigation and economic growth. npj Urban Sus- tainability, 4(1):28, 2024.
- [Wang et al., 2025] Yihang Wang, Yuying Qiu, Peng Chen, Yang Shu, Zhongwen Rao, Lujia Pan, Bin Yang, and Chenjuan Guo. Lightgts: A lightweight general time series forecasting model. In Forty-second International Confer- ence on Machine Learning, 2025.
- [Wang et al., 2026] Yi Wang, Zhenghong Wang, Fan Zhang, Chaogui Kang, Sijie Ruan, Di Zhu, Chengling Tang, Zhongfu Ma, Weiyu Zhang, Yu Zheng, Philip S. Yu, and Yu Liu. A gravity-informed spatiotemporal transformer for human activity intensity prediction. IEEE Trans- actions on Pattern Analysis and Machine Intelligence, 48(3):2380-2397, 2026.
- [Wu et al., 2019] Zonghan Wu, Shirui Pan, Guodong Long, Jing Jiang, and Chengqi Zhang. Graph wavenet for deep spatial-temporal graph modeling. In Proceedings of the 28th International Joint Conference on Artificial Intelli- gence, pages 1907-1913, 2019. IJCAI
- [Wu et al., 2020] Zonghan Wu, Shirui Pan, Guodong Long, Jing Jiang, Xiaojun Chang, and Chengqi Zhang. Con- necting the dots: Multivariate time series forecasting with graph neural networks. In Proceedings of the 26th ACM SIGKDD international conference on knowledge discov- ery & data mining, pages 753-763, 2020.
- [Yu et al., 2018] Bing Yu, Haoteng Yin, and Zhanxing Zhu. Spatio-temporal graph convolutional networks: A deep learning framework for traffic forecasting. In Proceed- ings of the Twenty-Seventh International Joint Conference on Artificial Intelligence, pages 3634-3640. International Joint Conferences on Artificial Intelligence Organization, 2018. IJCAI
- [Zhang et al., 2026] Xukai Zhang, Shuliang Wang, Guangyin Jin, Ziqiang Yuan, Hanning Yuan, and Si- jie Ruan. Eulerian neural network informed by chemical transport for air quality forecasting. Advances in Neural Information Processing Systems, 38:33576-33601, 2026.
- [Zou et al., 2026] Yiqing Zou, Hanning Yuan, Qianyu Yang, Ziqiang Yuan, Shuliang Wang, and Sijie Ruan. Meta dynamic graph for traffic flow prediction. Proceed- ings of the AAAI Conference on Artificial Intelligence, 40(19):16584-16592, Mar. 2026.
References were extracted automatically from the PDF and may contain errors.
Full text extracted automatically from the PDF; figures, tables and equations may differ. The PDF is the version of record.
1 Introduction
Population-level epidemic forecasting is of great importance to public health management, since accurate forecasting of new infections at each location can help governments and healthcare providers allocate resources, design intervention policies, and evaluate the effectiveness of control measures [Qian et al., 2021].
In the early years, constrained by data scarcity, epidemic forecasting primarily relied on mechanistic models, e.g., SIR [Kermack and McKendrick, 1927]. With the rise of deep learning, data-driven approaches have been increasingly adopted in this field [Arora et al., 2020]. Simultaneously, realizing the spatial dependencies of disease transmission among regions, spatio-temporal forecasting across multiple regions jointly has garnered great attention [Deng et al., 2020].
* Xiaoxiao Wang and Hanning Yuan are corresponding authors.
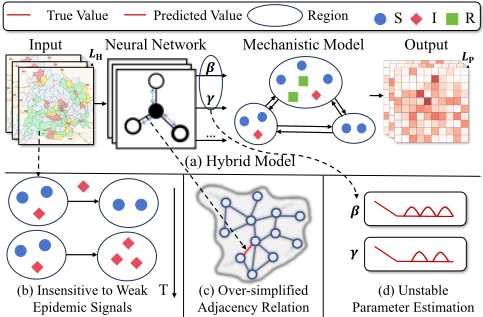
However, due to the limited epidemiological data, these models remain prone to overfitting. In recent years, there has been a surge focused on hybrid models that integrate mechanistic principles with deep learning [Cao et al., 2022; Wang et al., 2022; Han et al., 2025], e.g., employing deep neural networks to estimate the parameters of mechanistic models as shown in Figure 1(a). Nevertheless, existing methods still encounter three primary limitations:
- Insensitivity to Weak Epidemic Signals. Unlike traffic forecasting, epidemic data often contain weak signals as shown in Figure 1(b). That is, the confirmed cases in most of the time are small, but infectious diseases can surge to high prevalence levels in a short time. Existing deeplearning modules [Wu et al., 2019] are often insensitive to such weak yet critical signals, leading to missed early warnings.
- Over-simplified Adjacency Relation. Existing methods capture the spatial dependency by using the human mobil-
ity intensities among regions [Wang et al., 2018; Cao et al., 2022]. Though the vital factor, i.e., human mobility for disease transmission, is considered, they omit the intrinsic similarities among regions as shown in Figure 1(c).
- Unstable Parameter Estimation. As mentioned, hybrid models rely on neural networks to produce vital epidemic parameters. However, unconstrained network outputs often fluctuate violently in data-scarce scenarios as shown in Figure 1(d), resulting in mechanically implausible and unstable parameter estimation.
An intuitive idea to tackle those issues is to incorporate the external epidemic knowledge to regulate the modeling process. However, related data may not always be available. To this end, in this paper, we propose Spatio-Temporal priOraware Epidemic Predictor (STOEP), which incorporates two types of implicit knowledge without the requirements of external data, i.e., spatio-temporal priors and expert priors, to facilitate the epidemic modeling. The spatio-temporal priors are derived from data to enhance the representation of each region even if the signals are weak, and adjust the adjacency relation among regions in addition to the mobility data, while the expert priors are obtained from domain experts to regularize the output of estimated epidemic parameters to stabilize the epidemic forecasting. More specifically, STOEP is composed of three modules: (1) Case-aware Adjacency Learning (CAL), which dynamically fuses mobility data with patterns of confirmed cases by a learnable pattern memory to capture temporal epidemic priors dynamically; (2) Space-informed Parameter Estimating (SPE), which introduces a specialized spatial enhancement block with learnable spatial priors to explicitly amplify signals; (3) Filter-based Mechanistic Forecasting (FMF), which employs an adaptive thresholding strategy guided by expert priors to suppress noise in data-scarce regions. The main contributions are summarized as follows:
- We inject spatio-temporal priors into the epidemic forecasting model, which makes the adjacency relation aware of temporal patterns via CAL, and makes model inputs enhanced by spatial knowledge via SPE.
- We propose an expert prior-guided adaptive thresholding strategy via FMF to stabilize the epidemic forecasting by regularizing the output of estimated epidemic parameters.
- Extensive experiments on two real-world epidemic datasets, i.e., COVID-19 and influenza, demonstrate that STOEP outperforms the best baseline by 11.1% on average in RMSE. We also released the code for public use 1 .
- A system based on STOEP is deployed and used at a provincial CDC in China to facilitate downstream applications.
2 Preliminaries
2.1 Definitions
Definition 1 (Daily Confirmed Cases). We denote the number of daily confirmed cases in region n at day τ as xτn , and the number of daily confirmed cases over all regions as Xτ ∈ RN , where N is the number of regions.
1 https://github.com/stdi-lab/STOEP
Definition 2 (Historical Observations). To make the epidemic forecasting model work effectively, we divide historical observations into two types, i.e., essential factors and optional factors. The essential factors include historical daily confirmed cases Xt-(Tin-1):t , susceptible population St-(Tin-1):t ∈ RN×Tin , infected population It-(Tin-1):t ∈ RN×Tin and recovered population Rt-(Tin-1):t ∈ RN×Tin , where Tin is the given lookback time window. Other related features can also be incorporated as optional factors, e.g., day of week. We denote historical observations as Ot-(Tin-1):t ∈ RN×Tin×C , where C ≥ 4 is the number of factors considered.
Definition 3 (Historical Mobility Data). We use historical mobility data M t-(Tin-1):t ∈ RN×N×Tin to characterize the mobility intensity among different regions, where entry mτij ≥ 0 denotes the flow intensity from region i to region j at time τ ∈ {t - (Tin - 1), . . . , t}.
2.2 Problem Statement
Given the historical observations Ot-(Tin-1):t ∈ RN×Tin×C and mobility data M t-(Tin-1):t ∈ RN×N×Tin , predict the daily confirmed cases in the future Tout timesteps, i.e., ˆXt+1:t+Tout ∈ RN×Tout , which can be formulated as:
3 Methodology
STOEP follows the paradigm of hybrid spatio-temporal epidemic forecasting, which essentially leverages a mechanistic model to forecast future confirmed cases, but the epidemic parameters of the model are estimated by neural networks. The architecture of STOEP is depicted in Figure 2, which consists of three modules:
- Case-aware Adjacency Learning (CAL), which takes historical mobility data as well as daily confirmed cases, and produces a case-aware adjacency matrix. It would be used to indicate the adjacency intensities.
- Space-informed Parameter Estimating (SPE), which takes historical observations, learned spatial priors and case-aware adjacency matrix, to estimate the epidemic parameters of the mechanistic model.
- Filter-based Mechanistic Forecasting (FMF), which takes estimated epidemic parameters as well as the human mobility data, predicts the future daily confirmed cases via a filter-based mechanistic model.
The complexity and scalability of STOEP is practical for real-world use. Next, we elaborate on each module in detail.
3.1 Case-aware Adjacency Learning
Case-aware adjacency learning (CAL) aims to learn the caseaware adjacency intensities among different regions A ∈ RN×N based on the historical mobility data M t-(Tin-1):t and daily confirmed cases Xt-(Tin-1):t .
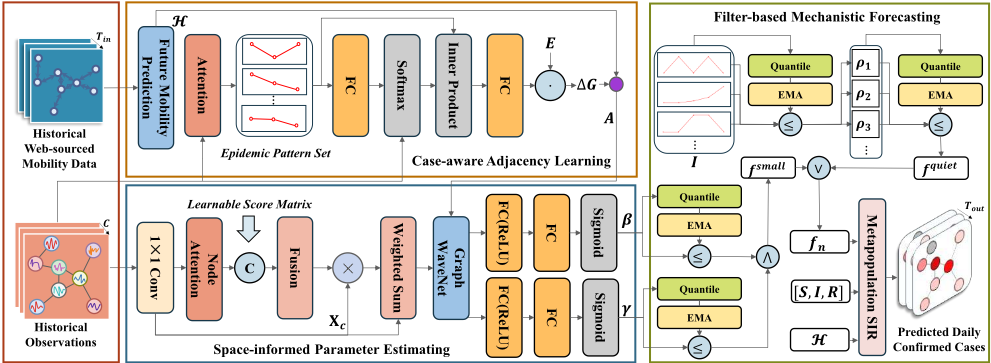
Main Idea. As mentioned, to adequately model the adjacency relation among regions, we fuse the mobility-based intensities with data-derived intensities. The main idea is to adjust the mobility-based intensities using data-derived adjacency relationship, which are detailed as follows.
Mobility-based Adjacency Learning. We first perform a linear transformation from past to future onM to obtain the future mobility prediction Ht+1:t+Tout ∈ RN×N×Tout . And the mobility-based adjacency matrix Am ∈ RN×N can be derived by mean-pooling over the prediction horizons:
Case-aware Adjacency Adjustment. For each region, its recent observation of confirmed cases may contain some noise. To quantify its correlation with other regions based on the recently observed cases, we first perform a soft clustering to obtain its robust representation, and then use the representation to calculate the intensity with other regions.
More specifically, for a historical daily confirmed case of region n, i.e., xt-(Tin-1):t n , we take its most recent S days (S ≤ Tin) to form a recent observation xt-(S-1):t n . xt-(S-1):t n would be normalized to eliminate the effect of population disparity to form an epidemic pattern ˜xt-(S-1):t n . Then the robust representation rn ∈ RdA of the current epidemic pattern of region n can be derived by attention-based pattern retrieval from a learnable pattern set P ∈ RP×S :
where αn are the attention weights of region n over P patterns, K ∈ Rd and V ∈ Rd are transformed key and value matrices of P. After that, rn would be compared with vectors in a learnable region embedding table E ∈ RN×dA to obtain its recent correlation with other regions. Formally, the case-based adjacency intensity ∆Gnm of region n to region m is:
where em ∈ RdA is entry m of E, ⟨·, ·⟩ denotes the inner product. α is a learnable scalar that scales the correction strength, which is initialized as 0 to prevent training perturbations. Finally, the case-based adjacency ∆G ∈ RN×N serves as a residual term to adjust the mobility-based adjacency Am to obtain the final adjacency matrix A:
3.2 Space-informed Parameter Estimating
Space-informed parameter estimating (SPE) aims to learn epidemic parameters of the mechanistic model. In this work, we leverage MetaSIR [Wang et al., 2018] as the mechanistic model, since it can jointly model multiple regions. In the context of MetaSIR, STOEP needs to estimate the infection rate β ∈ RN×Tout and recovery rate γ ∈ RN×Tout of different regions in future time steps.
Main Idea. To amplify the weak signals in epidemic data, we aim to explicitly learn some stable spatial dependency, which would be fused with dynamic dependency derived from historical observations, to comprehensively enhance the input features. After that, the enhanced features are fed into GraphWaveNet [Wu et al., 2019] to estimate β and γ, which are detailed as follows.
Dynamic Dependency Generation. We first transform the historical observations Ot-(Tin-1):t to a hidden representation Xc ∈ RN×Tin×Cc by a 1 × 1 convolution. We compute the inter-region dynamic dependency attention map Anode ∈ RN×N by applying multi-head self-attention to Xc for every input step, and averaging the scores over time and heads:
where H is the number of heads.
Spatial Prior Incorporation. To capture stable and longrange spatial dependency, we introduce a learnable score matrix S ∈ RN×N that encodes a global spatial prior. S is initialized as an identity matrix and optimized during the training. We apply a row-wise softmax on S to obtain a static dependency attention map Astruct = softmaxrow(S).
We use a gating mechanism to fuse the dynamic dependency and the static dependency to obtain a fused attention map Afuse ∈ RN×N as follows:
where [·; ·] is the concatenation, ϕ(·) is a linear layer to produce a gate Γ ∈ RN×N , σ(·) is sigmoid activation, and ⊙ is Hadamard product. After that, we regularize Afuse by symmetrizing, enforcing nonnegativity, and row-normalizing to obtain a refined attention map Afuse norm ∈ RN×N .
Feature Enhancement. Based on Afuse norm , we enhance the features Xc in a residual connection manner:
where ˜Ot-(Tin-1):t ∈ RN×Tin×Cc is the feature enhanced input, and ϵ ∈ [0, 1] is a learnable scalar (initialized as 0). Parameter Estimation. After node features are enhanced, we feed ˜Ot-(Tin-1):t as well as the adjacency matrix A obtained in CAL into GraphWaveNet-style backbone [Wu et al., 2019] for spatio-temporal modeling to obtain the hidden representation Z ∈ RN×Tout×d :
Finally, two linear heads take the hidden representation and predict the epidemiological parameters β ∈ RN×Tout and γ ∈ RN×Tout for each node on future time steps:
3.3 Filter-basedMechanistic Forecasting
Filter-based mechanistic forecasting (FMF) aims to forecast future daily confirmed cases ˆXt+1:t+Tout based on the estimated epidemic parameters β and γ from SPE via a filterbased MetaSIR.
Main Idea. To mitigate the instability of epidemic parameter estimation, by discussing with the domain experts, we suppress the disease transmission process if estimated epidemic parameters or infected population are small. A straightforward idea is to set a constant threshold to suppress the epidemic parameters. However, due to the heterogeneity across space and time, we propose an adaptive thresholding strategy to flexibly decide whether the disease transmission process should be suppressed or not, which are detailed as follows.
Adaptive Thresholding Strategy. Adaptive thresholding strategy aims to learn an adaptive threshold given a set of numbers, e.g., {vr}Rr=1 . We first compute the quantile κ = Quantile ({vr}Rr=1 , κ), where κ is the desired quantile ratio. During the training, κ would be smoothed by Exponential Moving Average (EMA) to control the adaptivity-stability trade-off. The adaptive threshold is defined as
where δmin is a safeguard lower bound to avoid vanishing thresholds when the quantile becomes very small.
Small Parameter Detection. Small parameter detection aims to detect whether the estimated epidemic parameters βn ∈ RTout and γn ∈ RTout of a region n are sufficiently small. For each region n, we first obtain its maximum parameter estimates over the prediction horizon, i.e., βmax n and γmax n . We then apply the adaptive thresholding over the maximum parameter set of all regions, i.e., {βmax n }N and {γmax n }N with quantile κβ and κγ , to obtain adaptive thresholds βthr and γthr. A region with both small βmax n and γmax n would be detected:
Low Infection Detection. Low infection detection aims to detect whether the infected population of a region is sufficiently small. We first apply the adaptive thresholding on It-(Tin-1):t with quantile κI to obtain a global nearzero threshold Iabs. Then, for each region n, the proportion of near-zero infection days can be defined as ρn = 1 Tin ∑tτ=t-(Tin-1) I(I τn ≤ Iabs). We then apply the adaptive thresholding over {ρn}N with quantile κρ to obtain ̂κZR. To maintain suppression sensitivity, we cap the threshold by κmax ρ , i.e., ̂κZR ← min(̂κZR, κmax ρ ). A region with proportion of near-zero infection days larger than ̂κZR would be detected:
Suppressed Metapopulation SIR. The final suppression filter is defined as the union of two detection results, i.e., fn = f quiet n ∨ f small n . We apply the filter to adaptively suppress the disease transmission process by modifying the infection parameter βn in the MetaSIR model [Wang et al., 2018], which is achieved as follows:
where ψ ∈ (0, 1) is a small constant for downscaling. Based on the revised infection update equation, we can obtain the daily confirmed cases prediction according to MetaSIR [Wang et al., 2018]. During training, the model is optimized via Mean Absolute Error (MAE) loss.
4 Experiments
We evaluate the performance of the proposed method on two real-world epidemic datasets.
4.1 Datasets
To validate the applicability of the proposed model, we conducted evaluation on two types of epidemic datasets with unique characteristics, which are summarized as follows:
- COVID-19 Dataset. This dataset contains daily confirmed COVID-19 cases in 47 prefectures in Japan covering the period from April 1, 2020, to September 21, 2021 (539 days)
| Model | 3 d Ahead | 7 d Ahead | 14 d Ahead | Overall | ||||||||||||
|---|---|---|---|---|---|---|---|---|---|---|---|---|---|---|---|---|
| RMSE | MAE | SMAPE | RAE | RMSE | MAE | SMAPE | RAE | RMSE | MAE | SMAPE | RAE | RMSE | MAE | SMAPE | RAE | |
| SIR [1927] | 441.0 | 156.5 | 84.1 | 0.49 | 522.3 | 195.2 | 113.3 | 0.58 | 932.1 | 322.9 | 133.2 | 0.97 | 616.8 | 214.6 | 102.7 | 0.65 |
| MetaSIR [KDD18] | 346.8 | 128.4 | 72.7 | 0.39 | 412.4 | 167.8 | 94.8 | 0.51 | 795.4 | 283.2 | 129.7 | 0.84 | 517.4 | 184.3 | 110.4 | 0.54 |
| STGCN [IJCAI18] | 372.9 | 117.0 | 44.9 | 0.36 | 378.5 | 127.0 | 52.1 | 0.38 | 427.9 | 158.5 | 74.2 | 0.48 | 388.4 | 131.6 | 55.3 | 0.40 |
| MTGNN [KDD20] | 307.2 | 105.8 | 41.1 | 0.32 | 382.4 | 137.5 | 50.1 | 0.41 | 443.5 | 168.3 | 80.2 | 0.52 | 363.2 | 135.0 | 50.7 | 0.49 |
| CovidGNN [2020] | 288.4 | 96.8 | 45.1 | 0.29 | 339.1 | 127.9 | 63.4 | 0.38 | 443.3 | 185.0 | 114.4 | 0.55 | 358.2 | 133.4 | 68.4 | 0.40 |
| DCRNN [ICLR18] | 312.7 | 92.8 | 37.9 | 0.28 | 336.3 | 111.8 | 48.4 | 0.34 | 386.6 | 149.9 | 72.6 | 0.45 | 344.3 | 116.0 | 50.8 | 0.35 |
| PopNet [WWW22] | 330.4 | 128.1 | 57.6 | 0.39 | 331.9 | 130.6 | 56.8 | 0.39 | 398.3 | 157.7 | 67.2 | 0.48 | 341.3 | 133.0 | 58.5 | 0.40 |
| TimeKAN [ICLR25] | 327.4 | 124.8 | 55.8 | 0.38 | 330.8 | 129.4 | 58.5 | 0.39 | 329.8 | 130.0 | 61.7 | 0.39 | 329.1 | 127.8 | 57.6 | 0.39 |
| COVID-Forecaster [ICDE23] | 318.6 | 106.7 | 50.0 | 0.32 | 322.1 | 118.7 | 58.8 | 0.35 | 331.9 | 140.9 | 80.1 | 0.42 | 324.0 | 121.4 | 62.2 | 0.37 |
| GraphWaveNet [IJCAI19] | 234.2 | 76.5 | 47.3 | 0.22 | 315.1 | 105.5 | 57.7 | 0.32 | 308.4 | 148.1 | 76.6 | 0.44 | 315.1 | 105.5 | 57.7 | 0.32 |
| LightGTS [ICML25] | 254.7 | 88.4 | 39.1 | 0.27 | 284.0 | 104.9 | 48.0 | 0.31 | 379.8 | 149.3 | 72.1 | 0.45 | 306.2 | 111.0 | 50.4 | 0.33 |
| ColaGNN [CIKM20] | 242.0 | 76.3 | 40.2 | 0.23 | 337.4 | 119.9 | 43.9 | 0.37 | 376.1 | 147.5 | 69.9 | 0.43 | 294.2 | 106.4 | 50.2 | 0.33 |
| AMD [AAAI25] | 287.5 | 113.0 | 65.0 | 0.34 | 291.0 | 115.5 | 65.3 | 0.34 | 291.7 | 115.3 | 63.7 | 0.34 | 289.8 | 114.7 | 65.2 | 0.34 |
| STDDE [WWW24] | 277.5 | 105.2 | 51.9 | 0.32 | 277.0 | 107.2 | 51.6 | 0.32 | 276.9 | 108.2 | 53.1 | 0.33 | 277.1 | 107.0 | 52.1 | 0.32 |
| PDFormer [AAAI23] | 273.1 | 97.7 | 36.6 | 0.29 | 269.2 | 97.8 | 44.2 | 0.29 | 275.5 | 103.6 | 62.5 | 0.31 | 272.2 | 99.5 | 46.3 | 0.30 |
| DUET [KDD25] | 275.6 | 100.8 | 43.2 | 0.30 | 271.3 | 101.2 | 44.0 | 0.30 | 267.6 | 101.9 | 63.0 | 0.30 | 271.6 | 101.3 | 46.5 | 0.30 |
| AGCRN [NeurIPS20] | 209.1 | 76.1 | 49.9 | 0.23 | 234.0 | 94.1 | 55.7 | 0.28 | 336.9 | 143.2 | 81.5 | 0.43 | 253.5 | 103.0 | 60.0 | 0.31 |
| EISTGNN [EAAI25] | 352.5 | 132.6 | 61.3 | 0.40 | 350.7 | 135.2 | 62.2 | 0.40 | 416.0 | 159.6 | 68.7 | 0.48 | 369.3 | 141.0 | 63.7 | 0.42 |
| STAN [JAMIA21] | 330.6 | 127.8 | 57.0 | 0.39 | 365.4 | 143.9 | 62.8 | 0.43 | 398.9 | 158.6 | 70.1 | 0.48 | 348.4 | 136.8 | 60.3 | 0.41 |
| CausalGNN [AAAI22] | 308.8 | 104.4 | 39.6 | 0.32 | 313.6 | 116.8 | 46.4 | 0.35 | 331.9 | 149.2 | 67.1 | 0.45 | 317.1 | 121.4 | 49.9 | 0.37 |
| MPSTAN [Entropy24] | 302.1 | 127.0 | 51.4 | 0.38 | 316.8 | 137.5 | 54.3 | 0.41 | 331.9 | 147.4 | 60.6 | 0.44 | 316.1 | 136.7 | 54.9 | 0.41 |
| MepoGNN [ECML-PKDD22] | 139.2 | 54.9 | 37.6 | 0.17 | 177.5 | 72.8 | 45.5 | 0.22 | 250.6 | 103.8 | 61.1 | 0.31 | 188.5 | 75.5 | 47.1 | 0.23 |
| STOEP (Ours) | 125.3 | 49.8 | 35.9 | 0.15 | 149.3 | 63.1 | 43.1 | 0.19 | 230.1 | 97.9 | 61.6 | 0.29 | 169.1 | 68.8 | 45.4 | 0.21 |
from the NHK COVID-19 2 . Other related observations are from the Ministry of Health, Labour and Welfare, etc. The mobility data are from Facebook Movement Range Maps 3 . The entire dataset is publicly available 4 .
- Flu Dataset. This dataset contains daily confirmed flu cases in 11 cities of Zhejiang Province, China, during 2023-2024 (731 days). We can derive the daily susceptible/infected/recovered population from it in a way similar to that used for the COVID-19 dataset. The mobility data are from Baidu Migration Map 5 .
For each dataset, we partition it into non-overlapping training, validation, and test sets chronologically at a 6:1:1 ratio.
4.2 Experimental Settings
Baselines. We compare STOEP with the following baselines:
- Mechanistic Models: SIR [Kermack and McKendrick, 1927] and MetaSIR [Wang et al., 2018].
- Deep Learning Models: (1) Time-series Models: AMD [Hu et al., 2025], TimeKAN [Huang et al., 2025], DUET [Qiu et al., 2025], LightGTS [Wang et al., 2025]; (2) Spatio-temporal Graph Models: DCRNN [Li et al., 2018], STGCN [Yu et al., 2018], GraphWaveNet [Wu et al., 2019], ColaGNN [Deng et al., 2020], MTGNN [Wu et al., 2020], AGCRN [Bai et al., 2020], CovidGNN [Kapoor et al., 2020], PopNet [Gao et al., 2022], STDDE [Long et al., 2024].
2 https://www3.nhk.or.jp/news/special/coronavirus/data/
3 https://data.humdata.org/dataset/movement-range-maps
4 https://github.com/deepkashiwa20/MepoGNN
5 https://qianxi.baidu.com/
- Hybrid Models: STAN [Gao et al., 2021], MPSTAN [Mao et al., 2024], CausalGNN [Wang et al., 2022], MepoGNN [Cao et al., 2022], EISTGNN [Han et al., 2025].
Evaluation Methods. Following previous work [Tang et al., 2023; Cao et al., 2022], we evaluate the 3d, 7d, 14d, and overall prediction performance of our model by four metrics, i.e., Root Mean Squared Error (RMSE), Mean Absolute Error (MAE), Symmetric Mean Absolute Percentage Error (SMAPE), and Relative Absolute Error (RAE).
Implementation & Training Settings. We implement STOEP and baselines using PyTorch on an NVIDIA RTX 5060 GPU. The model is optimized via Adam with a curriculum learning strategy.
4.3 Overall Evaluation
Table 1 summarizes the results of different methods on the COVID-19 dataset against all baselines. STOEP consistently achieves the best performance across almost all horizons and metrics. On the overall results, it obtains 10.3% lower RMSE, 8.9% lower MAE, and 8.7% lower RAE than MepoGNN, highlighting a substantial improvement in both accuracy and robustness. The advantage is particularly evident on the 7day horizon, where STOEP achieves 15.9% lower RMSE and 13.3% lower MAE, demonstrating its superiority in mid-term forecasting.
Table 2 summarizes results on the Flu dataset. STOEP again delivers the best performance across all horizons and metrics. Compared with MepoGNN on the overall results, it achieves 11.8% lower RMSE, 9.0% lower MAE and 7.5% lower RAE. On the 7-day horizon, STOEP reduces RMSE and MAE by 10.6% and 7.5%, respectively, underscoring stable mid-term benefits in a real operational setting.
| Model | 3 d Ahead | 7 d Ahead | 14 d Ahead | Overall | ||||||||||||
|---|---|---|---|---|---|---|---|---|---|---|---|---|---|---|---|---|
| RMSE | MAE | SMAPE | RAE | RMSE | MAE | SMAPE | RAE | RMSE | MAE | SMAPE | RAE | RMSE | MAE | SMAPE | RAE | |
| SIR [1927] | 148.5 | 92.1 | 193.8 | 1.04 | 150.2 | 93.0 | 195.2 | 1.04 | 147.3 | 91.0 | 196.8 | 1.05 | 149.4 | 92.5 | 195.1 | 1.04 |
| MetaSIR [KDD18] | 88.4 | 56.5 | 64.2 | 0.64 | 124.6 | 80.3 | 80.3 | 0.90 | 199.4 | 125.9 | 100.4 | 1.46 | 137.3 | 83.9 | 79.9 | 0.95 |
| STGCN [IJCAI18] | 62.2 | 29.7 | 32.7 | 0.34 | 93.9 | 45.5 | 42.0 | 0.51 | 113.7 | 52.4 | 47.6 | 0.61 | 92.3 | 42.5 | 40.7 | 0.48 |
| MTGNN [KDD20] | 135.3 | 81.1 | 64.9 | 0.92 | 144.2 | 88.6 | 73.4 | 0.99 | 150.5 | 93.6 | 78.7 | 1.08 | 143.4 | 87.6 | 71.9 | 0.88 |
| CovidGNN [2020] | 152.3 | 136.5 | 113.4 | 1.54 | 157.5 | 142.2 | 115.5 | 1.60 | 167.0 | 152.3 | 119.6 | 1.76 | 157.3 | 141.9 | 115.7 | 1.60 |
| DCRNN [ICLR18] | 57.2 | 28.0 | 32.6 | 0.32 | 81.5 | 40.6 | 41.0 | 0.46 | 95.8 | 47.0 | 46.7 | 0.54 | 80.7 | 38.9 | 40.1 | 0.44 |
| PopNet [WWW22] | 122.9 | 78.6 | 95.7 | 0.89 | 124.0 | 78.8 | 95.3 | 0.88 | 121.1 | 76.6 | 95.1 | 0.89 | 123.3 | 78.4 | 95.4 | 0.89 |
| ColaGNN [CIKM20] | 125.2 | 110.5 | 109.4 | 1.25 | 127.2 | 112.9 | 110.2 | 1.27 | 129.4 | 116.7 | 112.1 | 1.35 | 126.7 | 112.1 | 110.0 | 1.27 |
| TimeKAN [ICLR25] | 117.9 | 83.8 | 98.9 | 0.95 | 122.6 | 77.3 | 118.6 | 0.87 | 121.3 | 84.4 | 99.3 | 0.98 | 126.9 | 86.6 | 113.2 | 0.98 |
| COVID-Forecaster [ICDE23] | 119.5 | 69.6 | 87.9 | 0.79 | 122.7 | 72.0 | 89.3 | 0.81 | 121.7 | 70.7 | 89.8 | 0.82 | 122.5 | 71.5 | 89.2 | 0.81 |
| GraphWaveNet [IJCAI19] | 56.8 | 27.7 | 32.4 | 0.31 | 80.3 | 39.5 | 40.2 | 0.44 | 94.1 | 45.9 | 46.0 | 0.53 | 79.1 | 37.7 | 39.3 | 0.43 |
| LightGTS [ICML25] | 94.5 | 53.7 | 71.9 | 0.61 | 95.8 | 54.5 | 72.6 | 0.61 | 93.4 | 53.0 | 72.2 | 0.61 | 95.1 | 54.1 | 72.4 | 0.61 |
| AMD [AAAI25] | 113.6 | 68.2 | 90.2 | 0.77 | 145.3 | 88.2 | 150.1 | 0.99 | 129.8 | 74.9 | 106.3 | 0.87 | 133.0 | 79.3 | 118.4 | 0.90 |
| STDDE [WWW24] | 93.8 | 54.8 | 67.3 | 0.62 | 96.8 | 57.4 | 70.5 | 0.64 | 96.0 | 57.3 | 72.2 | 0.66 | 96.2 | 56.9 | 69.8 | 0.64 |
| PDFormer [AAAI23] | 137.6 | 78.5 | 94.3 | 0.89 | 137.9 | 78.6 | 94.8 | 0.88 | 135.5 | 76.8 | 95.8 | 0.89 | 136.2 | 77.6 | 93.6 | 0.88 |
| DUET [KDD25] | 111.8 | 70.8 | 80.4 | 0.80 | 116.6 | 73.9 | 82.6 | 0.83 | 147.6 | 91.1 | 183.8 | 1.05 | 116.7 | 72.6 | 88.7 | 0.82 |
| AGCRN [NeurIPS20] | 139.9 | 81.1 | 101.4 | 0.92 | 141.0 | 81.5 | 102.2 | 0.91 | 137.7 | 79.1 | 102.2 | 0.92 | 140.2 | 81.1 | 102.0 | 0.92 |
| EISTGNN [EAAI25] | 88.8 | 54.4 | 68.8 | 0.61 | 94.5 | 57.9 | 74.3 | 0.65 | 95.0 | 58.9 | 77.0 | 0.68 | 94.1 | 57.4 | 73.3 | 0.65 |
| STAN [JAMIA21] | 149.9 | 93.3 | 184.0 | 1.05 | 151.0 | 93.7 | 183.6 | 1.05 | 147.5 | 91.0 | 183.0 | 1.05 | 150.2 | 93.2 | 183.7 | 1.05 |
| CausalGNN [AAAI22] | 121.5 | 78.3 | 96.8 | 0.88 | 124.0 | 78.7 | 96.2 | 0.88 | 121.6 | 76.6 | 95.5 | 0.89 | 123.1 | 78.3 | 96.1 | 0.88 |
| MPSTAN [Entropy24] | 74.3 | 43.1 | 61.0 | 0.49 | 83.5 | 47.3 | 63.8 | 0.53 | 88.7 | 49.3 | 66.3 | 0.57 | 82.6 | 46.7 | 63.5 | 0.53 |
| MepoGNN [ECML-PKDD22] | 54.1 | 26.4 | 32.0 | 0.30 | 72.9 | 37.2 | 40.9 | 0.42 | 84.0 | 43.2 | 46.7 | 0.50 | 72.0 | 35.6 | 39.8 | 0.40 |
| STOEP (Ours) | 51.9 | 24.8 | 31.6 | 0.28 | 65.2 | 34.4 | 39.8 | 0.39 | 70.5 | 37.8 | 45.3 | 0.44 | 63.5 | 32.4 | 38.8 | 0.37 |
The significance test confirms that STOEP's improvements are statistically significant, with a permutation p-value < 2 × 10⁻⁴ across all baselines.
4.4 Ablation Study
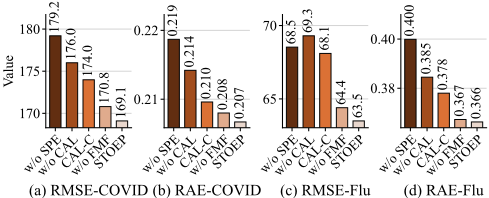
We conduct ablation experiments on both datasets to quantify the contribution of each component in STOEP by comparing the following variants: w/o SPE keeps the architecture of SPE module but routes its inputs through a 1×1 convolution whose output is directly fed into GraphWaveNet for parameter estimation. w/o CAL removes the case-based adjacency intensity. CAL-C uses k-shape clustering [Paparrizos and Gravano, 2015] within the CAL module to obtain temporal patterns instead of self-learned patterns. w/o FMF replaces the FMF module with a classic MetaSIR for forecasting.
As shown in Figure 3, SPE contributes most, and STOEP lowers RMSE by 5.6% and RAE by 5.5% on the COVID-19 dataset, while on the Flu dataset, it lowers RMSE by 7.3% and RAE by 8.4%, compared to w/o SPE. The CAL module significantly reduced the RMSE by 8.3% on the Flu dataset. While the CAL-C variant performed better than the w/o CAL variant, it was inferior to STOEP on both datasets. This suggests that the self-learned patterns are more effective than using clustering. After the disease transmission suppression in FMF is removed, i.e., w/o FMF, RMSE is increased by 1.4% on the Flu dataset, which also demonstrates its effectiveness in suppressing unstable parameter estimation.
4.5 Hyperparameter Sensitivity
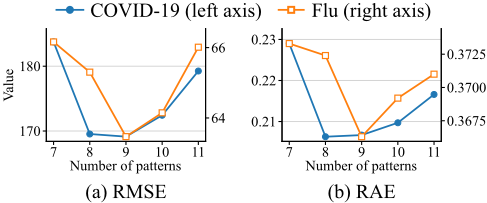
We further analyzed the sensitivity of the proposed model with respect to the number of learned patterns in the CAL module. Figure 4 reports the results for RMSE and RAE as the number of patterns varies from 7 to 11 on both the COVID-19 dataset and the Flu dataset. Overall, the performance is relatively stable across different settings, but performance is generally optimal at 9 patterns. These results suggest that a moderate number of patterns is sufficient to capture the temporal dynamics without introducing redundancy.
4.6 Case Study
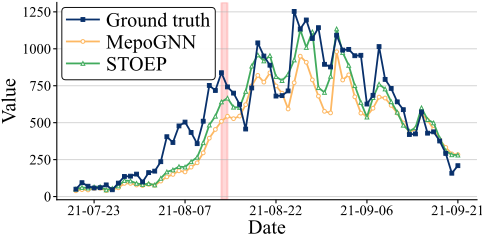
To further demonstrate the effectiveness of STOEP, we have conducted a case study on COVID-19 for STOEP and the most competitive forecasting model, i.e., MepoGNN. We visualize the prediction results (7d ahead) of STOEP and MepoGNN from July 18, 2021, to September 19, 2021, on COVID-19 dataset in Figure 5, where the blue line represents the ground-truth. It can be observed that our model is closer to the ground-truth than MepoGNN and more capable of capturing the occurrence of peaks. For instance, STOEP successfully predicted a peak around August 13-14, a period when Delta variant was prevalent in Japan and the epidemic was expanding rapidly 6 . This indicates that our model can reflect real-world scenarios more accurately than MepoGNN.
4.7 SystemDeployment
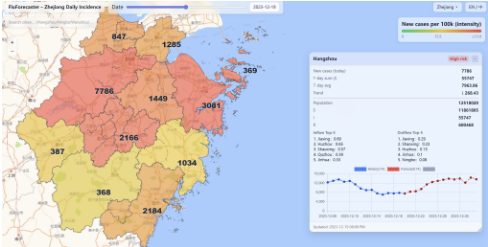
A system based on STOEP has already been deployed at Zhejiang CDC in China, providing daily influenza forecasts for 11 cities. As shown in Figure 6, the system utilizes our model to visualize real-time trends and risk levels. Public health practitioners can use the system to trigger the early warning of infectious diseases and precisely allocate medical resources among regions in advance.
6 https://japan.kantei.go.jp/99 suga/statement/202108/ 00009. html
5 RelatedWork
Epidemic forecasting can be mainly categorized into three types: mechanistic models, data-driven models, and hybrid models.
Mechanistic Models. Mechanistic models model the infecting dynamics across different groups of populations, i.e., compartments, using differential equations, e.g., SIR model [Kermack and McKendrick, 1927; Rizoiu et al., 2018], SEIR model [Wang et al., 2024]. Considering the spatial heterogeneity, MetaSIR [Wang et al., 2018] is further proposed to jointly forecast for several regions. However, they usually rely on experts' knowledge and strong assumptions on disease transmission, which limit their prediction capability.
Data-driven Models. Data-driven models can flexibly learn to forecast based on past observations, which are widely studied in epidemic forecasting and other domains, e.g., traffic forecasting. Auto-Regressive model [Perrotta et al., 2017], ARIMA [Kufel, 2020] are initially adopted. In the era of deep learning, Bi-LSTM [Arora et al., 2020] is commonly used. For spatio-temporal forecasting, the spatial dependency among different regions can be constructed based on region adjacency [Deng et al., 2020; Kapoor et al., 2020], mobility intensity [Gao et al., 2022], or self-attention [Shen et al., 2023; Zou et al., 2026]. Though data-driven models show superior performance, they learn parameters purely based on data, which limits their generalization capability.
Hybrid Models. Hybrid models combine the mechanistic models and powerful modeling ability of deep learning. STAN [Gao et al., 2021] and PISID [Fujita and Akutsu, 2025] regulate the network training loss with SIR constraints, while MPSTAN [Mao et al., 2024] adds the MetaSIR module into the recurrent cell. MepoGNN [Cao et al., 2022], CausalGNN [Wang et al., 2022] and EISTGNN [Han et al., 2025] estimate epidemic parameters of mechanistic models by neural networks. The hybrid idea is also used in other domains, for example, CTENet [Zhang et al., 2026] fuses the physical and chemical terms into the decoder for air quality forecasting, while GravityFormer [Wang et al., 2026] fuses the gravity model for human activity intensity prediction. Our proposed method also belongs to this category. However, different from previous work, we enhance the models with spatio-temporal priors via CAL and SPE, and expert priors via FMF.
6 Conclusion
In this paper, we propose STOEP, a spatio-temporal prioraware epidemic predictor, which enhances the hybrid model by prior knowledge. Spatio-temporal priors are injected into the adjacency learning and amplify the input signals, while expert priors guide the design of parameter adaptive thresholding. Experiments on COVID-19 and influenza datasets show that STOEP consistently outperforms the best baseline by 11.1% on average in RMSE. A system based on STOEP is also deployed at Zhejiang CDC in China for forecasting to facilitate downstream applications. Further investigation into the cross-regional and cross-disease transferability of the proposed model is warranted.
Acknowledgements
This work was supported by the National Key R&D Program of China (No. 2023YFC2308703), the National Natural Science Foundation of China (No. 62306033, 42371480).
@inproceedings{ijcai2026p764,
  title     = {Prior Knowledge-enhanced Spatio-temporal Epidemic Forecasting},
  author    = {Ruan, Sijie and Li, Jinyu and Wei, Jia and Xu, Zenghao and Bao, Jie and Xu, Junshi and Qiu, Junyang and Wang, Shuliang and Wang, Xiaoxiao and Yuan, Hanning},
  booktitle = {Proceedings of the Thirty-Fifth International Joint Conference on
               Artificial Intelligence, {IJCAI-26}},
  publisher = {International Joint Conferences on Artificial Intelligence Organization},
  editor    = {Diego Calvanese},
  pages     = {6868--6876},
  year      = {2026},
  month     = {8},
  note      = {AI and Health},
  doi       = {10.24963/ijcai.2026/764},
  url       = {https://doi.org/10.24963/ijcai.2026/764},
}
TY - CPAPER TI - Prior Knowledge-enhanced Spatio-temporal Epidemic Forecasting AU - Ruan, Sijie AU - Li, Jinyu AU - Wei, Jia AU - Xu, Zenghao AU - Bao, Jie AU - Xu, Junshi AU - Qiu, Junyang AU - Wang, Shuliang AU - Wang, Xiaoxiao AU - Yuan, Hanning T2 - Proceedings of the Thirty-Fifth International Joint Conference on Artificial Intelligence, IJCAI-26 PB - International Joint Conferences on Artificial Intelligence Organization PY - 2026 SP - 6868 EP - 6876 DO - 10.24963/ijcai.2026/764 UR - https://doi.org/10.24963/ijcai.2026/764 ER -Copied
Machine-readable versions of this paper, for tools and AI agents:





