
PROB-EMOE: A Probabilistic Ensemble Mixture-of-Experts Framework for Metro Network Expansion Forecasting
Proceedings of the Thirty-Fifth International Joint Conference on Artificial Intelligence. AI and Social Good. Pages 7120-7128.
https://doi.org/10.24963/ijcai.2026/792
Keywords
- Uncertainty in AI: Uncertainty in AI
- Multidisciplinary Topics and Applications: Multidisciplinary Topics and Applications
- Data Mining: Data Mining
Abstract
Forecasting Origin-Destination (OD) demand for new metro lines is critical for sustainable infrastructure planning but faces spatiotemporal out-of-distribution challenges. Existing models often struggle to capture heterogeneous interaction patterns in changing topologies and overlook inherent uncertainty and over-dispersion issues. To bridge these gaps, we propose PROB-EMOE, a planning-oriented probabilistic framework tailored for network expansion. To ensure robust generalization, we design a Mixture-of-Experts (MoE) predictor that integrates diverse expert views to capture heterogeneous demand patterns across changing topologies. To quantify extrapolation uncertainty, our framework functions as a unified probabilistic system by synergizing Deep Ensembles with a probabilistic output, effectively quantifying both data and model uncertainty. Through a systematic investigation of likelihood families, we empirically demonstrate that the Negative Binomial distribution offers the optimal fit in this context. Extensive experiments on a multi-year Shenzhen metro dataset demonstrate that our approach achieves state-of-the-art predictive performance and provides the sharpest calibrated uncertainty intervals. The framework has been deployed in a metropolitan smart-data platform to support risk-aware investment decisions.
- [Baera et al., 2025] Eivind Jamholt Baera, Linda Alfheim, Glenn Lyons, and Charlene Rohr. Using scenarios to address uncertainty in planning for sustainable mobility in small and medium-sized norwegian cities. European Transport Research Review, 17(1):18, 2025.
- [Ding et al., 2024] Fangyi Ding, Yuebing Liang, Yamin Wang, Yan Tang, Yang Zhou, and Zhan Zhao. A graph deep learning model for station ridership prediction in expanding metro networks. In Proceedings of the 2nd ACM SIGSPATIAL International Workshop on Advances in Urban-AI, pages 6-14, 2024.
- [Ding et al., 2025] Fangyi Ding, Yan Tang, Yamin Wang, and Zhan Zhao. Unraveling the network effects in station ridership growth patterns under metro network expansion. Journal of Transport Geography, 125:104205, 2025.
- [Ding et al., 2026] Fangyi Ding, Zhan Zhao, Yamin Wang, Min Namgung, JangHyeon Lee, and Tianhao Li. Origin- destination flow generation for metro network expan- sion using spatiotemporal gated graph neural networks. Transportation Research Part C: Emerging Technologies, 188:105677, 2026.
- [Gal and Ghahramani, 2016] Yarin Gal and Zoubin Ghahra- mani. Dropout as a bayesian approximation: Representing model uncertainty in deep learning. In international con- ference on machine learning, pages 1050-1059. PMLR, 2016.
- [Gal, 2016] Yarin Gal. Uncertainty in deep learning. phd thesis, University of Cambridge, 2016.
- [Gawlikowski et al., 2023] Jakob Gawlikowski, Cedrique Rovile Njieutcheu Tassi, Mohsin Ali, Jongseok Lee, Matthias Humt, Jianxiang Feng, Anna Kruspe, Rudolph Triebel, Peter Jung, Ribana Roscher, et al. A survey of un- certainty in deep neural networks. Artificial Intelligence Review, 56(Suppl 1):1513-1589, 2023.
- [Ghasri et al., 2017] Milad Ghasri, Taha Hossein Rashidi, and S Travis Waller. Developing a disaggregate travel demand system of models using data mining techniques. Transportation Research Part A: Policy and Practice, 105:138-153, 2017.
- [Guo et al., 2017] Huifeng Guo, Ruiming Tang, Yunming Ye, Zhenguo Li, and Xiuqiang He. Deepfm: a factorization-machine based neural network for ctr predic- tion. arXiv preprint arXiv:1703.04247, 2017. IJCAI
- [Guo et al., 2019] Shengnan Guo, Youfang Lin, Ning Feng, Chao Song, and Huaiyu Wan. Attention based spatial- temporal graph convolutional networks for traffic flow forecasting. In Proceedings of the AAAI conference on artificial intelligence, volume 33, pages 922-929, 2019.
- [Han et al., 2019] Yong Han, Shukang Wang, Yibin Ren, Cheng Wang, Peng Gao, and Ge Chen. Predicting station- level short-term passenger flow in a citywide metro net- work using spatiotemporal graph convolutional neural net- works. ISPRS International Journal of Geo-Information, 8(6):243, 2019.
- [Hao et al., 2019] Siyu Hao, Der-Horng Lee, and De Zhao. Sequence to sequence learning with attention mechanism for short-term passenger flow prediction in large-scale metro system. Transportation Research Part C: Emerging Technologies, 107:287-300, 2019.
- [Huang et al., 2023] Hao Huang, Jiannan Mao, Weike Lu, Guojing Hu, and Lan Liu. Deaseq2seq: An attention based sequence to sequence model for short-term metro passen- ger flow prediction within decomposition-ensemble strat- egy. Transportation Research Part C: Emerging Technolo- gies, 146:103965, 2023.
- [Jiang et al., 2023] Xinke Jiang, Dingyi Zhuang, Xianghui Zhang, Hao Chen, Jiayuan Luo, and Xiaowei Gao. Uncer- tainty quantification via spatial-temporal tweedie model for zero-inflated and long-tail travel demand prediction. In Proceedings of the 32nd ACM International Conference on Information and Knowledge Management, pages 3983- 3987, 2023.
- [Jordan and Jacobs, 1994] Michael I Jordan and Robert A Jacobs. Hierarchical mixtures of experts and the em al- gorithm. Neural computation, 6(2):181-214, 1994.
- [Ke et al., 2021] Jintao Ke, Xiaoran Qin, Hai Yang, Zhengfei Zheng, Zheng Zhu, and Jieping Ye. Predicting origin- destination ride-sourcing demand with a spatio-temporal encoder-decoder residual multi-graph convolutional net- work. Transportation Research Part C: Emerging Tech- nologies, 122:102858, 2021.
- [Kendall and Gal, 2017] Alex Kendall and Yarin Gal. What uncertainties do we need in bayesian deep learning for computer vision? Advances in neural information pro- cessing systems, 30, 2017.
- [Kim and Susilo, 2013] Nam Seok Kim and Yusak O Susilo. Comparison of pedestrian trip generation models. Journal of Advanced Transportation, 47(4):399-412, 2013.
- [Lakshminarayanan et al., 2017] Balaji Lakshminarayanan, Alexander Pritzel, and Charles Blundell. Simple and scal- able predictive uncertainty estimation using deep ensem- bles. Advances in neural information processing systems, 30, 2017.
- [Liang et al., 2024] Yuebing Liang, Zhan Zhao, and Chris Webster. Generating sparse origin-destination flows on shared mobility networks using probabilistic graph neu- ral networks. Sustainable Cities and Society, 114:105777, 2024.
- [Liu et al., 2020] Zhicheng Liu, Fabio Miranda, Weiting Xiong, Junyan Yang, Qiao Wang, and Claudio Silva. Learning geo-contextual embeddings for commuting flow prediction. In Proceedings of the AAAI conference on ar- tificial intelligence, volume 34, pages 808-816, 2020.
- [Middela and Ramadurai, 2021] Mounisai Siddartha Mid- dela and Gitakrishnan Ramadurai. Incorporating spatial interactions in zero-inflated negative binomial models for freight trip generation. Transportation, 48(5):2335-2356, 2021.
- [Noursalehi et al., 2021] Peyman Noursalehi, Haris N Kout- sopoulos, and Jinhua Zhao. Dynamic origin-destination prediction in urban rail systems: A multi-resolution spatio- temporal deep learning approach. IEEE transactions on in- telligent transportation systems, 23(6):5106-5115, 2021.
- [Pourebrahim et al., 2019] Nastaran Pourebrahim, Selima Sultana, Amirreza Niakanlahiji, and Jean-Claude Thill. Trip distribution modeling with twitter data. Computers, Environment and Urban Systems, 77:101354, 2019.
- [Qian et al., 2023] Weizhu Qian, Dalin Zhang, Yan Zhao, Kai Zheng, and James JQ Yu. Uncertainty quantifica- tion for traffic forecasting: A unified approach. In 2023 IEEE 39th International Conference on Data Engineering (ICDE), pages 992-1004. IEEE, 2023.
- [Rasouli and Timmermans, 2012] Soora Rasouli and Harry Timmermans. Uncertainty in travel demand forecasting models: literature review and research agenda. Trans- portation letters, 4(1):55-73, 2012.
- [Robinson and Dilkina, 2018] Caleb Robinson and Bistra Dilkina. A machine learning approach to modeling human migration. In Proceedings of the 1st ACM SIGCAS Confer- ence on Computing and Sustainable Societies, pages 1-8, 2018.
- [Simini et al., 2012] Filippo Simini, Marta C González, Amos Maritan, and Albert-László Barabási. A univer- sal model for mobility and migration patterns. Nature, 484(7392):96-100, 2012.
- [Simini et al., 2021] Filippo Simini, Gianni Barlacchi, Mas- similano Luca, and Luca Pappalardo. A deep gravity model for mobility flows generation. Nature communica- tions, 12(1):6576, 2021.
- [Stouffer, 1940] Samuel A Stouffer. Intervening opportuni- ties: a theory relating mobility and distance. American sociological review, 5(6):845-867, 1940.
- [Wang et al., 2022] Kaipeng Wang, Pu Wang, Zhiren Huang, Ximan Ling, Fan Zhang, and Anthony Chen. A two-step model for predicting travel demand in expanding subways. IEEE Transactions on Intelligent Transportation Systems, 23(10):19534-19543, 2022.
- [Wang et al., 2024] Qingyi Wang, Shenhao Wang, Dingyi Zhuang, Haris Koutsopoulos, and Jinhua Zhao. Uncer- tainty quantification of spatiotemporal travel demand with probabilistic graph neural networks. IEEE Transactions on Intelligent Transportation Systems, 25(8):8770-8781, 2024.
- [Yao et al., 2020] Xin Yao, Yong Gao, Di Zhu, Ed Man- ley, Jiaoe Wang, and Yu Liu. Spatial origin-destination flow imputation using graph convolutional networks. IEEE Transactions on Intelligent Transportation Systems, 22(12):7474-7484, 2020.
- [Yu et al., 2025] Dahai Yu, Dingyi Zhuang, Lin Jiang, Rongchao Xu, Xinyue Ye, Yuheng Bu, Shenhao Wang, and Guang Wang. Uqgnn: Uncertainty quantification of graph neural networks for multivariate spatiotemporal pre- diction. In Proceedings of the 33rd ACM International Conference on Advances in Geographic Information Sys- tems, pages 52-65, 2025.
- [Zhuang et al., 2020] Dingyi Zhuang, Siyu Hao, Der-Horng Lee, and Jian Gang Jin. From compound word to metropolitan station: Semantic similarity analysis using smart card data. Transportation Research Part C: Emerg- ing Technologies, 114:322-337, 2020.
- [Zhuang et al., 2022] Dingyi Zhuang, Shenhao Wang, Haris Koutsopoulos, and Jinhua Zhao. Uncertainty quantifi- cation of sparse travel demand prediction with spatial- temporal graph neural networks. In Proceedings of the 28th ACM SIGKDD Conference on Knowledge Discovery and Data Mining, pages 4639-4647, 2022.
- [Zipf, 1946] George Kingsley Zipf. The p 1 p 2/d hypothesis: on the intercity movement of persons. American sociolog- ical review, 11(6):677-686, 1946.
References were extracted automatically from the PDF and may contain errors.
Full text extracted automatically from the PDF; figures, tables and equations may differ. The PDF is the version of record.
1 Introduction
Metro systems are the backbone of sustainable smart cities, offering benefits such as reduced congestion and carbon emissions [Huang et al., 2023]. Yet, given the high cost of expansion, planning errors are financially devastating, particularly for developing cities with limited fiscal capacity [Ding et al., 2025]. Overestimating demand can lead to underutilized assets and wasted resources, while underestimating demand may cause persistent overcrowding and increase safety risks. City planner therefore need reliable tools to evaluate induced origin-destination (OD) flows before construction, thereby supporting accurate investment decisions.
∗Corresponding author.
1 Implementation details and source code are at this link.
In this work, we study new-OD demand forecasting under metro network expansion. Unlike traditional spatiotemporal prediction which forecasts future states of existing nodes and edges, our goal is to estimate the demand distribution for newly formed OD pairs resulting from topological changes. Formally, given the urban built environment features and the updated network structure after a candidate expansion, the model must infer the latent demand for new OD connections that do not yet observable in the existing network.
Forecasting for network expansion presents a unique dual challenge of being both out-of-space and out-of-time. First, new lines often connect previously weakly interacting regions, so the built environment and functional context of new OD pairs can deviate substantially from OD pairs observed in the operational network. This induces a spatial distribution shift, creating OD feature combinations that are inherently out-of-distribution (spatial OOD). Second, newly formed OD pairs lack historical ridership data, eliminating the key temporal supervision signal leveraged by mainstream predictors and yielding an out-of-time setting (temporal OOD). While sequence models such as LSTM variants [Hao et al., 2019; Huang et al., 2023] and spatiotemporal graph neural networks such as STGCN [Han et al., 2019] and ASTGCN [Guo et al., 2019] have achieved strong performance on conventional demand forecasting, they typically assume a stable topology and rely on temporal dependence in past flows. In the context of expansion, these assumptions are violated, meaning these established methods cannot be directly applied.
Uncertainty quantification [Gal, 2016] is also essential for high-stakes infrastructure planning. Demand for new metro lines is influenced by complex and stochastic factors such as land-use development and multi-modal transit competitive dynamics [Ding et al., 2024]. Consequently, relying solely on point estimates is inadequate: two expansion plans with similar expected means may carry vastly different downside risks. To address this, planning-oriented predictors must model the full conditional distribution of demand, thereby enabling risksensitive investment decisions.
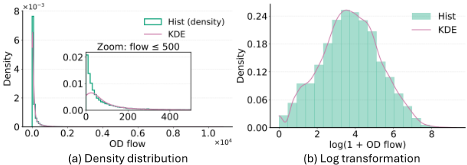
Despite growing interest in uncertainty quantification for general predictive modeling [Zhuang et al., 2022; Liang et al., 2024; Wang et al., 2024], its application to metro expansion remains underexplored. First, OD demand is often assumed to follow Gaussian distributions [Zhuang et al., 2020; Ke et al., 2021]. However, real-world metro flows frequently exhibit long tails and a large mass of low values (Figure 1), suggesting that Gaussian likelihoods may be mis-specified. Few studies have systematically examined which probabilistic assumptions are appropriate for metro demand prediction. Second, existing work predominantly emphasizes aleatoric (data) uncertainty [Zhuang et al., 2022; Liang et al., 2024]. However, given the spatial and temporal OOD nature of expansion forecasting, epistemic (model) uncertainty is non-negligible: models can be overconfident when extrapolating beyond the training distribution. This motivates approaches that explicitly quantify data and model uncertainty in a unified framework tailored to metro expansion.
To bridge this gap, we propose PROB-EMOE, a unified PROBabilistic framework that synergizes deep Ensembles with a Mixture-Of-Experts (MoE) architecture. It moves beyond Gaussian assumptions to model over-dispersed flows and explicitly quantifies uncertainty in spatiotemporal OOD extrapolation, offering a robust tool for risk-sensitive planning. The main contributions are:
- Unified Probabilistic Framework: We design a predictor tailored to the OOD challenges of network expansion. By integrating a multi-view MoE with deep ensembles, our model captures heterogeneous OD interactions while distinguishing epistemic uncertainty from aleatoric noise.
- Systematic Uncertainty Analysis: We conduct the first systematic study on likelihood assumptions for expansion planning. We demonstrate that Negative Binomial likelihoods outperform alternatives in handling sparse, overdispersed flows, and validate the critical role of epistemic uncertainty in mitigating extrapolation overconfidence.
- SOTA Performance & Deployment: Validated on a comprehensive multi-year dataset from Shenzhen, PROBEMOE achieves state-of-the-art performance and generalization capability. Furthermore, the framework is deployed in a metropolitan smart-data platform to support risk-aware infrastructure planning.
2 Methodology
2.1 Task Definition
Planning-oriented prediction is distinct from traditional forecasting. It relies solely on urban context features and planned network topology, without access to historical flow lags.
Specifically, we aim to estimate the ridership demand yod ∈ R≥0 for a future target period, where o or d are newly constructed stations absent from the training period (i.e., spatial cold-start).
Formally, let D = {(xn, yn)}Nn=1 denote the dataset with N samples. For a directed OD pair (o, d), the input feature vector xod = [xo, xd, xint od ], where xo and xd represent station-specific attributes (e.g., land use, demographics) for the origin and destination respectively, and xint od denotes pairwise interaction features derived from the planned network structure (e.g., network distance). Our goal is to learn a probabilistic mapping FΘ : x ↦→ η that outputs the distributional parameters η of a conditional distribution p(y|x; η), maximizing the likelihood of observing the true demands on unseen future network configurations.
2.2 The PROB-EMOE Framework
As shown in Figure 2, the framework functions as an ensemble of independent MoE predictors to quantify both aleatoric and epistemic uncertainty. At the individual model level, the predictor integrates three complementary experts: (i) a twotower feature expert for station attributes, (ii) a bilinear interaction expert for OD coupling, and (iii) a dual-graph aggregation expert for spatial spillovers. A gating mechanism fuses these representations to output distributional parameters, thereby capturing aleatoric uncertainty. At the system level, we train an ensemble of such probabilistic predictors with diverse initializations. The disagreement among these members quantifies the epistemic uncertainty inherent in OOD extrapolation.
2.3 Mixture-of-Experts Predictor
We now specify the predictive mapping FΘ : x ↦→ η, which estimates the distributional parameters given the input features. Our design is motivated by three mainstream paradigms for OD modeling: feature-driven prediction [Simini et al., 2021], explicit O-D interaction modeling [Yao et al., 2020; Liu et al., 2020], and graph-based pairwise neighborhood aggregation to capture spatial spillovers [Zhuang et al., 2022; Liang et al., 2024]. To unify these complementary demand mechanisms in a single predictor, we adopt a MoE architecture [Jordan and Jacobs, 1994] with three experts: (i) a two-tower feature expert, (ii) a bilinear interaction expert, and (iii) a dual-graph aggregation expert.
OD input decomposition. For each OD pair (i, j) at time t, the input feature vector is decomposed as xij,t = [xoi,t , xdj,t , xod ij,t ], where xoi,t and xdj,t denote origin and destination station features, and xod ij,t denotes OD interaction features (e.g., distance and impedance-related attributes).
Expert 1: two-tower feature expert. We encode origin and destination attributes using two separate towers:
followed by linear projections to a shared embedding space. The resulting base representation concatenates the learned O/D embeddings with OD interaction features:
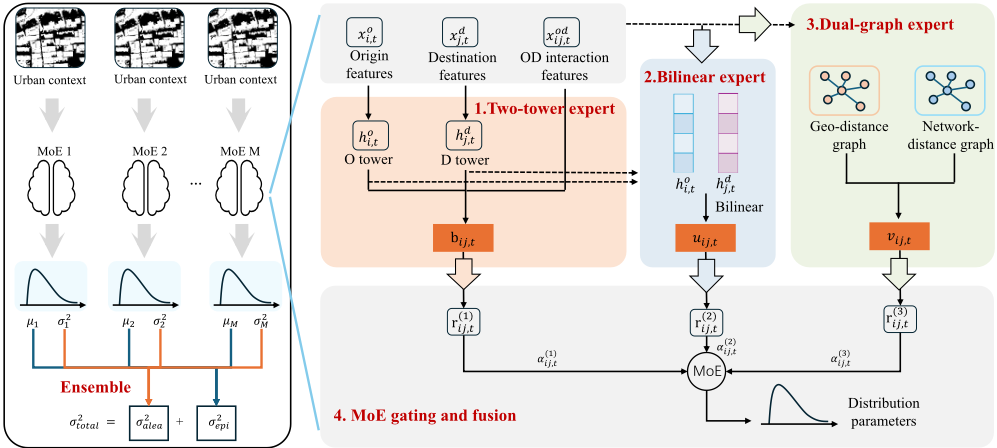
This expert provides a strong general-purpose signal driven by station attributes and engineered OD covariates.
Expert 2: bilinear interaction expert. To capture structured origin-destination interactions, we employ a bilinear interaction layer:
which outputs a vector-valued interaction representation. This expert captures compatibility patterns that may not be well represented by concatenation alone.
Expert 3: dual-graph neighborhood aggregation expert. Demand for an OD pair may depend on nearby OD pairs due to spatial spillovers and network coupling. We therefore construct OD-pair neighborhoods under two proximity graphs: a geo-distance graph and a network-distance graph. In both graphs, each vertex corresponds to an OD pair (i, j), and OD pairs with similar origins and/or destinations are considered proximal in the OD-pair space [Ke et al., 2021; Zhuang et al., 2022].
Adjacency construction. Following [Liang et al., 2024], we first define station-level adjacency using a chosen station metric M(·, ·), where M(i, i′ ) ∈ {dgeo ii′ , dnet ii′} denotes either geographic distance or network shortest-path distance between stations. The origin- and destination-level adjacency are
where σM is the standard deviation of the metric values. We then define the proximity between two OD pairs (i, j) and (i′ , j ′ ) as
For each OD pair, we retain the top-k neighbors according to aMij,i′ j ′ to form a localized graph. We construct two such graphs, specifically by settingM= dgeo andM= dnet .
Neighborhood aggregation. Let N geo ij,t andN net ij,t denote the neighbor sets of OD pair (i, j) at time t under the geo- and network-distance graphs, respectively. Using mean aggregation, the neighborhood contexts are
We concatenate the two contexts and map them to a compact embedding:
which serves as the dual-graph context representation for OD pair (i, j).
MoE gating and fusion. Each expert output is first projected to a shared MoE space:
where W1,W2,W3 are trainable matrices.
A gating network then produces OD-specific mixture weights from the concatenated expert features, and fuses them as follows:
which satisfies α(k) ij,t ≥ 0 and ∑3k=1 α(k) ij,t = 1, with Wg being a trainable matrix.
Finally, we concatenate the fused representation with the base feature representation and predict the distribution parameters:
where ffusion(·) is an MLP and Head(·) outputs the likelihood parameters.
2.4 Aleatoric Uncertainty Quantification
To capture aleatoric uncertainty, we model the target demand y as a random variable drawn from the conditional distribution p(y|x; η) defined in Section 2.1.
Likelihood families. Given the non-negative and longtailed, and sparse nature of metro flows, we select LogNormal (LN) and Negative Binomial (NB) as base likelihoods. To explicitly model structural zeros, we further introduce a zero-inflation component governed by a mixing parameter π ∈ (0, 1). The resulting Zero-Inflated (ZI) variants model the demand as a mixture: with probability π, the value is exactly 0; with probability 1 - π, it is drawn from the base distribution (yielding ZILN and ZINB). For each model, the support and distribution parameters η are shown in Table 1.
Training objective. Model parameters Θ are learned by minimizing the negative log-likelihood (NLL):
This likelihood-based training naturally supports heteroscedastic noise, since the predicted distributional spread depends on x.
Uncertainty Quantification. At inference time, we quantify aleatoric uncertainty using the closed-form conditional variance of the target random variable Y :
which provides a unified risk measure across likelihood assumptions. Closed-form expressions for σ2 alea (x) under LN, NB, ZILN, and ZINB are reported in Table 1.
2.5 Epistemic Uncertainty Quantification
While aleatoric uncertainty captures noise inherent in the data, epistemic uncertainty accounts for the lack of knowledge in the model parameters Θ, which can be reduced with more data. To quantify epistemic uncertainty, we adopt the Deep Ensembles framework, which approximates parameter uncertainty through a set of independently trained predictors and has been shown to provide strong empirical uncertainty estimates in deep learning [Lakshminarayanan et al., 2017].
| Model | Support | η | σ2 alea = Var[Y | x] |
|---|---|---|---|
| LN | y > 0 | {µ, σ} | ( exp(σ2 ) - 1) exp(2µ + σ2 ) |
| NB | y ∈ Z≥0 | {µ, θ} | µ + µ2 /θ |
| ZILN | y ≥ 0 | {π, µ, σ} | (1 -π)VarLN +π(1 -π)E2LN |
| ZINB | y ∈ Z≥0 | {π, µ, θ} | (1 -π)VarNB +π(1 -π)µ2 |
Ensemble Formulation We train an ensemble of M independent models, parameterized by {Θ(m) }Mm=1 . Each model is trained on the same dataset D but randomly initialized with different seeds. Due to the non-convex nature of the loss landscape in deep learning, different initializations allow the models to converge to diverse local optima, thereby approximating the posterior distribution p(Θ|D).
Ensemble predictive distribution. For an input x, the predictive distribution is represented as a uniformly weighted mixture of the ensemble members:
Let η(m) (x) denote the distribution parameters predicted by the m-th member. The member-wise predictive mean and variance are then given by
where both µ(m) (x) and v(m) (x) admit closed forms.
Total predictive variance. The total predictive uncertainty under the mixture distribution p∗(y | x) can be expressed in an additive form using the law of total variance. Specifically, the total predictive variance decomposes into an expected within-model variance (aleatoric) plus a between-model variance of predictive means (epistemic):
where ¯µ(x) is the ensemble mean prediction computed as 1M ∑Mm=1 µ(m) (x). σ2 alea (x) captures the data noise implied by the likelihood model through each member's predictive variance, while σ2 epi (x) captures parameter uncertainty through disagreement among ensemble means.
3 Experiments
3.1 Experimental Setup
Research Questions. We conduct a series of experiments to validate the efficacy of PROB-EMOE. Specifically, we aim to answer the following research questions (RQs):
- RQ1: Which probabilistic assumption is most suitable for modeling expanded metro OD flows?
- RQ2: How does PROB-EMOE compare with existing OD modeling baselines in predictive performance and uncertainty quality?
- RQ3: How does each component of PROB-EMOE contribute to the overall performance?
- RQ4: Can PROB-EMOE generalize to longer-horizon, post-pandemic demand forecasting?
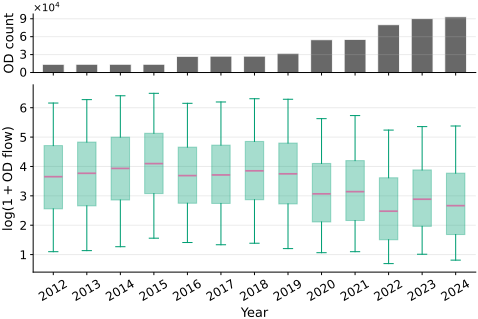
Dataset Description. We use a 13-year real-world OD flow dataset from Shenzhen, China (2012-2024) spanning multiple metro expansion stages with increased OD pairs (Figure 3). OD flows are provided as annual-average daily values, and each OD pair in each year is treated as one sample. We evaluate under two data splits: (i) D2019: train/valid on 2012-2018 and test on 2019 (137,394 train/valid; 5,190 test samples from newly formed OD pairs), and (ii) D2024: train/valid on 2012-2019 and test on 2024 (169,974 train/valid; 60,750 test samples from newly formed OD pairs). Training years are split into train/valid at 80/20. We exclude 2020-2023 to avoid COVID-19 confounding, and train all models for up to 100 epochs with early stopping.
Evaluation. We evaluate point accuracy using Root Mean Square Error (RMSE), Mean Absolute Error (MAE), and Common Part of Commuters (CPC) based on the predictive mean ˆ yn. CPC measures the structural similarity between observed and predicted flows:
For probabilistic forecast quality, interval-based metrics are used. Specifically, for a nominal (1 - α) prediction interval [ ˆ y L n , ˆ y U n ] constructed from the predictive distribution:
where I(·) is the indicator function. PICP (prediction interval coverage probability) measures calibration, i.e., how often the ground truth falls within the nominal interval, while MPIW (mean prediction interval width) measures sharpness, with smaller values indicating tighter uncertainty intervals at comparable coverage.
To obtain prediction intervals under non-Gaussian ensemble mixtures, we draw Monte Carlo samples from each ensemble member's predictive distribution, pool samples across members, and take empirical quantiles as ˆ y L n and ˆ y U n .
3.2 Likelihood Selection (RQ1)
To answer RQ1, we evaluate four likelihood families on the proposed predictor PROB-EMOE. We keep the entire architecture fixed and only replace the output likelihood head. Unless otherwise stated, we report results on D2019. Table 2 reports the performance. To rigorous compare predictive sharpness, we note that raw MPIW values are only comparable when models achieve similar coverage (PICP). Therefore, we introduce a calibrated MPIW c by apply post-hoc scaling to align prediction intervals with the nominal coverage. This thus enables a fair assessment of interval width under a unified calibration standard.
Overall, NB provides the most consistent and favorable results. It achieves the lowest RMSE and MAE, while maintaining PICP coverage closest to the nominal level (95% for α = 0.05) with the tightest MPIW. This suggests that new OD flows are better characterized by an over-dispersed discrete distribution, where the variance can exceed the mean, than by a continuous LogNormal assumption. Although ZI variants are designed to model excess zeros, they do not improve performance here and tend to produce wider intervals and worse point errors, indicating that additional mixture complexity is unnecessary in our setting. Based on these results, we adopt NB as the default likelihood in subsequent experiments.
3.3 Model Comparison (RQ2)
We adopt representative interaction modeling baselines at different scopes and integrate them into our framework. For fair comparison, all models are implemented as ensembles and trained with the NB likelihood: (i) Pointwise (intra-pair) models predict demand from the concatenated OD features: Deep Gravity (DG) [Simini et al., 2021] is an MLP-based gravity-style predictor, while DeepFM [Guo et al., 2017] further captures explicit second-order feature interactions. (ii) Structured O-D interaction models explicitly parameterize origin-destination coupling, represented by SI-GCN [Yao et al., 2020]. (iii) Relational (inter-pair) models incorporate dependencies among OD pairs via neighborhood aggregation: STZINB [Zhuang et al., 2022] applies graph diffusion for spatiotemporal prediction; we adapt its diffusion structure denoted as SNB. ZINB-GNN [Liang et al., 2024] performs attention-based graph aggregation, which we adopt as NBGNN.
Table 3 presents the comparative results. The proposed framework achieves state-of-the-art performance across all deterministic and probabilistic metrics. We summarize the key observations as follows:
| Dist. | RMSE | MAE | CPC | MPIW | PICP | MPIW c |
|---|---|---|---|---|---|---|
| LN | 40.223 | 18.099 | 0.621 | 78.465 | 0.735 | 94.351 |
| NB | 37.972 | 17.958 | 0.621 | 71.396 | 0.902 | 80.432 |
| ZILN | 40.952 | 19.338 | 0.609 | 85.009 | 0.816 | 101.905 |
| ZINB | 41.481 | 19.528 | 0.611 | 82.936 | 0.899 | 93.718 |
| Model | RMSE | MAE | CPC | MPIW | PICP | MPIW c |
|---|---|---|---|---|---|---|
| PROB-EMOE | 37.972 | 17.958 | 0.621 | 71.396 | 0.902 | 80.432 |
| DG | 46.651 | 31.285 | 0.504 | 155.808 | 0.976 | 148.892 |
| DEEPFM | 45.560 | 24.737 | 0.538 | 99.102 | 0.844 | 117.058 |
| SI-GCN | 67.367 | 34.917 | 0.423 | 114.509 | 0.752 | 182.816 |
| NB-GNN | 50.078 | 21.628 | 0.586 | 85.910 | 0.857 | 100.824 |
| SNB | 46.772 | 21.795 | 0.583 | 82.091 | 0.851 | 96.850 |
- Overall Superiority: Our method significantly outperforms all baselines, reducing RMSE and MAE by approximately 18% and improving CPC by 6% compared to the second-best model, SNB. For uncertainty quantification, our model also achieves the sharpness intervals. This implies the effectiveness of integrating diverse expert views for planning-oriented prediction.
- Pointwise Modeling: While DG achieves a high coverage rate, it relies on trivially wide prediction intervals, indicating poor information gain. DeepFM improves point accuracy by capturing feature interactions but still lacks the spatial context required for tight uncertainty bounds.
- Relational Modeling: Graph-based methods NB-GNN and SNB generally yield higher CPC scores than pointwise models, indicating that aggregating neighborhood information helps recover flow patterns. However, their higher RMSE suggest that diffusion or attention mechanisms alone may be not sufficient to handle the overdispersion in sparse OD flows.
- Separate Spatial Modeling: SI-GCN exhibits the worst performance. This may indicate that the separate spatial encoding strategy is insufficient to capture the complex dependencies between OD flows, as it performs graph convolution on origin and destination stations independently before bilinear fusion.
3.4 Ablation Analysis (RQ3)
To quantify the contribution of the fusion design and neighborhood aggregation strategy in PROB-EMOE, we conduct four ablations by varying two switches in our implementation: the neighborhood aggregator and the expert fusion mode. Our original model uses mean neighborhood aggregation and MoE fusion. We compare against four variants: (i) CONCAT concatenates the three expert representations without adaptive weighting; (ii) SCALAR G uses global (input-independent) softmax weights to reweight experts; (iii) FEAT G applies a feature-wise gate to modulate the aggregation expert before concatenation; and (iv) MOE GAT replaces the mean operator with graph attention for neighbor aggregation while keeping the MoE fusion unchanged.
Table 4 shows that our original model achieves the best overall performance. Replacing the MoE fusion with alternatives generally decreases both point accuracy and uncertainty quality, demonstrating the benefit of sample-adaptive expert weighting for heterogeneous OD demand patterns. Among the non-MoE variants, the global scalar gate (SCALAR G)
| Variant | RMSE | MAE | CPC | MPIW | PICP | MPIW c |
|---|---|---|---|---|---|---|
| PROB-EMOE | 37.972 | 17.958 | 0.621 | 71.396 | 0.902 | 80.432 |
| MOE GAT | 50.766 | 23.280 | 0.588 | 96.464 | 0.851 | 113.006 |
| CONCAT | 42.770 | 20.758 | 0.597 | 80.861 | 0.862 | 92.159 |
| SCALAR G | 38.725 | 18.686 | 0.620 | 76.953 | 0.895 | 87.551 |
| FEAT G | 41.480 | 21.256 | 0.599 | 86.902 | 0.871 | 98.943 |
is the strongest substitute, whereas feature gating (FEAT G) and direct concatenation (CONCAT) underperform, suggesting that explicit (even if lightweight) reweighting is preferable to unweighted fusion. Replacing mean neighborhood aggregation with GAT (MOE GAT) further decreases accuracy and sharpness, indicating that mean aggregation is more robust than attention-based aggregation in our setting.
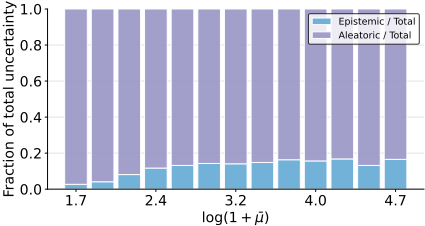
In addition, we analyze the uncertainty composition (Figure 4). The distribution suggests that epistemic uncertainty becomes more pronounced for high-demand OD pairs. This further underscores the importance of considering model uncertainty when forecasting newly formed OD flows.
3.5 Model Generalization (RQ4)
To assess robustness against temporal shifts and huge network expansion, we evaluate on the D2024 dataset. This scenario presents a significant challenge due to distinct flow redistributions caused by post-pandemic urban reshaping and the introduction of numerous newly built stations.
Table 5 summarizes the results. Despite the increased task difficulty, our method maintains the leading position, achieving the lowest RMSE and the highest CPC. This confirms that our multi-view expert design effectively transfers knowledge to future scenarios with unseen network topologies.
Notably, DeepFM fails severely, indicating that explicit feature interactions are prone to overfitting noise in more complicated OOD scenarios. While SI-GCN and NB-GNN achieve the highest raw coverage, they come at the cost of wider predicted intervals. In terms of calibrated MPIW c, our model achieves the sharpest interval. This demonstrates that our framework provides the most information-efficient uncertainty estimates, offering tighter bounds for the same level of calibration even in long-horizon planning.
| Model | RMSE | MAE | CPC | MPIW | PICP | MPIW c |
|---|---|---|---|---|---|---|
| PROB-EMOE | 75.079 | 43.114 | 0.527 | 153.780 | 0.745 | 173.862 |
| DG | 95.323 | 68.789 | 0.418 | 227.405 | 0.604 | 256.561 |
| DEEPFM | 364.750 | 261.224 | 0.166 | 770.889 | 0.662 | 1011.577 |
| SI-GCN | 102.596 | 73.062 | 0.346 | 235.700 | 0.854 | 286.099 |
| NB-GNN | 79.203 | 45.040 | 0.511 | 177.122 | 0.854 | 191.295 |
| SNB | 77.262 | 47.936 | 0.500 | 177.898 | 0.782 | 197.469 |
4 Real-world Impact and Deployment
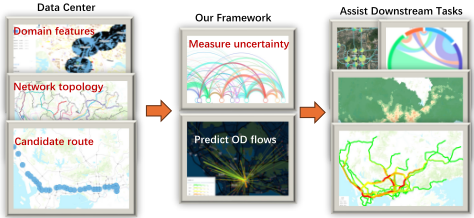
This study was conducted in active collaboration with the city's transportation planning authority responsible for metro planning and strategic transport management. The proposed framework has been deployed in the metropolitan transportation smart-data platform and is used by government and planning agencies to support data-driven workflows (Figure 5). In practice, the deployment enables stakeholders to (i) generate OD demand forecasts for candidate expansion plans, (ii) inspect predictive uncertainty to flag high-risk OD segments for further review, (iii) conduct scenario-based planning assessments, and (iv) support downstream operational analyses, such as corridor section flow analysis and transfer analysis.
5 RelatedWork
5.1 OD Flow Prediction for Planning
Planning-oriented OD flow prediction has long been studied in transportation and urban analytics. Early work relied on mobility theories, including the Gravity model [Zipf, 1946], Intervening Opportunities [Stouffer, 1940], and the Radiation model [Simini et al., 2012]. These models are interpretable but often struggle to capture real-world mobility patterns.
With the increasing availability of mobility data, research has shifted toward data-driven approaches, such as XGBoost and Random Forest [Robinson and Dilkina, 2018; Ghasri et al., 2017; Pourebrahim et al., 2019]. More recently, deep learning has enabled structured and relational modeling. Deep Gravity [Simini et al., 2021] combines neural networks with gravity-based inductive bias, while graph-based methods incorporate spatial dependence among locations or OD pairs [Liu et al., 2020; Yao et al., 2020; Liang et al., 2024; Ding et al., 2026].
Despite this progress, most studies focus on migration or commuting flows. Metro expansion planning, however, is distinct: (1) complex network dynamics induce heterogeneous interactions that defy single global mapping mechanisms; and (2) flow sparsity and over-dispersion challenge standard assumptions. While recent works have attempted to address planning-oriented prediction for metro system [Ding et al., 2024; Wang et al., 2022], the lack of uncertainty exploration necessitates our probabilistic framework.
5.2 Uncertainty QuantificationMethods
While early metro flow prediction studies predominantly focused on deterministic point estimates [Wang et al., 2022; Noursalehi et al., 2021], quantifying uncertainty has become a consensus for robust transportation planning [Rasouli and Timmermans, 2012; Baera et al., 2025]. Uncertainty is generally categorized into aleatoric (data randomness) and epistemic (model knowledge deficit) [Gawlikowski et al., 2023]. Aleatoric uncertainty is typically modeled via predictive variances [Kendall and Gal, 2017], whereas epistemic uncertainty can be approximated using Bayesian Neural Networks [Gal, 2016], Monte Carlo Dropout [Gal and Ghahramani, 2016], or Deep Ensembles [Lakshminarayanan et al., 2017].
In the traffic domain, Gaussian assumptions are commonly adopted for uncertainty-aware spatiotemporal forecasting, such as in UQGNN [Yu et al., 2025] and DeepSTUQ [Qian et al., 2023]. However, urban flows often exhibit overdispersion (variance exceeding the mean) and data sparsity [Jiang et al., 2023]. Consequently, distributions like Negative Binomial [Kim and Susilo, 2013] and Zero-Inflated models have proven superior in scenarios like freight [Middela and Ramadurai, 2021], micro-mobility [Liang et al., 2024], and ridesharing [Zhuang et al., 2022; Wang et al., 2024].
Despite these advances, existing probabilistic frameworks primarily rely on historical dependencies for short-term forecasting, rendering them ill-suited for long-term planning where such trends are unavailable or decoupled from infrastructure changes [Liang et al., 2024]. Furthermore, most studies overlook epistemic uncertainty, leading to model overconfidence in OOD scenarios (e.g., new lines). This motivates our proposed framework, which explicitly leverages spatial context for probabilistic modeling and quantifies epistemic uncertainty to mitigate extrapolation risks.
6 Conclusion
In this work, we addressed the challenge of forecasting newOD flows for metro network expansion. We proposed PROBEMOE, a unified probabilistic framework that synergizes a multi-view MoE architecture with Deep Ensembles to capture heterogeneous demand patterns and quantify uncertainty. Validated on a multi-year dataset, our approach achieves state-of-the-art performance and has been successfully deployed in a real-world smart-data platform to support risksensitive infrastructure planning.
Ethical Statement
There are no ethical issues.
Acknowledgements
The authors gratefully acknowledge the reviewers for their valuable comments and suggestions. This research is supported by the National Natural Science Foundation of China (42201502) and Seed Fund for Basic Research at The University of Hong Kong (109001117).
@inproceedings{ijcai2026p792,
  title     = {PROB-EMOE: A Probabilistic Ensemble Mixture-of-Experts Framework for Metro Network Expansion Forecasting},
  author    = {Ding, Fangyi and Zhao, Zhan and Li, Zhi and Guo, Xudong and Zhang, Ning and Wang, Yamin and Tang, Yihong},
  booktitle = {Proceedings of the Thirty-Fifth International Joint Conference on
               Artificial Intelligence, {IJCAI-26}},
  publisher = {International Joint Conferences on Artificial Intelligence Organization},
  editor    = {Diego Calvanese},
  pages     = {7120--7128},
  year      = {2026},
  month     = {8},
  note      = {AI and Social Good},
  doi       = {10.24963/ijcai.2026/792},
  url       = {https://doi.org/10.24963/ijcai.2026/792},
}
TY - CPAPER TI - PROB-EMOE: A Probabilistic Ensemble Mixture-of-Experts Framework for Metro Network Expansion Forecasting AU - Ding, Fangyi AU - Zhao, Zhan AU - Li, Zhi AU - Guo, Xudong AU - Zhang, Ning AU - Wang, Yamin AU - Tang, Yihong T2 - Proceedings of the Thirty-Fifth International Joint Conference on Artificial Intelligence, IJCAI-26 PB - International Joint Conferences on Artificial Intelligence Organization PY - 2026 SP - 7120 EP - 7128 DO - 10.24963/ijcai.2026/792 UR - https://doi.org/10.24963/ijcai.2026/792 ER -Copied
Machine-readable versions of this paper, for tools and AI agents:





