
When Can We Trust Fairness Audits? Identifying Reliability Boundaries of Third-party Audit Conclusions
Proceedings of the Thirty-Fifth International Joint Conference on Artificial Intelligence. AI and Social Good. Pages 7319-7327.
https://doi.org/10.24963/ijcai.2026/814
Keywords
- AI Ethics, Trust, Fairness: AI Ethics, Trust, Fairness
- AI4G: AI Ethics, Trust, Fairness
Abstract
Fairness auditing aims to assess whether a model is fair, playing a critical role in identifying potential risks in deployed AI systems. In practice, due to limited access, third-party auditors often rely on self-collected datasets (e.g., via sock-puppets), which may differ from real-world deployment scenarios. Such discrepancy can lead to inconsistencies between audit conclusions on the collected data and those in actual deployment, raising concerns about the reliability of third-party audits. This motivates a critical question: When can we trust the fairness audit conclusion derived from third-party datasets? Answering this question is challenging, as the actual deployment distribution is typically inaccessible or unobservable. To tackle this, we introduce the Consistency Radius, a metric that quantifies the maximum distribution shift under which an audit conclusion based on third-party dataset remain consistent. We further propose a convex relaxation optimization-based method to estimate the radius relying solely on model responses over the audit dataset. Leveraging this framework, third-party auditors can provide their datasets to model providers and request the magnitude of distributional discrepancy relative to the deployment distribution, enabling reliable audit conclusions without requiring any direct data access.
- [Asplund et al., 2020] Joshua Asplund, Motahhare Eslami, Hari Sundaram, Christian Sandvig, and Karrie Karahalios. Auditing race and gender discrimination in online housing markets. In Proceedings of the international AAAI confer- ence on web and social media, volume 14, pages 24-35, 2020.
- [Bandy, 2021] Jack Bandy. Problematic machine behavior: A systematic literature review of algorithm audits. Pro- ceedings of the ACM on Human-Computer Interaction, 5(CSCW1):1-34, 2021.
- [Barlas et al., 2021] Pinar Barlas, Kyriakos Kyriakou, Olivia Guest, Styliani Kleanthous, and Jahna Otterbacher. To "see" is to stereotype: Image tagging algorithms, gen- der recognition, and the accuracy-fairness trade-off. Pro- ceedings of the ACM on Human-Computer Interaction, 4(CSCW3):1-31, 2021.
- [Buolamwini and Gebru, 2018] Joy Buolamwini and Timnit Gebru. Gender shades: Intersectional accuracy dispari- ties in commercial gender classification. In Conference on fairness, accountability and transparency, pages 77- 91. PMLR, 2018.
- [Cachel and Rundensteiner, 2022] Kathleen Cachel and Elke Rundensteiner. Fins auditing framework: Group fair- ness for subset selections. In Proceedings of the 2022 AAAI/ACM Conference on AI, Ethics, and Society, pages 144-155, 2022.
- [Cherian and Candès, 2024] John J Cherian and Emmanuel J Candès. Statistical inference for fairness auditing. Journal of machine learning research, 25(149):1-49, 2024.
- [Chinta et al., 2025] Sribala Vidyadhari Chinta, Zichong Wang, Avash Palikhe, Xingyu Zhang, Ayesha Kashif, Monique Antoinette Smith, Jun Liu, and Wenbin Zhang. Ai-driven healthcare: Fairness in ai healthcare: A survey. PLOS digital health, 4(5), 2025.
- [Chugg et al., 2023] Ben Chugg, Santiago Cortes-Gomez, Bryan Wilder, and Aaditya Ramdas. Auditing fairness by betting. Advances in Neural Information Processing Sys- tems, 36:6070-6091, 2023.
- [Csiszár and Körner, 2011] Imre Csiszár and János Körner. Information theory: coding theorems for discrete memo- ryless systems. Cambridge University Press, 2011.
- [Fabris et al., 2023] Alessandro Fabris, Andrea Esuli, Ale- jandro Moreo, and Fabrizio Sebastiani. Measuring fairness under unawareness of sensitive attributes: A quantification-based approach. Journal of Artificial Intel- ligence Research, 76:1117-1180, 2023.
- [Ganta et al., 2024] Teja Ganta, Arash Kia, Prathamesh Parchure, Min-heng Wang, Melanie Besculides, Madhu Mazumdar, and Cardinale B Smith. Fairness in predicting cancer mortality across racial subgroups. JAMA Network Open, 7(7):e2421290-e2421290, 2024.
- [Harper and Konstan, 2015] F Maxwell Harper and Joseph A Konstan. The movielens datasets: History and context. ACM Transactions on Interactive Intelligent Systems (TIIS), 5(4):1-19, 2015.
- [Hashimoto et al., 2018] Tatsunori Hashimoto, Megha Sri- vastava, Hongseok Namkoong, and Percy Liang. Fair- ness without demographics in repeated loss minimization. In International Conference on Machine Learning, pages 1929-1938. PMLR, 2018.
- [He et al., 2016] Kaiming He, Xiangyu Zhang, Shaoqing Ren, and Jian Sun. Deep residual learning for image recog- nition. In Proceedings of the IEEE conference on computer vision and pattern recognition, pages 770-778, 2016.
- [He et al., 2020] Xiangnan He, Kuan Deng, Xiang Wang, Yan Li, Yongdong Zhang, and Meng Wang. Lightgcn: Simplifying and powering graph convolution network for recommendation. In Proceedings of the 43rd International ACM SIGIR Conference on Research and Development in Information Retrieval, SIGIR '20, pages 639-648, 2020.
- [Hsu et al., 2024] Daniel Hsu, Jizhou Huang, and Brendan Juba. Distribution-specific auditing for subgroup fairness. arXiv preprint arXiv:2401.16439, 2024.
- [Imana et al., 2021] Basileal Imana, Aleksandra Korolova, and John Heidemann. Auditing for discrimination in al- gorithms delivering job ads. In Proceedings of the web conference 2021, pages 3767-3778, 2021.
- [Kallus et al., 2022] Nathan Kallus, Xiaojie Mao, and An- gela Zhou. Assessing algorithmic fairness with unob- served protected class using data combination. Manage- ment Science, 68(3):1959-1981, 2022.
- [Kearns et al., 2018] Michael Kearns, Seth Neel, Aaron Roth, and Zhiwei Steven Wu. Preventing fairness gerry- mandering: Auditing and learning for subgroup fairness. In International conference on machine learning, pages 2564-2572. PMLR, 2018.
- [Kearns et al., 2019] Michael Kearns, Seth Neel, Aaron Roth, and Zhiwei Steven Wu. An empirical study of rich subgroup fairness for machine learning. In Proceedings of the conference on fairness, accountability, and trans- parency, pages 100-109, 2019.
- [Kohavi and others, 1996] Ron Kohavi et al. Scaling up the accuracy of naive-bayes classifiers: A decision-tree hy- brid. In Kdd, volume 96, pages 202-207, 1996.
- [Li et al., 2021] Yunqi Li, Hanxiong Chen, Zuohui Fu, Yingqiang Ge, and Yongfeng Zhang. User-oriented fair- ness in recommendation. In Proceedings of the web con- ference 2021, pages 624-632, 2021.
- [Liu et al., 2015] Ziwei Liu, Ping Luo, Xiaogang Wang, and Xiaoou Tang. Deep learning face attributes in the wild. In Proceedings of International Conference on Computer Vision (ICCV), December 2015.
- [Lo et al., 2025] Victor SY Lo, Sayan Datta, and Youssouf Salami. Bringing practical statistical science to ai and pre- dictive model fairness testing. AI and Ethics, 5(3):2149- 2164, 2025.
- [Maity et al., 2021] Subha Maity, Songkai Xue, Mikhail Yurochkin, and Yuekai Sun. Statistical inference for in- dividual fairness. arXiv preprint arXiv:2103.16714, 2021.
- [Martinez et al., 2020] Natalia Martinez, Martin Bertran, and Guillermo Sapiro. Minimax pareto fairness: A multi objective perspective. In International conference on ma- chine learning, pages 6755-6764. PMLR, 2020.
- [Necula and Pȃvȃloaia, 2023] Sabina-Cristiana Necula and Vasile-Daniel Pȃvȃloaia. Ai-driven recommendations: A systematic review of the state of the art in e-commerce. Applied Sciences, 13(9):5531, 2023.
- [Owen, 2001] Art B Owen. Empirical likelihood. Chapman and Hall/CRC, 2001.
- [Raji et al., 2020] Inioluwa Deborah Raji, Timnit Gebru, Margaret Mitchell, Joy Buolamwini, Joonseok Lee, and Emily Denton. Saving face: Investigating the ethical con- cerns of facial recognition auditing. In Proceedings of the AAAI/ACM Conference on AI, Ethics, and Society, pages 145-151, 2020.
- [Saleiro et al., 2018] Pedro Saleiro, Benedict Kuester, Loren Hinkson, Jesse London, Abby Stevens, Ari Anisfeld, Kit T Rodolfa, and Rayid Ghani. Aequitas: A bias and fairness audit toolkit. arXiv preprint arXiv:1811.05577, 2018.
- [Sandvig et al., 2014] Christian Sandvig, Kevin Hamilton, Karrie Karahalios, and Cedric Langbort. Auditing al- gorithms: Research methods for detecting discrimina- tion on internet platforms. Data and Discrimination: Converting Critical Concerns into Productive Inquiry, 22(2014):4349-4357, 2014.
- [Shao et al., 2024] Minglai Shao, Dong Li, Chen Zhao, Xin- tao Wu, Yujie Lin, and Qin Tian. Supervised algorithmic fairness in distribution shifts: A survey. arXiv preprint arXiv:2402.01327, 2024. IJCAI
- [Shen et al., 2025] Huawei Shen, Yuanhao Liu, Kaike Zhang, Qi Cao, and Xueqi Cheng. The rising safety con- cerns of deep recommender systems. The Innovation, 2025.
- [Singh et al., 2023] Harvineet Singh, Fan Xia, Mi-Ok Kim, Romain Pirracchio, Rumi Chunara, and Jean Feng. A brief tutorial on sample size calculations for fairness au- dits. arXiv preprint arXiv:2312.04745, 2023.
- [Singhal et al., 2025] Mohit Singhal, Javier Pacheco, Seyyed Mohammad Sadegh Moosavi Khorzooghi, Tanusree Debi, Abolfazl Asudeh, Gautam Das, and Shirin Nilizadeh. Au- diting yelp's business ranking and review recommendation through the lens of fairness. In Proceedings of the Inter- national AAAI Conference on Web and Social Media, vol- ume 19, pages 1798-1816, 2025.
- [Sweeney, 2013] Latanya Sweeney. Discrimination in online ad delivery. Communications of the ACM, 56(5):44-54, 2013.
- [Taskesen et al., 2021] Bahar Taskesen, Jose Blanchet, Daniel Kuhn, and Viet Anh Nguyen. A statistical test for probabilistic fairness. In Proceedings of the 2021 ACM conference on fairness, accountability, and transparency, pages 648-665, 2021.
- [TeBlunthuis et al., 2021] Nathan TeBlunthuis, Ben- jamin Mako Hill, and Aaron Halfaker. Effects of algorithmic flagging on fairness: Quasi-experimental evidence from wikipedia. Proceedings of the ACM on Human-Computer Interaction, 5(CSCW1), apr 2021.
- [Trielli and Diakopoulos, 2019] Daniel Trielli and Nicholas Diakopoulos. Search as news curator: The role of google in shaping attention to news information. In Proceedings of the 2019 CHI Conference on human factors in comput- ing systems, pages 1-15, 2019.
- [Yan and Zhang, 2022] Tom Yan and Chicheng Zhang. Ac- tive fairness auditing. In International Conference on Ma- chine Learning, pages 24929-24962. PMLR, 2022.
References were extracted automatically from the PDF and may contain errors.
Full text extracted automatically from the PDF; figures, tables and equations may differ. The PDF is the version of record.
1 Introduction
Algorithmic fairness is critical for machine learning systems governing access to opportunities [Chinta et al., 2025; Necula and P˘av˘aloaia, 2023; Shen et al., 2025]. To mitigate systematic discrimination, fairness auditing [Sandvig et al., 2014; Buolamwini and Gebru, 2018], which assesses whether models are fair, has become standard practice for responsible AI.
Fairness auditing generally operates by assessing performance disparities across demographic groups [Bandy, 2021]. Ideally, this assessment would be conducted on the underlying deployment distribution-the "ground truth" population the model actually serves. However, third-party auditors typically lack access to this population due to privacy considerations and commercial barriers [Barlas et al., 2021]. Instead, they rely on third-party audit datasets constructed via simulated accounts (sock-puppets) or public benchmarks [Asplund et al., 2020; Kallus et al., 2022]. Inevitably, these thirdparty datasets suffer from sampling biases and diverge from the unobserved deployment distribution.
* Corresponding author.
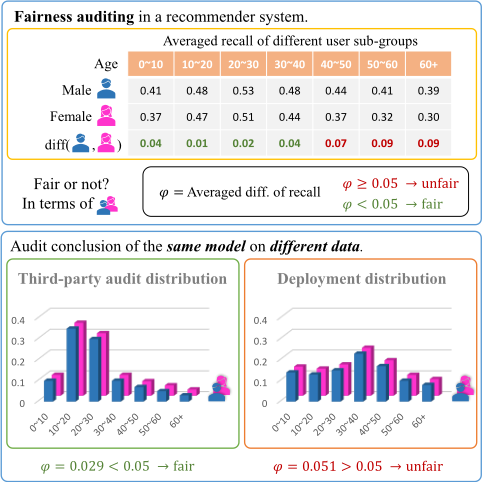
This divergence poses a fundamental challenge because fairness metrics are highly sensitive to data distributions [Shao et al., 2024]. Figure 1 illustrates this phenomenon through a fairness audit of a recommender system. Initially, within a young-dominated audit dataset, the model exhibits gender fairness with comparable recommendation accuracy across groups. However, a distribution shift to a balanced population reverses this conclusion to unfair, indicating that audit conclusions derived from a third-party dataset may no longer hold under the deployment distribution.
In this work, we point out the inconsistency between audit conclusions from third-party data and deployment distribution. Since the actual deployment distribution is unobservable, we cannot directly verify the audit conclusion against it. Instead, we adopt a certification perspective, defining the Consistency Radius as the maximum distribution shift under which an audit conclusion based on a third-party dataset remains consistent. We further propose a convex relaxationbased optimization method to estimate the radius. By definition, the radius serves as a safety margin: the audit conclusion is guaranteed to remain valid as long as the divergence between the audit data and deployment distribution falls within this radius. Practically, the radius allows auditors to verify reliability without accessing private user data by simply comparing the calculated radius against the shift magnitude, which can be provided by model owners.
Collaboration Statement. We collaborated with domain experts from a national technical center for algorithm governance (identity anonymized). They participated in (1) Problem formulation of the auditing paradigm with third-party audit data and (2) Mechanism validation for our proposed auditing protocol based on the consistency radius.
Evaluation Strategy. Given the inaccessibility of deployment data, we simulate diverse distribution shifts on public datasets to approximate real-world deployment discrepancies. We assess reliability by measuring how often the radius fails to identify shifts that overturn the audit conclusion.
Our contributions are:
- We point out the problem of inconsistency in audits, and define the consistency radius as a metric to reason about auditing consistency to unobserved distributions.
- We propose a convex relaxation-based optimization method to estimate the radius relying solely on model responses over the audit dataset.
- We demonstrate that the consistency radius reliably predicts whether audit conclusions hold under shifts, enabling trustworthy certificates in third-party audits.
2 RelatedWorks
Empirical Fairness Auditing. Fairness auditing is a primary mechanism for evaluating machine learning systems in high-stakes domains [Raji et al., 2020; Singhal et al., 2025]. In third-party settings, auditors rely on audit datasets from external sampling (e.g., sock-puppets or surveys) [Sweeney, 2013; Trielli and Diakopoulos, 2019; TeBlunthuis et al., 2021]. Despite efforts to improve sampling representativeness [Raji et al., 2020; Imana et al., 2021], a fundamental limitation persists: auditors often lack access to the system's deployment distribution [Barlas et al., 2021; Fabris et al., 2023]. Thus, it is unclear if audit conclusions derived from audit datasets generalize to actual users, rendering empirical audits potentially unreliable under distribution shifts.
Statistical Fairness Guarantees. A few recent works derive statistically reliable fairness conclusions using a limited amount of unbiased audit data to infer distributionlevel statistics [Taskesen et al., 2021; Maity et al., 2021;
Yan and Zhang, 2022; Chugg et al., 2023; Singh et al., 2023; Lo et al., 2025]. While some studies extend these evaluations to shifted distributions [Taskesen et al., 2021], they require access to the target distribution for density ratio estimation. In our strict third-party setting where the deployment distribution is unobservable, these methods are not applicable.
Subgroup Fairness Auditing. Subgroup fairness auditing examines model performance across fine-grained subpopulations, highlighting that coarse-grained metrics can mask severe local disparities [Kearns et al., 2018; Cherian and Cand`es, 2024; Hsu et al., 2024; Ganta et al., 2024]. These methods aim to identify the subgroups with the poorest fairness, involving a challenging search in multi-dimensional space [Kearns et al., 2019; Cachel and Rundensteiner, 2022]. While related, they differ in scope: subgroup methods evaluate fairness over a predefined set of distribution shifts (corresponding to specific subgroups). In contrast, our method establishes a consistency radius that certifies the reliability of the audit conclusion against any shift within a continuous margin, regardless of the shift form.
3 ProblemFormalization
In this section, we begin by formalizing fairness assessment on the audit dataset and then define the consistency radius under distribution shifts.
3.1 Fairness Assessment
Consider a prediction model f : X → Y. Each data point x ∈ X is associated with a sensitive attribute, which identifies subgroups that should be treated equitably. We focus on binary sensitive attributes, e.g., sex (male/female). While multi-group fairness involves objectives like Max-Min fairness [Martinez et al., 2020; Hashimoto et al., 2018], the binary setting captures the core challenge of auditing consistency under distribution shifts.
We assume access to an audit dataset D = {(xi, yi)}ni=1 sampled i.i.d. from distribution P. Based on the binary sensitive attribute, D is partitioned into two group-specific subsets, denoted by D0 and D1. The fairness of model f is evaluated based on the discrepancy in performance between the two groups [Saleiro et al., 2018; Cachel and Rundensteiner, 2022]. Since the underlying audit distribution P is observed through the dataset D, we estimate its empirical fairness as:
where mi = M(f(xi), yi) is an instance-level performance metric, such as prediction correctness for classification or utility score for recommendation [Li et al., 2021].
Based on this evaluation, a fairness assessment is formed as a binary conclusion relative to a tolerance ϵ ≥ 0. We formally define the assessment function A as:
Here, we distinguish between two key terms: fairness evaluation refers to the numerical value φ(P), while fairness assessment refers to the logical conclusion A(f, P, ϵ).
3.2 Consistency Radius
A fundamental challenge in fairness auditing is the potential discrepancy between the audit distribution P , from which the dataset D is sampled, and the target distribution Ph where the model is deployed. Since Ph is often unknown, we aim to measure the robustness of the fairness assessment against potential shifts from P to Ph.
We characterize the shift from P to Ph using a density ratio function h : X × Y → R+, so that the target distribution can be viewed as a reweighted version of the audit distribution P :
By introducing the empirical likelihood assumption [Owen, 2001], we approximate this population shift by assigning a discrete weight hi to each observed sample (xi, yi) ∈ D. The vector h = [h1, . . . , hn]⊤ represents the discrete density ratio, subject to 1n ∑ni=1 hi = 1. This formulation models distribution shifts solely by altering the probability mass assigned to each data point in X ×Y, while the intrinsic relation of features, labels, and sensitive attributes remains invariant.
Under a hypothesized shift h, the fairness evaluation on the shifted distribution Ph becomes a weighted average:
We similarly define the assessment on the shifted distribution Ph as A(f, Ph, ϵ) = fair if |φ(Ph)| < ϵ, and unfair otherwise.
We define the consistency radius R(f, P, ϵ) as the maximum magnitude of distribution shift that the fairness assessment can withstand.
Definition 1 (Consistency Radius). Given a model f, an audit distribution P, and a threshold ϵ, the consistency radius
where d(h) is a measurement of divergence between distributions after and before a shift h.
The definition is agnostic to the divergence measure; unless otherwise specified, we adopt the discrete KullbackLeibler (KL) divergence as d, i.e., d(h) = KL(Ph||P) = 1n ∑ni=1 hi log hi.
Intuitively, the consistency radius R serves as a "safety margin" for the audit conclusion. Based on Pinsker's inequality [Csisz´ar and K¨orner, 2011], a larger R guarantees that the fairness assessment remains valid for any shift within the KL radius, which allows the probability of any event in the deployment environment to deviate from the audit environment by up to √R/2.
4 Methodology
In this section, we model the computation of the consistency radius as a constrained optimization problem and propose a convex-based optimization algorithm to estimate the consistency radius of fairness assessment.
Supplementary material including code and additional details is available at: https://unitdan.github.io/#consistency-radius.
4.1 Convex Relaxation for Optimization
To facilitate optimization, we vectorize the fairness evaluation φ(Ph) in Equation 3. With n denoting the sample size of the audit dataset, we define the performance vector m ∈ Rn where mi = M(f(xi), yi), and the group indicator vector g ∈ {0, 1}n . Equation 3 is rewritten as:
where ⊙ is the Hadamard product. The terms (1 - g)⊤h = ∑i∈D0 hi and g⊤h = ∑i∈D1 hi represent the effective sample mass of the two groups, respectively.
We formulate the computation of the consistency radius R(f, P, ϵ) as a constrained optimization problem:
Here, H := {h ∈ Rn+ : 1⊤h = n} ensures the validity of the density ratio, while the constraint of A(f, Ph, ϵ) ̸= A(f, P, ϵ) indicates |φ(Ph)| < ϵ if |φ(P)| ≥ ϵ and |φ(Ph)| ≥ ϵ if |φ(P )| < ϵ.
The objective d(h) (KL divergence) is strictly convex. However, the feasible region of the fairness constraint is nonconvex. Direct application of greedy methods (e.g., an interpolation by the direction of the gradient of |φ(Ph)|) to Equation 5 is prone to getting stuck in local optima due to this non-convexity. In the context of safety auditing, such local optima are dangerous as they lead to an overestimation of the audit's consistency (i.e., failing to discover the true minimal shift required to break fairness).
To avoid local optimality, we adopt a convex relaxation approach. We replace the non-convex fairness measurement |φ(Ph)| with a linear surrogate w⊤h, justified by the Proxyband Concentration proposition:
Proposition 1 (Proxy-band Concentration). Let Hϕ := {h ∈ H : φ(Ph) = ϕ} be the set of h with the same level of fairness. For two points h, h′ sampled from Hϕ and any vector w ∈ Rn , for any β ∈ (0, 1), the following concentration bound holds:
where A = √E[∥h - h′ ∥2 ], and B quantifies the misalignment between w and the gradient of φ:
This proposition can be proved by applying a line-integral decomposition to φ(Ph) - φ(Ph′ ) = 0 for h, h′ ∈ Hϕ.
Equation 6 indicates that the bandwidth AB/β is controlled by the effective diameter A of the Hϕ and the gradientmisalignment term B. Since A is determined by the geometry of Hϕ and is not controllable, we can minimize the bandwidth by reducing B, which requires w to align closely with ∇φ over Hϕ. Consequently, a narrower band means that any distribution shifts h and h′ with the same fairness value φ(Ph) = φ(Ph′ ) will also have nearly identical linear proxy values, i.e., w⊤h ≈w⊤h′ .
4.2 Linearizing the Fairness Constraint
According to Proposition 1, minimizing the proxy-band width requires the surrogate vector w to align with the gradient ∇φ(Ph) on the constraint set Hϕ. To characterize this ideal direction, we differentiate Equation 4 and obtain:
where Ngi and µgi denote the total mass and weighted mean of the group containing sample i:
In principle, the optimal w varies across different sets Hϕ. Since both Ngi (h) and µgi (h) depend on the unknown distribution shift h, directly estimating a separate w for each Hϕ is infeasible. We instead construct a static surrogate vector w⋆ by anchoring the approximation at a special Hϕ with ϕ ≈ 0, where the group-level performances are approximately balanced. This means that the weighted mean µgi (h) of each group is expected to move toward the performance region of the opposing group. Therefore, although the exact value of µgi (h) remains unknown, the opposing group's support range R¬i = [minj∈D1-i mj,maxj∈D1-i mj] provides an observable approximation to its plausible location. This allows us to approximate the magnitude of the Deviation Term by measuring how far mi lies from the opposing group's range.
We therefore define w⋆ as:
where the function dist(x, [a, b]) = max(0, a-x, x-b) measures the distance from mi to the nearest boundary of R¬i, and the residual term δ(mi) assigns a small positive weight to samples in the overlapping region. In this way, we transform the Deviation Term into a static weight vector w⋆ , where each entry measures how far the corresponding sample lies from the anchor condition where ϕ ≈ 0. Intuitively, if h represents a distribution shift that moves the system toward a fair state, it should place less mass on samples with large w⋆ i , thereby minimizing the linear proxy w⋆⊤h. The Scale Term is omitted in this construction and will be incorporated through an optimization regularizer in Section 4.3.
4.3 Consistency Radius Estimation Algorithm
Based on the convex relaxation, we present CoRe (Convex Relaxation for Consistency Radius Estimation). Since w⋆ captures the sample-level sensitivity implied by the fair anchor, the linear proxy w⋆⊤h is expected to be approximately monotonic with the true fairness evaluation. CoRe exploits this monotonicity using a bi-level structure to bridge the numerical gap between the proxy and the true metric:
Inner Level (Convex Optimization). We solve for the optimal distribution shift h in a convex optimization problem:
Algorithm 1 CoRe: Consistency Radius Estimation
Require: tolerance threshold ϵ > 0, model performance
metrics m ∈ Rn and group memberships g ∈ {0, 1}n Ensure: Consistency Radius R or infeasible 1: Compute w⋆ via Eq. 8 2: Initialize binary search interval [low, high] for ϵproxy 3: repeat 4: ϵproxy ← (low+high)/2 5: Solve convex problem (Eq. 9) to obtain h 6: if feasible then 7: Calculate true fairness evaluation |φ(Ph)| 8: if |φ(Ph)| < ϵ then 9: low ← ϵproxy // Relax proxy constraint 10: else 11: high ← ϵproxy // Tighten proxy constraint 12: end if 13: else 14: return infeasible 15: end if 16: until ||φ(Ph)|-ϵ| < 1×10⁻⁵ or max iterations reached 17: return d(h)Here we incorporate a regularization term λ((1 - g)⊤h - g⊤h)2 to stabilize the Scale Term in Equation 7. Note that the inequality direction (≤ or ≥) in the condition depends on whether the initial audit is fair or unfair. For brevity, Algorithm 1 illustrates the initially unfair case.
Outer Level (Binary Search). We iteratively calibrate the proxy threshold ϵproxy via binary search. By tightening or relaxing ϵproxy, we locate the exact boundary where the resulting true fairness evaluation |φ(Ph)| converges to the target tolerance ϵ.
Complexity Analysis. CoRe wraps a convex solver in a binary search loop. Let n denote the size of the audit dataset. The inner strictly convex problem (Eq. 9) is solvable via interior-point methods in O(n3 ). In practice, the entropybased objective typically exhibits faster convergence. With T binary search iterations (typically T ≈ 20), the total complexity is O(T · n3 ), ensuring scalability.
5 Experiments for Evaluating the Method
In this section, we evaluate the proposed estimation method (CoRe). We aim to answer three research questions:
- RQ1 (Accuracy): Can the method accurately estimate the consistency radius compared to ground truth and numerical baselines?
- RQ2 (Effectiveness): Does the estimated radius serve as a tight and valid lower bound for distributional shifts in complex, real-world scenarios without a ground truth?
- RQ3 (Stability): How sensitive is the estimation to the size of the audit dataset?
5.1 Experimental Setup
Datasets. We utilize two synthetic distributions and three real-world datasets covering multiple data types:
| Method | ϵ0 | ϵ1 | ϵ2 | ϵ3 | ϵ4 | ϵ5 | ϵ6 | ϵ7 | ϵ8 | ϵ9 | Overall |
|---|---|---|---|---|---|---|---|---|---|---|---|
| Greedy-Search | 5.25 | 5.80 | 6.45 | 7.12 | 8.90 | 10.55 | 13.20 | 16.40 | 19.80 | 24.15 | 11.76 |
| Worst-Group | 4.87 | 5.15 | 6.02 | 6.63 | 8.15 | 9.40 | 11.85 | 14.20 | 17.55 | 21.30 | 10.53 |
| CoRe (Ours) | 0.01 | 0.05 | 0.14 | 0.22 | 0.35 | 0.57 | 0.88 | 1.03 | 1.44 | 2.23 | 0.45 |
- Synthetic Trinomial: We constructed a simple dataset from a trinomial distribution X ∈ {0, 1, 2}. By grid searching the values of P (X = i), we can discretely traverse all possible distribution shifts to derive a groundtruth consistency radius. We define a sensitive attribute that partitions samples with different values into two groups D0 (if X ∈ {0, 1}) and D1 (if X = 2). Rather than explicitly specifying the model f, label Y , and performance metric function M, we assign a random value mi to each X = i to simulate the composite model performance metric M(f(x), y) for simplicity. We sample 10 performance vectors and 10 audit distributions, yielding 100 configurations, and test 10 feasible thresholds for each configuration.
- Synthetic Gaussian: We constructed a more complex synthetic dataset where X ∼ N(0, 1). Although it is infeasible to traverse all possible distribution shifts to calculate the ground-truth radius for this dataset, we can empirically estimate the consistency radius by constructing specific shifted distributions through simple perturbations (e.g., of the mean and variance). We defined X ∈ D0 if X ≤ 0, and D1 otherwise, to evenly partition the samples into two groups. Similar to the Synthetic Trinomial dataset, we specified the performance metric as M(x) = sigmoid(x) to avoid explicitly defining the model and labels. The sigmoid function ensures that different samples x yield varying model performance, while also inducing significant performance disparity between the groups D0 and D1.
- Real-World Datasets: Compared to synthetic datasets, real-world data distributions are significantly more complex. We thus rely on biased sampling to simulate distribution shifts. We employ three widely-used datasets covering structured data, user interaction, and images to demonstrate generalizability:
- Adult [Kohavi and others, 1996] (Structured): Predicting income levels using an MLP classifier.
- ML-1m [Harper and Konstan, 2015] (Interaction): Predicting user preferences in recommendation using LightGCN [He et al., 2020].
- CelebA [Liu et al., 2015] (Image): Predicting the "Smiling" attribute of photos using ResNet-18 [He et al., 2016].
We set the sensitive attribute as sex (Male/Female) for all the real-world datasets. The performance function M is set to be the prediction correctness for Adult and CelebA, and user-level recall for ML-1m.
For all datasets, we sample n instances (default n = 1000) to form the audit set D.
Methods andBaselines. Since no existing baseline directly addresses our problem, we design two comparison methods:
- Greedy-Search: A greedy method that searches from the all-ones vector (no distribution shift) along the gradient of φ(Ph) to induce the largest fairness changes with the smallest distribution shifts.
- Worst-Group: A heuristic strategy inspired by subgroup fairness audits. It identifies the subgroup contributing most to the fairness gap and iteratively adjusts its weight until the fairness threshold is approached.
5.2 RQ1: Accuracy Verification
We evaluate the accuracy of CoRe on the Synthetic Trinomial dataset, where the ground truth radius is explicitly calculable. Specifically, to implement the Worst-Group baseline in this setting, we treat the distinct values within the group D0 (i.e., X = 0 and X = 1) as separate subgroups.
Recall that the consistency radius R(f, P, ϵ) depends on whether the fairness evaluation φ(P) falls within the tolerance threshold ϵ. Intuitively, the magnitude of the radius and the difficulty of estimation are influenced by the audit margin, which is the difference between the observed evaluation φ(P) and the threshold ϵ. Considering this influence, for each audit distribution P , we divide the feasible range of ϵ equally and obtain 10 equally spaced points ϵ0, . . . , ϵ9, sorted in ascending order of the margin ∣∣|φ(P)| - ϵ∣∣. Specifically, ϵ0 denotes minimal margins (which can be fragile and critical), whereas ϵ9 denotes large margins (requiring large shifts to reverse, thus less critical).
We employ Median Absolute Percentage Error (MdAPE) relative to the ground truth radius as our primary metric to mitigate the influence of extreme outliers.
Table 1 shows error trends across margins. CoRe outperforms baselines on all ϵ settings with a low MdAPE of 0.45. For small margins (ϵ0∼4), CoRe achieves negligible error (MdAPE < 0.4). This confirms our convex relaxation is tight in critical scenarios. Its larger errors at ϵ7∼9 mainly stem from the approximation induced by anchoring the surrogate at ϕ ≈ 0. In contrast, Worst-Group yields much higher error because it restricts shifts to a single subgroup axis, while the optimal shift often requires coordinated adjustments over multiple values. Greedy-Search also produces large errors due to entrapment in local optima.
5.3 RQ2: Effectiveness Validation
We next verify if CoRe provides a valid and tight lower bound in a more complex scenario without ground truth. We compare CoRe against baselines on the Synthetic Gaussian dataset and the real-world benchmarks. For the Worst-Group, we define subgroups using auxiliary attributes: sample magnitude (|x| < 0.3, ensuring subgroups have sufficient samples) for the Synthetic Gaussian dataset, race (White/NonWhite) for Adult and CelebA, and age (7 groups) for ML-1m.
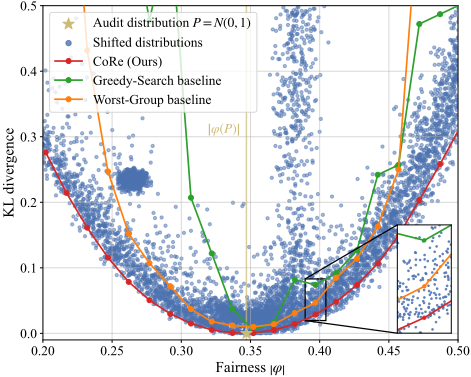
We first visually validate the boundary on the Synthetic Gaussian dataset in Figure 2. The audit distribution N(0, 1) is marked by a star at its fairness evaluation |φ(P)|. The xaxis represents the fairness metric, and the y-axis represents the distribution shift (KL divergence d(h)). The 4,000 scatter points represent parametrically shifted distributions h at coordinates (|φ(Ph)|, d(h)). The curves connect the consistency radii estimated by different methods across a range of auditing thresholds ϵ. Ideally, for any given threshold ϵ, the consistency radius represents the minimum shift required to force the fairness evaluation to reach ϵ, forming a tight lower envelope along the scatters' bottom edge.
As shown, the CoRe curve (red) tightly hugs the bottom of the scattered points, meaning almost all shifts are bounded. In contrast, the Greedy-Search and Worst-Group curves float significantly higher, leaving many scatter points below them. These points below the curve represent "shortcuts", shifts that overturn fairness with a cost lower than the baselines' estimation, confirming that baselines overestimate the radius and fail to detect the minimal shifts.
For real-world datasets, where we cannot construct parametric shifts, we design an "adversarial" evaluation protocol. Specifically, for a given threshold ϵ, each radius estimation method identifies a critical shifted distribution ˜h such that the fairness evaluation on ˜h hits the fairness threshold (i.e., φ(P˜h ) = ϵ). To verify the robustness of the estimated radius around this critical point, we generate local adversarial samples by injecting random noise into ˜h. For each ˜h, we generate perturbed distributions h′ by adding random noise of norm α (followed by projection onto the probability simplex to ensure validity).
| Dataset | Method | Perturbation Intensity (α) | ||
|---|---|---|---|---|
| 0.01 | 0.05 | 0.10 | ||
| Adult | Greedy-Search Worst-Group CoRe | 0.44 0.78 0.02 | 0.46 0.86 0.01 | 0.52 0.75 0.00 |
| ML-1m | Greedy-Search Worst-Group CoRe | 0.37 0.60 0.01 | 0.52 0.63 0.01 | 0.67 0.59 0.00 |
| CelebA | Greedy-Search Worst-Group CoRe | 0.44 0.83 0.03 | 0.47 0.71 0.01 | 0.62 0.79 0.01 |
We compute the Local Misjudge Rate (LMR): the proportion of h′ reversing the conclusion with d(h′ ) within the radius. High LMR implies a loose radius, failing to exclude risky distributions. We aggregate 100 generated shifts h′ per method for evaluating all methods.
Table 2 reports the LMR across different perturbation intensities (α ∈ {0.01, 0.05, 0.1}). CoRe consistently maintains the lowest LMR across all noise levels, demonstrating that its estimated boundary is robust even under varying degrees of adversarial perturbation. In contrast, the baselines, particularly Worst-Group, exhibit significantly higher misjudgment rates. This confirms that baselines tend to overestimate the radius, leaving "blind spots" near the boundary that are easily exploited by random perturbations.
5.4 RQ3: Stability with Audit Sample Size
Finally, we examine the sensitivity of CoRe to the size of the audit dataset. This is crucial for practitioners to understand the data requirements for a reliable estimation.
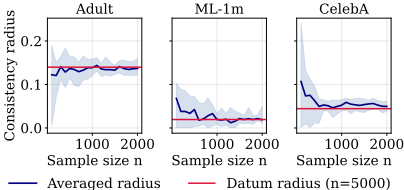
We conduct experiments on the real-world datasets. We vary the audit sample size n from 100 to 2,000. To establish a reference value, we compute the consistency radius using a large sample size (n = 5, 000). For each setting, we repeat the experiment 20 times to measure the variance arising from sampling randomness.
Figure 3 illustrates the mean estimated radius (solid line) and the standard deviation (shaded region) across different sample sizes. The average estimated radius stabilizes quickly. On all datasets, the estimation converges to the reference value once the sample size reaches approximately n = 1, 000. The variance of the estimation also decreases significantly as n increases. Even with smaller samples (n = 500), the method produces reasonably stable estimates. These results indicate that CoRe is highly data-efficient.
6 Practical Implementation
We present a blind auditing protocol and use simulations to address experts' questions.
6.1 Consistency Radius in Practice
The consistency radius decouples audit verification from accessing deployment distributions. By determining the consistency radius, the auditors can verify an audit conclusion solely based on the magnitude of the distribution shift, which can be requested from the model provider. This property enables a reliable fairness audit that strictly preserves the privacy of the deployment environment.
6.2 The Blind Auditing Protocol
While radius-based verification preserves privacy, selfreported distribution shifts pose a risk of dishonesty. We propose a Blind Auditing Protocol to encourage honest reporting.
In this protocol, auditors present multiple audit datasets and ask model providers to report the magnitude of distribution shift between private deployment data and audit datasets, keeping providers blinded to audit outcomes and radii. This information asymmetry encourages honest reporting but cannot by itself guarantee truthfulness; in practice, it can be complemented by spot checks, contractual penalties, or regulatory oversight. It creates a strategic dilemma: (1) Indiscriminate Denial Risk: Unable to distinguish audit favorability, exaggerating shifts to evade "unfair" verdicts risks invalidating "fair" ones, forfeiting certification; (2) Unknown Escape Boundary: Unaware of the radius, providers cannot determine the minimum falsification to "escape" assessment, rendering manipulation infeasible.
6.3 Addressing Experts' Questions
In the implementation of the protocol, experts raised two questions regarding the properties of the radius. We provide evidence-based answers using synthetic simulations with balanced binary groups and randomly sampled metric values.
Query 1: Can audit margin serve as a safety proxy? The stakeholders inquired whether models with fairness scores further from the threshold ϵ (i.e., a larger audit margin ||φ(P)| - ϵ|) effectively possess a larger consistency radius against distribution shifts.
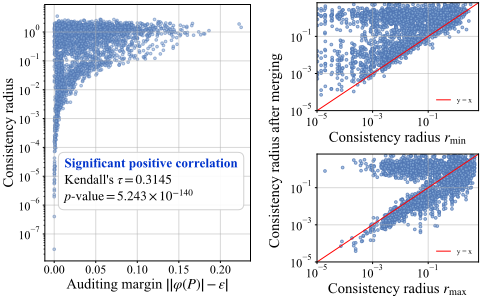
Our Response: While the margin does not deterministically quantify the maximum allowable shift (the radius), Figure 4a reveals a significant positive correlation by the Kendall
(a) Correlation with Auditing Mar-
gin ||φ(P )| - ϵ|
(b) Merged vs. rmin (upper)
and rmax (lower)
Figure 4: Properties of the Consistency Radius. (a) There is a significant positive correlation between the radius and the auditing margin. (b) Merging two datasets surpasses the smaller original radius (rmin) but not necessarily the larger (rmax).
rank test. The concentration of points in the upper-left suggests that a small margin indicates the risk of a small radius.
Expert Takeaway: The margin can be a risk indicator and prioritize precise radius estimation for high-risk evaluations.
Query 2: Does consensus guarantee larger radii? Experts inquired whether multiple audit datasets with the same conclusion (e.g., all "fair") can be combined into a more reliable audit dataset with a larger consistency radius.
Our Response: To examine this, we simulated pairwise dataset merging. For each pair of audit datasets that reached the same conclusion, we computed the radius after merging them, denoted by rmerge, and compared it with the larger and smaller radii before merging, denoted by rmax and rmin, respectively. As shown in Figure 4b, rmerge does not consistently exceed rmax. Part of the cases lie between rmin and rmax, suggesting that consensus in audit conclusions does not necessarily translate into a larger consistency radius.
Expert Takeaway: Consensus may provide useful supporting evidence, but our current analysis does not establish that merging consensus datasets guarantees a larger consistency radius. At this stage, reporting individual radii alongside merged results provides a more transparent practice.
7 Conclusion &Limitations
We addressed fairness fragility under distribution shifts by proposing the Consistency Radius. Our convex relaxation estimator enables blind auditing, bridging static evaluation and dynamic deployment without requiring sensitive user data.
There are also some limitations of our study. First, although we performed rigorous experimental evaluation, due to the inaccessibility of proprietary industrial systems, we could not further validate our method in live production environments. Second, our framework currently focuses on binary sensitive attributes and single fairness conclusions; extending it to intersectional fairness and joint certification of multiple conclusions is left for future work.
Acknowledgments
This work is funded by the Strategic Priority Research Program of the Chinese Academy of Sciences under Grant No. XDB0680201, the National Natural Science Foundation of China under Grant Nos. 62472409, 62272125.
Ethical Statement
There are no ethical issues.
@inproceedings{ijcai2026p814,
  title     = {When Can We Trust Fairness Audits? Identifying Reliability Boundaries of Third-party Audit Conclusions},
  author    = {Liu, Yuanhao and Cao, Qi and Shen, Huawei},
  booktitle = {Proceedings of the Thirty-Fifth International Joint Conference on
               Artificial Intelligence, {IJCAI-26}},
  publisher = {International Joint Conferences on Artificial Intelligence Organization},
  editor    = {Diego Calvanese},
  pages     = {7319--7327},
  year      = {2026},
  month     = {8},
  note      = {AI and Social Good},
  doi       = {10.24963/ijcai.2026/814},
  url       = {https://doi.org/10.24963/ijcai.2026/814},
}
TY - CPAPER TI - When Can We Trust Fairness Audits? Identifying Reliability Boundaries of Third-party Audit Conclusions AU - Liu, Yuanhao AU - Cao, Qi AU - Shen, Huawei T2 - Proceedings of the Thirty-Fifth International Joint Conference on Artificial Intelligence, IJCAI-26 PB - International Joint Conferences on Artificial Intelligence Organization PY - 2026 SP - 7319 EP - 7327 DO - 10.24963/ijcai.2026/814 UR - https://doi.org/10.24963/ijcai.2026/814 ER -Copied
Machine-readable versions of this paper, for tools and AI agents:





