
Clinically-Oriented Screening Model for Diabetic Retinopathy Severity Grading and Diabetic Macular Edema Detection
Proceedings of the Thirty-Fifth International Joint Conference on Artificial Intelligence. AI and Social Good. Pages 7362-7370.
https://doi.org/10.24963/ijcai.2026/819
Keywords
- Computer Vision: Computer Vision
- Multidisciplinary Topics and Applications: Multidisciplinary Topics and Applications
- Machine Learning: Machine Learning
Abstract
Diabetic retinopathy (DR) and diabetic macular edema (DME) are leading causes of preventable blindness worldwide. Automated screening tools are critical for timely detection at scale, particularly in low-resource settings where access to ophthalmologists is limited. We propose DRDME-Net, a deployment-driven joint learning framework that formulates DR grading as an ordinal regression task and DME detection via a continuous surrogate, rather than conventional classification. This design yields stable risk scores tightly aligned with operational clinical decision-making thresholds. Evaluation on facility and community cohorts demonstrates that DRDME-Net achieves strong performance across severity boundaries. Insights from an initial feasibility pilot further demonstrate its scalability in real-world workflows. These results highlight the potential of DRDME-Net to expand equitable access to timely detection, reduce preventable vision loss, and provide a practical template for integrating AI into population screening initiatives.
- [AAO Retina / Vitreous Panel, 2017] AAO Retina / Vitreous Panel. Preferred practice pattern ® guidelines: Diabetic retinopathy. San Francisco, CA: American Academy of Ophthalmology, 2017. Available at: www.aao.org/ppp. Link
- [Bogacsovics et al., 2022] Gergo Bogacsovics, Janos Toth, Andras Hajdu, and Balazs Harangi. Enhancing CNNs through the use of hand-crafted features in automated fun- dus image classification. Biomedical Signal Processing and Control, 76:103685, 2022.
- [Cao et al., 2020] Wenzhi Cao, Vahid Mirjalili, and Sebas- tian Raschka. Rank consistent ordinal regression for neu- ral networks with application to age estimation. Pattern Recognition Letters, 140:325-331, 2020.
- [Castillo Benítez et al., 2021] Veronica Elisa Castillo Benítez, Ingrid Castro Matto, Julio César Mello Román, José Luis Vázquez Noguera, Miguel García-Torres, Jordan Ayala, Diego P. Pinto-Roa, Pedro E. Gardel- Sotomayor, Jacques Facon, and Sebastian Alberto Grillo. Dataset from fundus images for the study of diabetic retinopathy. Data in Brief, 36:107068, 2021.
- [Cen et al., 2021] Ling-Ping Cen, Jianan Ji, Jing-Wei Lin, Si-Tong Chen, Hong-Juan Li, Yun Liu, Jia-Feng Yang, Yun-Fang Liu, Li Tang, Dong Liu, Yifei Wang, Dong Zhang, Ying Xin, Hong Wang, Jian Jiang, Zheng Wu, Dong Huang, Ting Sun, Bin Cai, Jie Yan, Xinyu Zhou, Lan Liu, Chen He, Shang Jin, and Yaguang Huang. Au- tomatic detection of 39 fundus diseases and conditions in retinal photographs using deep neural networks. Nature Communications, 12:4828, 2021.
- [Chalakkal et al., 2017] Renoh Johnson Chalakkal, Waleed H. Abdulla, and S. Sinumol. Comparative analysis of university of Auckland diabetic retinopathy database. In Proceedings of the 9th International Con- ference on Signal Processing Systems, ICSPS 2017, page 235-239, New York, NY, USA, 2017. Association for Computing Machinery.
- [Cuadros and Bresnick, 2009] Jorge Cuadros and S. Joseph Bresnick. EyePACS: An adaptable telemedicine system for diabetic retinopathy screening. Journal of Diabetes Science and Technology, 3(3):509-516, 2009.
- [Decencière et al., 2014] Etienne Decencière, Xiwei Zhang, Guy Cazuguel, Bruno Lay, Béatrice Cochener, Caro- line Trone, Philippe Gain, Richard Ordonez, Pascale Massin, Ali Erginay, Béatrice Charton, and Jean-Claude Klein. Feedback on a publicly distributed image database: The Messidor database. Image Analysis and Stereology, 33(3):231-234, Aug. 2014.
- [Girshick, 2015] Ross Girshick. Fast R-CNN. In 2015 IEEE International Conference on Computer Vision (ICCV), pages 1440-1448, 2015.
- [Gulshan et al., 2016] Varun Gulshan, Lily Peng, Marc Coram, Martin C. Stumpe, Derek Wu, Arunachalam Narayanaswamy, Subhashini Venugopalan, Kasumi Wid- ner, Tom Madams, Jorge Cuadros, Ramasamy Kim, Rajiv Raman, Philip C. Nelson, Jessica L. Mega, and Dale R. Webster. Development and validation of a deep learning algorithm for detection of diabetic retinopathy in retinal fundus photographs. JAMA, 316(22):2402-2410, 12 2016.
- [Hoover et al., 2000] A.D. Hoover, V. Kouznetsova, and M. Goldbaum. Locating blood vessels in retinal images by piecewise threshold probing of a matched filter response. IEEE Transactions on Medical Imaging, 19(3):203-210, 2000.
- [Huang et al., 2023] Juntao Huang, Xianhui Wu, Hongsheng Qi, Jinsan Cheng, and Taoran Zhang. Diabetic retinopa- thy detection with weighted cross-entropy loss. In 2023 42nd Chinese Control Conference (CCC), pages 8814- 8819, 2023. [International Diabetes Federation, 2025] International Dia- betes Federation. Diabetes Atlas, 12th edition. 2025.
- [Karthik and Dane, 2019] Maggie Karthik and Sohier Dane. APTOS 2019 blindness detection. https://kaggle.com/ competitions/aptos2019-blindness-detection, 2019. Kag- gle competition. Link
- [Li et al., 2019] Tao Li, Yingqi Gao, Kai Wang, Song Guo, Hanruo Liu, and Hong Kang. Diagnostic assessment of deep learning algorithms for diabetic retinopathy screen- ing. Information Sciences, 501:511 -522, 2019.
- [Li et al., 2020] Xiaomeng Li, Xiaowei Hu, Lequan Yu, Lei Zhu, Chi-Wing Fu, and Pheng-Ann Heng. CANet: Cross- disease attention network for joint diabetic retinopathy and diabetic macular edema grading. IEEE Transactions on Medical Imaging, 39(5):1483-1493, 2020.
- [Lin et al., 2020] Li Lin, Meng Li, Yijin Huang, Pujin Cheng, Honghui Xia, Kai Wang, Jin Yuan, and Xiaoy- ing Tang. The SUSTech-SYSU dataset for automated exu- date detection and diabetic retinopathy grading. Scientific Data, 7:409, 2020.
- [Liu et al., 2022] Ruhan Liu, Xiangning Wang, Qiang Wu, Ling Dai, Xi Fang, Tao Yan, Jaemin Son, Shiqi Tang, Jiang Li, Zijian Gao, Adrian Galdran, J.M. Poorneshwaran, Hao Liu, Jie Wang, Yerui Chen, Prasanna Porwal, Gavin Siew Wei Tan, Xiaokang Yang, Chao Dai, Haitao Song, Min- gang Chen, Huating Li, Weiping Jia, Dinggang Shen, Bin Sheng, and Ping Zhang. DeepDRiD: Diabetic retinopa- thy-grading and image quality estimation challenge. Pat- terns, 3(6):100512, 2022.
- [Nakayama et al., 2024a] Lucas Filipe Nakayama, Luiz Zago Ribeiro, Diego Restrepo, Nathan Santos Barboza, Raul Dias Fiterman, Maria Luiza Vieira Sousa, Alexan- dre Durão Alves Pereira, Caio Regatieri, Fernando Korn Malerbi, and Rafael Andrade. mBRSET: A mobile Brazil- ian retinal dataset (version 1.0). https://physionet.org/ content/mbrset/1.0/, 2024. Link
- [Nakayama et al., 2024b] Luis Filipe Nakayama, David Re- strepo, João Matos, Lucas Zago Ribeiro, Fernando Korn Malerbi, Leo Anthony Celi, and Caio Saito Regatieri. BRSET: A Brazilian multilabel ophthalmological dataset of retina fundus photos. PLOS Digital Health, 3(7):1-16, 07 2024.
- [Ocular Disease Intelligent Recognition, 2019] Ocular Dis- ease Intelligent Recognition. ODIR-2019: A multi- disease dataset from chinese hospitals. https://odir2019. grand-challenge.org/dataset/, 2019. Accessed 2025. Link
- [Porwal et al., 2018] Prasanna Porwal, Samiksha Pachade, Ravi Kamble, Manesh Kokare, Girish Deshmukh, Vivek Sahasrabuddhe, and Fabrice Meriaudeau. Indian diabetic retinopathy image dataset (IDRiD), 2018.
- [Rom et al., 2022] Yovel Rom, Rachelle Aviv, Tsontcho Ianchulev, and Zack Dvey-Aharon. Predicting the future development of diabetic retinopathy using a deep learning algorithm for the analysis of non-invasive retinal imaging. BMJ Open Ophthalmology, 7:e001140, 2022.
- [Savoy, 2020] M. Savoy. IDx-DR for diabetic retinopathy screening. American Family Physician, 101(5):307-308, 2020.
- [Shi et al., 2023] Xintong Shi, Wenzhi Cao, and Sebastian Raschka. Deep neural networks for rank-consistent ordi- nal regression based on conditional probabilities. Pattern Analysis and Applications, 26:941-955, 2023.
- [Silva-Rodríguez et al., 2025] Julio Silva-Rodríguez, Hadi Chakor, Riadh Kobbi, Jose Dolz, and Ismail Ben Ayed. A foundation language-image model of the retina (FLAIR): encoding expert knowledge in text supervision. Medical Image Analysis, 99:103357, 2025.
- [Souza et al., 2012] Neilsen De Souza, Yu Cui, Stephanie Looi, Prakash Paudel, Lakshmi Shinde, Krishna Kumar, Rajbir Berwal, Rajesh Wadhwa, Vinod Daniel, Judith Flanagan, and Brien Holden. The role of optometrists in India: An integral part of an eye health team. Indian Jour- nal of Ophthalmology, 60(5):401-405, September 2012.
- [Takahashi et al., 2017] Hidenori Takahashi, Hironobu Tampo, Yusuke Arai, Yuji Inoue, and Hidetoshi Kawashima. Applying artificial intelligence to dis- ease staging: Deep learning for improved staging of diabetic retinopathy. PLoS ONE, 12(6):e0179790, 2017.
- [Tan et al., 2017] Gavin S Tan, Ning Cheung, Rafael Simó, Gemmy C M Cheung, and Tien Yin Wong. Diabetic macular oedema. The Lancet Diabetes & Endocrinology, 5(2):143-155, 2017.
- [Teo et al., 2021] Zhen Ling Teo, Yih-Chung Tham, Marco Yu, Miao Li Chee, Tyler Hyungtaek Rim, Ning Che- ung, Mukharram M. Bikbov, Ya Xing Wang, Yating Tang, Yi Lu, Ian Y. Wong, Daniel Shu Wei Ting, Gavin Siew Wei Tan, Jost B. Jonas, Charumathi Sabanayagam, Tien Yin Wong, and Ching-Yu Cheng. Global prevalence of dia- betic retinopathy and projection of burden through 2045: Systematic review and meta-analysis. Ophthalmology, 128(11):1580-1591, 2021.
- [Umar et al., 2024] M. D. U. Umar, F. M. Muhammad, U. A. I. Isah, M. A. Adisa, R. O. O. Owolabi, and A. A. M. Musa. Addressing Africa's high rate of blindness: The ur- gent need for ophthalmologists. Journal of Health Reports and Technology, 10(3):e144801, 2024.
- [Vargas et al., 2020] Víctor Manuel Vargas, Pedro Antonio Gutiérrez, and César Hervás-Martínez. Cumulative link models for deep ordinal classification. Neurocomputing, 401:48-58, 2020.
- [Vijayan and Venkatakrishnan, 2023] Midhula Vijayan and S. Venkatakrishnan. A regression-based approach to di- abetic retinopathy diagnosis using EfficientNet. Diagnos- tics, 13(4), 2023.
- [Vought et al., 2023] R. Vought, V. Vought, M. Shah, B. Szirth, and N. Bhagat. EyeArt artificial intelligence analysis of diabetic retinopathy in retinal screening events. International Ophthalmology, 43(12):4851-4859, 2023.
- [Wilkinson et al., 2003] Chris P. Wilkinson, Frederick L. Ferris III, Ronald E. Klein, and et al. Proposed international clinical diabetic retinopathy and diabetic macular edema disease severity scales. Ophthalmology, 110(9):1677-1682, September 2003.
- [World Health Organization, 2007] World Health Organiza- tion. VISION 2020: The Right to Sight: Global initiative for the elimination of avoidable blindness: action plan 2006-2011. World Health Organization, Geneva, 2007. Human resource development section.
- [Zhou et al., 2023] Yukun Zhou, Mark A Chia, Siegfried K Wagner, Murat S Ayhan, Dominic J Williamson, Rob- bert R Struyven, Timing Liu, Moucheng Xu, Mateo G Lozano, Peter Woodward-Court, et al. A foundation model for generalizable disease detection from retinal images. Nature, 622(7981):156-163, 2023.
References were extracted automatically from the PDF and may contain errors.
Full text extracted automatically from the PDF; figures, tables and equations may differ. The PDF is the version of record.
1 Introduction
Diabetic retinopathy (DR) and diabetic macular edema (DME) are microvascular complications of diabetes, posing a major global health challenge due to its potential to cause irreversible vision loss and blindness. Estimates show that the global population with diabetes will grow from about 589 million in 2024 to 853 million by 2050 [International Diabetes Federation, 2025]. Among people with diabetes, an estimated 23% have DR, with about 6.2% having visionthreatening DR (VTDR) and 4.1% having DME. The burden is especially high in low- and middle-income countries (LMICs) [Teo et al., 2021]. Because DR and DME progress silently, timely screening and treatment are critical.
The growing disease burden has widened the gap between the number of patients requiring regular eye screenings and trained specialist ophthalmologists who are unavailable in low-resource settings. Against the WHO recommendation of one ophthalmologist per 50,000 people [World Health Organization, 2007], Africa has an estimated three ophthalmologists per million people, compared to more than 50 per million in high-income countries [Umar et al., 2024]. In India, a country where 70% of the population lives in rural areas, the ophthalmologist-to-population ratio in urban areas is approximately 1:25,000, while in rural areas, it plummets to nearly 1:219,000 [Souza et al., 2012]. Geographic, economic, and workforce constraints coupled with a lack of awareness further limit access to timely eye care, underscoring the need for scalable and affordable screening solutions.
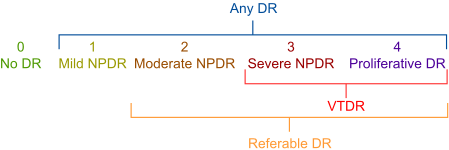
DR threatens overall retinal integrity and visual function, and progresses through a series of 4 clinically defined stages, defined by the International Clinical DR and DME (ICDRDME) Severity Scale [Wilkinson et al., 2003] as shown in Figure 1. The initial stage is non-proliferative diabetic retinopathy (NPDR) and the most advanced stage is proliferative diabetic retinopathy (PDR). Together with the absence of retinopathy (No DR), these stages form the five diagnostic grades used in this study. DME is a distinct but frequently cooccurring condition that affects the part of the retina responsible for sharp, central vision. Effective screening systems must therefore assess both DR severity and the presence of DME to support appropriate referral and treatment decisions.
Our goal is to develop a population-level screening solution that delivers clinically actionable predictions in lowresource settings lacking specialist ophthalmologists, facilitating timely detection and referral. Towards this, we introduce DRDME-Net, a unified deployment-driven framework that formulates DR and DME as ordinal regression tasks. Rather than independent classification, this approach captures the graded continuum of DR severity, while treating DME as an ordered risk prediction via a continuous surrogate to ensure stable thresholding. To overcome the fact that public datasets rarely contain annotations for both conditions simultaneously, we design a transfer learning multi-task framework that leverages partially labeled datasets, enabling effective training without wasting valuable labels. To systematically assess performance across clinically relevant boundaries, we introduce GM@B (geometric mean of sensitivity and specificity across DR grade boundaries), exposing critical clinical decision risks often hidden by global metrics. Finally, evaluating on real-world facility and community cohorts, we demonstrate that DRDME-Net matches or outperforms massive foundation models, proving that architectural efficiency, rather than sheer scale, is the key technical insight for robust screening and equitable AI deployment. This work was developed through multidisciplinary collaboration, with clinicians guiding labeling and evaluation, machine learning researchers conceiving and developing the models, and stakeholders informing deployment and ethical considerations.
By enabling cost-effective, scalable screening for DR and DME in settings with limited specialist access, this work directly advances SDG 3 (Good Health and Well-being) and supports universal health coverage. By extending screening to underserved and rural populations, it contributes to SDG 10 (Reduced Inequalities). Preventing avoidable vision loss further supports SDG 1 (No Poverty) and SDG 8 (Decent Work and Economic Growth) by preserving productivity and livelihoods. Finally, the use of AI-driven digital health infrastructure within public screening programs aligns with SDG 9 (Industry, Innovation and Infrastructure). Collectively, this work operationalizes the "Leave No One Behind" principle by prioritizing equitable access to vision-saving care.
2 RelatedWork
The journey toward automated DR and DME grading began with traditional machine learning methods that predated the deep learning era. These approaches were based on multistage pipelines that involved extensive image preprocessing, followed by hand-crafted feature extraction and subsequent classification [Bogacsovics et al., 2022]. While these methods were foundational and showed promising results, their performance was heavily dependent on the quality of the hand-crafted features. This process required substantial domain expertise from engineers and often struggled with the high variability and subtle nature of early-stage DR lesions, which can be difficult to define programmatically. The lack of robustness to variations in image quality, camera type, and patient population limited their generalization capabilities, paving the way for a new paradigm.
The introduction of deep learning improved diagnostic accuracy and eliminated the need for a separate feature extraction step, leading to a streamlined and effective automated screening process. A convolutional neural network (CNN) trained on ∼130,000 fundus images could detect "referable DR" (defined as Moderate NPDR or worse) on par with human graders in DR screening, suggesting viability for resource-limited settings [Gulshan et al., 2016]. However, many such systems focus on binary referral decisions, which lack the granularity required for effective patient management. Grading across all DR severity levels, alongside reliable DME detection, remains clinically important [AAO Retina / Vitreous Panel, 2017].
Recent work has adopted ordinal approaches (treating DR grade as a continuous score [Vijayan and Venkatakrishnan, 2023]). We build on this to jointly predict DME, providing integrated multi-disease screening. Further, we evaluate boundary-level performance rather than only global metrics like accuracy or kappa, allowing more clinically meaningful assessment of severe DR cases while validating our approach on real-world data, rather than solely on open-source datasets, demonstrating practical utility. Multi-task networks to jointly predict DR and DME are relatively rare. However, CANet [Li et al., 2020] represents a leading task-specific model. While it employs dual attention modules for DR and DME prediction, our approach uses a shared backbone with a lightweight linear head, offering a simpler and more computationally efficient design. Despite its simplicity, we show that DRDMENet achieves robust ordinally consistent predictions across DR grades and DME, and is well-suited for low-resource deployment, including on smartphone-based screening systems.
Recently, large retinal foundation models such as FLAIR [Silva-Rodr´ıguez et al., 2025] and RETFound [Zhou et al., 2023] have been proposed for multiple ophthalmic tasks. However, their size and computational demands limit practicality in low-resource screening environments. Because most standard baselines cannot jointly predict both diseases, comparing against CANet and these state-of-the-art foundation models provides a rigorous benchmark to assess the performance-efficiency trade-offs of our approach.
Finally, FDA-approved commercial systems such as EyeArt [Vought et al., 2023], IDx-DR [Savoy, 2020], and AEYE [Rom et al., 2022] have validated the feasibility of automated DR screening. But their deployment in LMICs is inhibited by cost, camera dependence, limited DR severity grading, and incomplete DME assessment. Our work complements these efforts by focusing on severity-aware, cameraagnostic screening validated in facility and community settings under realistic operational constraints.
3 Methods
Let D = {(xi, yi,mi, ai)}Ni=1 denote the training dataset of N images, where xi ∈ RH×W×3 is a retinal fundus image with height H, width W, and three color channels (RGB), yi ∈ {0, 1, . . . ,K - 1} is the corresponding DR severity grade with K denoting the number of ordinal categories, mi ∈ {0, 1} indicates the presence of DME, and ai ∈ {0, 1} indicates whether the DME annotation is available for xi.
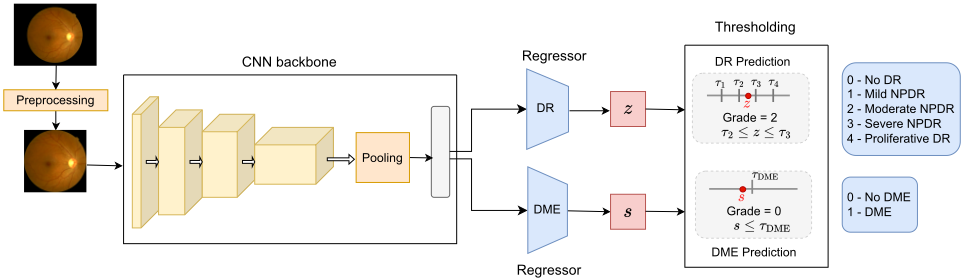
We learn a function fθ : RH×W×3 -→ R2 , fθ(xi) = (zi, si), parameterized by θ, that maps an input image xi to scalar logits zi, si ∈ R for DR ordinal regression and DME detection respectively. The function fθ consists of a CNN backbone that outputs a spatial feature map Φ(xi) ∈ Rh′×w′×d , where h′ ,w′ are reduced spatial dimensions and d is the feature depth. A pooling operator P(·) aggregates Φ(xi) into a feature vector ϕ(xi) = P(Φ(xi)) ∈ Rd , which is then passed through two independent linear layers: zi = w⊤ϕ(xi) + b and si = v⊤ϕ(xi) + c where w, v ∈ Rd and b, c ∈ R are learnable parameters.
We employ the Smooth L1 loss [Girshick, 2015], defined for a prediction p and target t as:
where β > 0 controls the transition point between quadratic and linear penalization. This formulation captures the ordinal nature of DR severity while being less sensitive to outliers, which can be interpreted as mislabeled or ambiguous samples whose features do not perfectly align with their assigned hard label, than mean squared error. We also employ the Smooth L1 loss for DME rather than the conventional binary crossentropy. While the binary label of "DME present / absent" guides clinical referral [Tan et al., 2017], treating this as a regression problem is a practical engineering regularization strategy. Binary cross-entropy encourages class separation and can yield overconfident, threshold-sensitive predictions. In contrast, a continuous surrogate score maps fundus images to an ordered risk continuum rather than as unrelated classes. This smoother score distribution can improve calibration near decision boundaries and support stable tuning of operational thresholds across diverse deployment settings.
We define LDR = SmoothL1(zi, yi) for DR severity grading. Since DME annotations are not available for all images, we employ an annotation-aware masking strategy for DME detection. Specifically, the DME loss is defined as LDME = ai · SmoothL1(si,mi), such that only samples with available DME annotations (ai = 1) contribute to the DME loss, while unannotated samples (ai = 0) are ignored. The overall multi-task objective is defined as:
where λDR and λDME are scalar hyperparameters that control the relative contribution of DR severity grading and the DME prediction, respectively.
At inference time, the continuous scalar prediction zi is discretized into clinically aligned DR grades using a set of monotonically increasing thresholds {τ1, τ2, . . . , τK-1}:
The continuous prediction si is converted into a binary decision using a tunable threshold τDME to enable referrals:
Here, ˆ yi and ˆmi denote the predicted DR grade and DME status, respectively, for the input image xi. Figure 2 illustrates the overall approach.
4 Experiments
4.1 Setup
Datasets. We aggregate 91,622 retinal fundus images from 15 publicly available datasets for training as shown in Table 1. All images are stored as three-channel RGB fundus photographs. Each dataset is split into training (90%) and validation (10%) subsets, stratified to preserve the distribution of DR severity grades. For external evaluation, we use 4,704 images as unseen test sets sourced and annotated at AIIMS Delhi. This dataset captures a diverse national demographic, reflecting true real-world low-resource screening conditions comprising a facility-based cohort and 19 community vision centres acting as regional nodal hubs. Following the ICDRDME scale and to align with clinical screening practice, two annotators independently assigned a DR grade on a 0-4 scale (Figure 1) and indicated the presence of DME for each retinal fundus image. Disagreements were reviewed by an adjudicator. 23,410 images across 4 public datasets have the presence or absence of DME annotated, while all of the images in the evaluation dataset have DME annotated.
ImplementationDetails. The aggregated datasets are from heterogeneous sources and imaging devices, resulting in varying resolutions and aspect ratios. We preprocess each image by cropping black borders, padding the shorter dimension to enforce a 1:1 aspect ratio, and resizing to 512×512×3. All images are then z-score normalized using the mean and standard deviation of the training set. To improve generalization, we apply standard augmentations while training, including horizontal/vertical flips and random adjustments of brightness and contrast. The CNN backbone is EfficientNetV2-S (ENV2-S), initialized with ImageNet (IN) pretrained weights.
| Dataset | Images | DR Grade | DME | ||||
|---|---|---|---|---|---|---|---|
| 0 | 1 | 2 | 3 | 4 | Yes | ||
| Training Datasets (Public) | |||||||
| EyePACS [2009] | 35126 | 25810 | 2443 | 5292 | 873 | 708 | × |
| APTOS [2019] | 3534 | 1796 | 344 | 932 | 184 | 278 | × |
| ODIR [2019] | 4179 | 2816 | 460 | 745 | 144 | 14 | × |
| DDR [2019] | 12522 | 6266 | 630 | 4477 | 236 | 913 | × |
| IDRiD [2018] | 516 | 168 | 25 | 168 | 93 | 62 | 294 |
| DeepDRiD [2022] | 806 | 243 | 161 | 162 | 160 | 80 | × |
| Messidor-2 [2014] | 1744 | 1017 | 270 | 347 | 75 | 35 | 151 |
| Jichi [2017] | 9939 | 6561 | 0 | 2113 | 460 | 805 | × |
| SUSTech-SYSU [2020] | 1151 | 631 | 24 | 365 | 73 | 58 | × |
| UoA-DR [2017] | 30 | 0 | 0 | 0 | 0 | 30 | × |
| STARE [2000] | 15 | 0 | 0 | 0 | 0 | 15 | × |
| UNA, Paraguay [2021] | 751 | 187 | 4 | 80 | 280 | 200 | × |
| 1000x39 [2021] | 159 | 38 | 18 | 49 | 39 | 15 | × |
| BRSET [2024b] | 16266 | 15183 | 158 | 451 | 78 | 396 | 401 |
| mBRSET [2024a] | 4884 | 3750 | 272 | 568 | 82 | 212 | 423 |
| Subtotal (Training) | 91622 | 64466 | 4809 | 15749 | 2777 | 3821 | 1269 |
| Evaluation Datasets (Proprietary) | |||||||
|---|---|---|---|---|---|---|---|
| Facility cohort | 3568 | 1372 | 117 | 1243 | 162 | 674 | 1517 |
| Community cohort | 1136 | 753 | 131 | 200 | 7 | 45 | 193 |
| Subtotal (Evaluation) | 4704 | 2125 | 248 | 1443 | 169 | 719 | 1710 |
The network is trained in a multi-task setting using a weighted sum of Smooth L1 losses (β = 1) for the DR and DME heads, with task weights λDR = 1.5 and λDME = 0.5. Optimization is performed using AdamW for 100 epochs with an initial learning rate of 10-4 , reduced by a factor of 10 every 10 epochs via StepLR scheduling. The DR thresholds were set as τ1 = 0.5, τ2 = 1.5, τ3 = 2.5, τ4 = 3.5, while the DME decision threshold may be tuned on the validation set to maximize the Youden index. All experiments were conducted on one Tesla V100 GPU with 32 GB of memory.
Evaluation Metrics. For DR severity grading, we report the Quadratic-weighted Cohen's Kappa (QK), which penalizes larger disagreements more heavily and is well aligned with the ordinal nature of DR. While prior work on DR grading has primarily reported global metrics such as accuracy or QK, these aggregate measures can obscure clinically critical weaknesses at specific severity boundaries. We therefore introduce GM@B, the geometric mean of sensitivity (SN) and specificity (SP) at each DR grade boundary, defined as GM@B = √SN@B · SP@B, where a boundary B ∈ {1, 2, 3, 4} defines the positive class as y ≥ B. GM@B highlights whether a model maintains balanced performance at the clinically relevant decision thresholds, which is crucial for screening deployment. For DME detection, we report the area under the receiver operating characteristic curve (AUC) and the precision-recall curve (AUPR). 95% confidence intervals (CI) were estimated using the percentile bootstrap method with 1000 resamples. All metrics are reported as percentages. Since the proposed system is intended for population-level screening, we emphasize a holistic interpretation of metrics rather than prioritizing a single number, to ensure both reliability and clinical safety.
4.2 Ablation Studies
We conduct ablation studies to examine key modeling choices with the goal of identifying configurations that are robust, stable, and suitable for deployment in low-resource screening environments. Rather than optimizing for marginal gains in aggregate metrics, we focus on performance trade-offs and boundary-specific reliability at clinically relevant operating points, reflecting practical constraints in population-level screening where simplicity and consistency often outweigh small improvements in performance.
Loss Functions
We explore several alternatives to the Smooth L1 formulation (Section 3). Unless stated otherwise, all models share the same backbone, optimizer, and training schedule, with fixed DR discretization thresholds to isolate the effect of the loss. To address class imbalance, we evaluate a class-weighted Smooth L1 variant, where class weights are inversely proportional to their frequencies in the training set, and vary the transition parameter β to examine sensitivity to the quadraticlinear trade-off. We additionally include MSE and L1 losses as regression baselines.
Our primary formulation treats DR grading as an ordinal regression problem, which explicitly accounts for the inherent ordering among severity grades. To assess the impact of this choice, we experiment with the conventional K class classification formulation (K = 5 for DR), optimized with cross-entropy (CE) [Huang et al., 2023], which treats grades as independent categories and ignores ordinal structure. For instance, misclassifying Severe NPDR as PDR is penalized equally to misclassification as No DR, despite the former being clinically much closer. We additionally tested focal loss and ordinal-specific losses such as CORAL [Cao et al., 2020] and CORN [Shi et al., 2023].
Results in Table 2 show that differences in mean QK across loss functions are modest, with some CIs overlapping, indicating that global DR grading performance is relatively insensitive to the specific loss choice. However, boundaryspecific metrics reveal clearer distinctions. Regression-based losses, particularly Smooth L1 variants, exhibit more consistent GM@B performance across clinically relevant severity thresholds, whereas classification-based objectives such as CE and focal loss show increased variability, especially at higher-grade boundaries. For DME detection, all losses achieve high AUC, but AUPR varies substantially, reflecting differences in precision under class imbalance. Overall, class-weighted Smooth L1 offers a favorable balance between stable DR boundary performance and robust DME detection. Given the intended deployment in screening settings where reliability across severity thresholds is critical, we subsequently adopt this configuration, referred as DRDME-Net.
| Loss Function | DR Severity | DME Detection | |||||
|---|---|---|---|---|---|---|---|
| QK | GM@1 | GM@2 | GM@3 | GM@4 | AUC | AUPR | |
| Cross entropy (CE) Class-weighted CE | 86.8 (85.7-87.9) | 88.3 (87.3-89.1) | 90.3 (89.5-91.2) 91.4 (90.6-92.2) | 87.0 (85.1-88.8) 90.8 (89.2-92.2) | 90.7 (88.5-92.6) 93.1 (91.2-94.7) | 99.3 (98.6-99.6) | 92.0 (88.0-95.3) |
| 88.5 (87.6-89.5) | 91.2 (90.5-91.8) | 98.8 (96.8-99.7) | 91.5 (87.0-95.3) | ||||
| Focal (γ=1) | 86.4 (85.3-87.4) | 89.8 (88.9-90.5) | 90.3 (89.4-91.1) | 89.4 (87.9-91.0) | 89.5 (87.2-91.4) | 99.3 (98.6-99.7) | 93.1 (89.5-95.9) |
| CORAL [2020] | 89.0 (88.1-89.8) | 90.3 (89.4-90.9) | 91.7 (90.8-92.4) | 84.8 (82.8-86.7) | 90.4 (88.2-92.4) | 99.3 (98.4-99.6) | 92.1 (88.0-95.2) |
| CORN [2023] | 89.6 (88.6-90.4) | 91.3 (90.5-91.9) | 92.1 (91.3-92.8) | 87.6 (85.9-89.4) | 89.3 (87.1-91.4) | 98.9 (97.2-99.7) | 93.1 (89.6-96.0) |
| L1 | 88.7 (87.8-89.6) | 91.3 (90.6-91.9) | 91.0 (90.1-91.8) | 90.5 (88.8-91.9) | 89.8 (87.5-91.9) | 98.2 (96.4-99.2) | 79.4 (70.6-87.8) |
| MSE | 89.3 (88.5-90.1) | 90.8 (90.0-91.3) | 90.3 (89.3-91.1) | 92.0 (90.5-93.3) | 90.7 (88.7-92.6) | 99.4 (99.0-99.6) | 89.9 (83.9-94.7) |
| Smooth L1 (β=1) | 90.1 (89.2-90.9) | 91.0 (90.2-91.7) | 91.2 (90.3-92.0) | 88.8 (87.0-90.4) | 89.5 (87.2-91.6) | 99.5 (99.1-99.6) | 91.7 (87.5-95.0) |
| Class-weighted Smooth L1 (DRDME-Net) | 89.4 (88.5-90.2) | 91.2 (90.4-91.8) | 91.1 (90.2-91.9) | 90.8 (89.2-92.2) | 90.1 (87.9-92.2) | 99.5 (99.1-99.7) | 92.3 (88.0-95.8) |
DR Thresholds
The choice of thresholds {τ1, . . . , τK-1} used to discretize continuous DR predictions is critical, since they directly govern the balance between sensitivity and specificity at each disease severity boundary. We first consider the simplest option of using fixed, evenly spaced thresholds. An alternative strategy is to tune these thresholds post-training on the validation set to optimize the evaluation metric QK. This approach can yield marginal performance improvements but risks overfitting to the validation distribution and may not generalize well to external datasets. A more principled alternative is to learn thresholds jointly with the model. Cumulative link models (CLMs) [Vargas et al., 2020] provide such a framework wherein the network produces a latent continuous score, while the thresholds defining the grade boundaries are treated as learnable parameters. Different link functions can be used to model the probability of each ordinal category. This removes the need for heuristic post-hoc tuning and allows the model to adapt its decision boundaries during training.
Results in Table 3 show that tuned thresholds for QK performs similarly to fixed thresholds, indicating that our model is relatively insensitive to small shifts in boundary placement.
CLM variants, while able to jointly estimate thresholds, consistently yield lower QK and struggle particularly at boundary 3 (Moderate NPDR vs. VTDR). Interestingly, GM@B highlights these deficiencies more clearly than QK alone, underscoring the value of evaluating per-boundary trade-offs. Overall, threshold choice does influence fine-grained calibration, but fixed empirical thresholds remain a simple and reliable default for regression-based DR grading.
Alternative Training Strategies
Finally, we compare DRDME-Net against alternative training strategies, including single-task models trained independently, and a sequential transfer learning approach in which a DR-trained backbone is frozen and adapted for DME.
As summarized in Table 4, the single-task DR model achieves marginally higher QK and GM@B values than the joint formulation, but at the cost of losing DME capability. The sequential approach preserves DR performance but shows a marked degradation in DME detection, particularly in AUPR, indicating limited transfer when the backbone is frozen. In contrast, our jointly trained model (DRDME-Net) delivers balanced performance across both tasks within a single architecture. Given the overlapping CIs and the substantial reduction in deployment complexity, the joint formulation offers a favorable trade-off between performance and practicality for low-resource screening environments.
| Metric | DRDME-Net | Tuned QK | CLM-logit | CLM-probit | CLM-loglog | CLM-cloglog | CLM-cauchit |
|---|---|---|---|---|---|---|---|
| DR Severity | |||||||
| Thresholds | {0.5, 1.5, 2.5, 3.5} | {0.73, 1.55, 2.53, 3.59} | {0.31, 1.26, 4.56, 6.12} | {0.31, 0.83, 2.99, 3.90} | {0.31, 0.99, 3.47, 4.49} | {0.31, 0.75, 2.74, 3.65} | {0.30, 1.35, 4.50, 6.29} |
| QK | 89.4 (88.5-90.2) | 89.8 (88.9-90.6) | 87.9 (86.9-88.8) | 87.6 (86.6-88.5) | 87.3 (86.4-88.2) | 87.3 (86.3-88.1) | 87.5 (86.4-88.4) |
| GM@1 | 91.2 (90.4-91.8) | 91.3 (90.5-91.9) | 88.9 (88.0-89.7) | 88.7 (87.9-89.5) | 89.6 (88.7-90.3) | 88.6 (87.7-89.4) | 88.0 (87.1-88.9) |
| GM@2 | 91.1 (90.2-91.9) | 90.8 (89.9-91.7) | 91.9 (91.2-92.7) | 92.0 (91.3-92.7) | 91.9 (91.2-92.6) | 92.1 (91.4-92.8) | 92.0 (91.2-92.7) |
| GM@3 | 90.8 (89.2-92.2) | 90.6 (89.1-92.1) | 80.8 (78.5-83.0) | 77.6 (75.2-80.0) | 76.2 (73.9-78.6) | 77.5 (75.3-79.9) | 84.3 (82.4-86.4) |
| GM@4 | 90.1 (87.9-92.2) | 89.6 (87.3-91.8) | 90.3 (88.2-92.4) | 90.5 (88.4-92.4) | 87.2 (85.1-89.5) | 92.6 (90.8-94.2) | 88.3 (86.0-90.5) |
| DME Detection | |||||||
| AUC | 99.5 (99.1-99.7) | 99.5 (99.1-99.7) | 99.5 (99.1-99.8) | 99.3 (98.6-99.7) | 99.0 (97.8-99.7) | 99.4 (98.9-99.7) | 98.9 (97.4-99.6) |
| AUPR | 92.3 (88.0-95.8) | 92.3 (88.0-95.8) | 94.4 (91.4-96.9) | 92.8 (89.1-95.9) | 92.9 (89.4-95.7) | 93.0 (89.2-95.9) | 92.7 (89.0-95.6) |
| Approach | DR Severity | DME Detection | |||||
|---|---|---|---|---|---|---|---|
| QK | GM@1 | GM@2 | GM@3 | GM@4 | AUC | AUPR | |
| DRDME-Net | 89.4 (88.5-90.2) | 91.2 (90.4-91.8) | 91.1 (90.2-91.9) | 90.8 (89.2-92.2) | 90.1 (87.9-92.2) | 99.5 (99.1-99.7) | 92.3 (88.0-95.8) |
| DR only | 90.1 (89.2-90.9) | 91.6 (90.9-92.2) | 91.5 (90.7-92.3) | 91.8 (90.3-93.1) | 90.6 (88.3-92.5) | × | × |
| DME only | × | × | × | × | × | 99.4 (99.0-99.6) | 91.2 (87.4-94.6) |
| Sequential | 90.1 (89.2-90.9) | 91.6 (90.9-92.2) | 91.5 (90.7-92.3) | 91.8 (90.3-93.1) | 90.6 (88.3-92.5) | 97.7 (97.0-98.3) | 68.9 (59.9-77.0) |
4.3 Results Summary
Baselines. To contextualize our results, we compare DRDME-Net against a set of simple baselines (Table 5). Na¨ıve strategies such as predicting the median grade or prevalence-weighted random sampling from the label distribution yield near-zero QK, highlighting the difficulty of the task. Shallow 3-layer CNNs (3 × 3 kernels and ReLU, using 16, 32, and 64 channels respectively, with 2 × 2 maxpooling for the first two layers, followed by global average pooling and a linear layer) achieve only marginal improvements, struggling to capture the fine-grained retinal features needed for reliable grading. Even with a strong CNN backbone, performance remains limited under frozen IN features or default random initialization, emphasizing the importance of domain-specific transfer learning and tailored loss formulations. By contrast, DRDME-Net achieves a substantial gain in both QK and GM@B, underscoring the value of our ordinal regression framework for clinically meaningful DR severity prediction. For DME detection, these baselines similarly underperform, while DRDME-Net achieves strong discrimination, consistent with its joint training objective.
Evaluation and Benchmarking. We evaluate our bestperforming model DRDME-Net on both the facility and community test sets (Table 1) representing distinct clinical settings. Because most standard baselines do not support joint prediction, we benchmark against a sufficient set of state-ofthe-art paradigms: CANet [2020] reimplemented and trained on our data, alongside foundation models FLAIR [2025]
| Approach | DR Severity | DME | |
|---|---|---|---|
| QK | GM@B | AUC / AUPR | |
| Median predictor | 0 | {0, 0, 0, 0} | 50.0 / 5.1 |
| Random (weighted) | 0 | {45.1, 41.8, 25.5, 24.0} | 52.4/5.5 |
| 3-layer CNN (ordinal) | 29.7 | {50.0, 60.9, 33.7, 8.8} | 80.5/34.9 |
| ENV2-S (frozen IN) | 37.1 | {60.6, 64, 63.9, 50.6} | 59.8/7.4 |
| ENV2-S (default init) | 24.5 | {46.5, 55.9, 27.6, 7.2} | 74.6/26.1 |
| DRDME-Net | 89.4 | {91.2, 91.1, 90.8, 90.1} | 99.5/92.3 |
(zero-shot) and RETFound [2023] (finetuned on our dataset).
As shown in Table 6, DRDME-Net achieves consistently strong DR severity agreement and stable boundary-specific performance, while maintaining high DME detection performance across both cohorts. In facility settings, DRDME-Net performs competitively against other models in terms of QK and GM@B, despite being substantially smaller. Foundation models such as FLAIR and RETFound exhibit competitive performance at certain boundaries, but show greater variability. In the more challenging community cohort, which reflects real-world screening conditions, DRDME-Net upholds its robustness, with less degradation in DR grading performance.
Table 7 further shows that DRDME-Net maintains consistent performance across camera types and sex, suggesting robustness to image acquisition devices and demographic factors commonly encountered in screening programs. Finally, Table 8 highlights that these gains require a significantly lower computational and memory footprint than foundationmodels. Notably, trainingDRDME-Net takes less than 1 GPU-day on a single Tesla V100, ensuring highly accessible reproducibility. Together, these results underscore the suitability of DRDME-Net as the backbone of a real-world screening system capable of population-scale deployment.
5 Learnings fromPilot
DRDME-Net has been piloted as part of an initial feasibility study yielding several practical insights. While the model generalizes well across both facility and community cohorts, broader validation across diverse populations, disease prevalences, and imaging protocols remains important. As with most clinical AI systems, reliance on human-annotated labels introduces noise and limits the capture of subtle or emerging phenotypes. The current pilot operates on single-image inputs, whereas clinical diagnosis often integrates multi-field or longitudinal information. Although temporal data are available within our application, incorporating multi-view or multi-timepoint signals would increase complexity and may be less compatible with high-throughput screening workflows. In practice, threshold-based referral strategies remain clinically oriented and operationally viable, but require periodic recalibration as guidelines evolve.
From an operational standpoint, input validation is handled through a two-stage pipeline consisting of a lightweight MobileNet-based classifier followed by Mahalanobis distance-based out-of-distribution detection to mitigate misuse. The system does not explicitly model image gradability (such as image being too blurry to grade or missing anatomical features) yet, instead relying on operator training and point-of-capture quality checks. Future iterations would benefit from automated image quality assessment to flag ungradable cases and prompt repeat acquisition.
| Model | DR Severity | DME Detection | |||||
|---|---|---|---|---|---|---|---|
| QK | GM@1 | GM@2 | GM@3 | GM@4 | AUC | AUPR | |
| Facility cohort | |||||||
| DRDME-Net | 90.5 (89.5-91.4) | 96.0 (95.2-96.6) | 92.4 (91.5-93.1) | 87.8 (86.5-88.9) | 90.3 (88.6-91.7) | 96.2 (95.6-96.7) | 94.0 (92.8-95.0) |
| CANet | 84.9 (83.4-86.3) | 96.4 (95.7-96.9) | 92.0 (91.0-92.8) | 83.3 (81.5-84.7) | 82.5 (80.4-84.2) | 96.7 (96.2-97.1) | 94.8 (93.7-95.7) |
| FLAIR | 86.2 (85.0-87.3) | 83.9 (82.4-85.3) | 93.9 (93.1-94.6) | 86.2 (85.0-87.4) | 84.9 (83.1-86.7) | 91.0 (90.1-91.9) | 84.8 (82.8-86.6) |
| RETFound | 85.8 (84.6-86.9) | 90.8 (89.6-91.8) | 92.9 (92.0-93.7) | 84.3 (82.8-85.6) | 81.2 (78.9-82.9) | 95.9 (95.2-96.6) | 93.8 (92.4-95.1) |
| Community cohort | |||||||
| DRDME-Net | 84.6 (82.0-87.1) | 88.4 (86.6-89.9) | 93.2 (91.7-94.6) | 89.2 (83.3-94.4) | 85.5 (77.0-92.3) | 98.9 (98.5-99.3) | 94.8 (92.5-96.7) |
| CANet | 79.8 (75.9-83.4) | 91.8 (90.0-93.4) | 89.6 (87.8-91.2) | 77.6 (68.2-85.4) | 74.3 (63.9-82.9) | 98.0 (97.3-98.6) | 92.3 (89.5-94.5) |
| FLAIR | 77.3 (73.7-80.6) | 88.3 (86.0-90.3) | 93.2 (91.5-94.8) | 92.9 (91.8-94.0) | 93.0 (88.6-96.1) | 94.2 (92.8-95.4) | 70.1 (62.8-76.6) |
| RETFound | 80.9 (77.8-83.7) | 83.9 (81.6-85.8) | 93.2 (91.6-94.7) | 89.4 (83.7-93.6) | 82.6 (74.0-90.4) | 97.5 (95.7-98.8) | 93.5 (90.8-95.7) |
| Images | DR Severity | DME | ||
|---|---|---|---|---|
| QK | GM@B | AUC / AUPR | ||
| Camera Type | ||||
| Zeiss FF450+ | 2640 | 88.2 | {96.1, 91.5, 85.8, 89.9} | 94.4 / 93.3 |
| Remidio FOP | 1700 | 89.4 | {91.1, 94.7, 92.0, 88.5} | 99.0 / 96.2 |
| Forus 3nethra | 364 | 88.4 | {93.7, 98.7, 94.1, 94.0} | 99.5 / 94.1 |
| Sex Stratified | ||||
| Male | 1504 | 90.5 | {92.3, 91.4, 91.4, 89.9} | 97.9 / 96.0 |
| Female | 1247 | 90.4 | {91.8, 92.8, 93.7, 93.2} | 99.0 / 96.3 |
| Model | Parameters (million) | Size (MB) | GFLOPs |
|---|---|---|---|
| DRDME-Net | 20.18 | 77.57 | 119.74 |
| CANet | 31.09 | 118.92 | 171.57 |
| FLAIR | 132.87 | 508.55 | 258.56 |
| RETFound | 304.15 | 1160.25 | 621.05 |
Our target deployment environment involves fully offline, on-device inference on PCs and smartphones with 2-4 GB RAM and no dedicated accelerators. These constraints are common in community screening setups where cameras lack integrated edge inference. In such settings, latency, energy consumption, and memory footprint are the primary bottlenecks, especially since devices are operated by community health workers running multiple applications concurrently. Under these conditions, we have focused on maintaining a single shared-feature model (DRDME-Net) to minimize both computational load and memory footprint while supporting dual-task screening. DRDME-Net infers seamlessly in the background in under 5 seconds per patient, while patient demographics are recorded. This design choice aligns with our intended use case towards offline, high-volume screening in LMICs, where several hundreds of images may be processed daily and network access is intermittent or unavailable.
6 Conclusions
In this work, we presented DRDME-Net, a joint framework for DR severity grading and DME detection, designed with clinical alignment and real-world deployment in mind. Rather than pursuing marginal gains in aggregate metrics, we emphasize robustness across clinically meaningful decision boundaries and feasibility under strict operational constraints.
Through comprehensive ablations, we demonstrated the advantages of modeling DR as a continuous severity spectrum and formulating DME detection as a regression-style task. Our analysis revealed that global metrics are relatively insensitive to many modeling choices, while boundaryspecific metrics such as GM@B provide more actionable insights into clinical reliability. To our knowledge, GM@B has not been systematically reported in prior DR screening literature, yet it provides valuable insight into boundary-specific performance that global metrics alone may miss. Despite its smaller footprint, DRDME-Net generalizes well to facility and community cohorts and across different cameras, while more efficient than large foundation models. Together, these findings highlight the promise of ordinal and regressionbased formulations in medical AI, particularly for conditions like DR and DME where disease progression is gradual.
Insights from pilots reinforce that successful clinical AI systems must balance model performance with usability, throughput, and governance. Offline operation, limited hardware, label noise, and evolving clinical practices all shape model design decisions in ways that are often underrepresented in benchmark-driven research. Overall, this work argues for a shift in emphasis from narrowly optimized models toward reliable and deployable systems that can operate effectively at scale. We hope these findings inform future efforts in clinical machine learning, particularly those targeting population-level screening in resource-limited environments.
Ethical Statement
The evaluation study involving the facility and community cohorts was approved by the Institute Ethics Committee of AIIMS Delhi (IEC-628/15.07.2022, OP-24/06.10.2023). All data were anonymized prior to use, and no personally identifiable information was used. Demographic attributes such as age and sex were used solely for data analysis, with appropriate safeguards to ensure participant privacy. This work was conducted through a multidisciplinary collaboration involving clinicians, public health practitioners, machine learning researchers, and health system stakeholders. Clinicians and public health experts guided problem formulation, labeling protocols, evaluation criteria, and clinical interpretation, while machine learning researchers developed and validated the models. Stakeholder engagement informed deployment constraints, workflow integration, and ethical considerations to ensure responsible use in real-world screening settings. Due to institutional ethics regulations regarding patient privacy, the evaluation dataset cannot be made public. However, data may be requested upon signing a Data Use Agreement approved by the ethics committee.
Acknowledgements
We gratefully acknowledge the Ministry of Health and Family Welfare (MoHFW), Government of India, and the extended teams at AIIMS Delhi and Wadhwani AI for their invaluable guidance, collaboration, and operational support.
@inproceedings{ijcai2026p819,
  title     = {Clinically-Oriented Screening Model for Diabetic Retinopathy Severity Grading and Diabetic Macular Edema Detection},
  author    = {Menezes, Sanchika and Chawla, Rohan and Shaikh, Nawazish and Venkatesh, Pradeep and Tandon, Radhika and Rana, Srinivas},
  booktitle = {Proceedings of the Thirty-Fifth International Joint Conference on
               Artificial Intelligence, {IJCAI-26}},
  publisher = {International Joint Conferences on Artificial Intelligence Organization},
  editor    = {Diego Calvanese},
  pages     = {7362--7370},
  year      = {2026},
  month     = {8},
  note      = {AI and Social Good},
  doi       = {10.24963/ijcai.2026/819},
  url       = {https://doi.org/10.24963/ijcai.2026/819},
}
TY - CPAPER TI - Clinically-Oriented Screening Model for Diabetic Retinopathy Severity Grading and Diabetic Macular Edema Detection AU - Menezes, Sanchika AU - Chawla, Rohan AU - Shaikh, Nawazish AU - Venkatesh, Pradeep AU - Tandon, Radhika AU - Rana, Srinivas T2 - Proceedings of the Thirty-Fifth International Joint Conference on Artificial Intelligence, IJCAI-26 PB - International Joint Conferences on Artificial Intelligence Organization PY - 2026 SP - 7362 EP - 7370 DO - 10.24963/ijcai.2026/819 UR - https://doi.org/10.24963/ijcai.2026/819 ER -Copied
Machine-readable versions of this paper, for tools and AI agents:





