
Trajectory Similarity Learning with Auxiliary Supervision and Optimal Matching
Proceedings of the Twenty-Ninth International Joint Conference on Artificial Intelligence. Main track. Pages 3209-3215.
https://doi.org/10.24963/ijcai.2020/444
Keywords
- Data Mining: Mining Spatial, Temporal Data
- Machine Learning: Deep Learning
- Multidisciplinary Topics and Applications: Transportation
Abstract
Trajectory similarity computation is a core problem in the field of trajectory data queries. However, the high time complexity of calculating the trajectory similarity has always been a bottleneck in real-world applications. Learning-based methods can map trajectories into a uniform embedding space to calculate the similarity of two trajectories with embeddings in constant time. In this paper, we propose a novel trajectory representation learning framework Traj2SimVec that performs scalable and robust trajectory similarity computation. We use a simple and fast trajectory simplification and indexing approach to obtain triplet training samples efficiently. We make the framework more robust via taking full use of the sub-trajectory similarity information as auxiliary supervision. Furthermore, the framework supports the point matching query by modeling the optimal matching relationship of trajectory points under different distance metrics. The comprehensive experiments on real-world datasets demonstrate that our model substantially outperforms all existing approaches.
- [Agarwal et al., 2015] Pankaj K Agarwal, Kyle Fox, Jiang- wei Pan, and Rex Ying. Approximating dynamic time warping and edit distance for a pair of point sequences. arXiv preprint arXiv:1512.01876, 2015.
- [Bellman and others, 1954] Richard Bellman et al. The the- ory of dynamic programming. Bulletin of the AMS, 60(6):503-515, 1954.
- [Belogay et al., 1997] E Belogay, C Cabrelli, U Molter, and R Shonkwiler. Calculating the hausdorff distance between curves. Information Processing Letters, 64, 1997.
- [Bentley, 1975] Jon Louis Bentley. Multidimensional bi- nary search trees used for associative searching. CACM, 18(9):509-517, 1975.
- [Chao et al., 2019] Pingfu Chao, Wen Hua, and Xiaofang Zhou. Trajectories know where map is wrong: an itera- tive framework for map-trajectory co-optimisation. World Wide Web, pages 1-27, 2019.
- [Chen et al., 2005] Lei Chen, M Tamer Özsu, and Vincent Oria. Robust and fast similarity search for moving object trajectories. In SIGMOD'05, pages 491-502, 2005.
- [Chen et al., 2009] Yukun Chen, Kai Jiang, Yu Zheng, Chunping Li, and Nenghai Yu. Trajectory simplification method for location-based social networking services. In LSBN'09, pages 33-40, 2009.
- [Chen et al., 2010] Zaiben Chen, Heng Tao Shen, Xiaofang Zhou, Yu Zheng, and Xing Xie. Searching trajectories by locations: an efficiency study. In SIGMOD'10, pages 255- 266, 2010.
- [Chow et al., 2018] Ka-Ho Chow, Anish Hiranandani, Yifeng Zhang, and S-H Gary Chan. Representation learning of pedestrian trajectories using actor-critic sequence-to-sequence autoencoder. arXiv preprint arXiv:1811.08069, 2018.
- [Chung et al., 2014] Junyoung Chung, Caglar Gulcehre, KyungHyun Cho, and Yoshua Bengio. Empirical evalua- tion of gated recurrent neural networks on sequence mod- eling. arXiv preprint arXiv:1412.3555, 2014.
- [Driemel and Silvestri, 2017] Anne Driemel and Francesco Silvestri. Locality-sensitive hashing of curves. arXiv preprint arXiv:1703.04040, 2017.
- [Eiter and Mannila, 1994] Thomas Eiter and Heikki Man- nila. Computing discrete fréchet distance. Technical re- port, Citeseer, 1994.
- [Faghri et al., 2017] Fartash Faghri, David J Fleet, Jamie Ryan Kiros, and Sanja Fidler. Vse++: Im- proving visual-semantic embeddings with hard negatives. arXiv preprint arXiv:1707.05612, 2017.
- [Gers et al., 1999] Felix A Gers, Jürgen Schmidhuber, and Fred Cummins. Learning to forget: Continual prediction with lstm. 1999.
- [Gowanlock and Casanova, 2015] Michael Gowanlock and Henri Casanova. Distance threshold similarity searches: Efficient trajectory indexing on the gpu. TPDS, 27(9):2533-2545, 2015.
- [Kingma and Ba, 2014] Diederik P Kingma and Jimmy Ba. Adam: A method for stochastic optimization. arXiv preprint arXiv:1412.6980, 2014.
- [Lee et al., 2007] Jae-Gil Lee, Jiawei Han, and Kyu-Young Whang. Trajectory clustering: a partition-and-group framework. In SIGMOD'07, pages 593-604, 2007.
- [Li et al., 2018] Xiucheng Li, Kaiqi Zhao, Gao Cong, Chris- tian S Jensen, and Wei Wei. Deep representation learning for trajectory similarity computation. In ICDE'18, pages 617-628, 2018.
- [Meng et al., 2019] Fanrong Meng, Guan Yuan, Shaoqian Lv, Zhixiao Wang, and Shixiong Xia. An overview on trajectory outlier detection. Artificial Intelligence Review, 52(4):2437-2456, 2019.
- [Müller, 2007] Meinard Müller. Dynamic time warping. In- formation retrieval for music and motion, pages 69-84, 2007.
- [Schroff et al., 2015] Florian Schroff, Dmitry Kalenichenko, and James Philbin. Facenet: A unified embedding for face recognition and clustering. In CVPR'15, pages 815-823, 2015.
- [Shan et al., 2015] Zhangqing Shan, Hao Wu, Weiwei Sun, and Baihua Zheng. Cobweb: a robust map update system using gps trajectories. In UBICOMP'15, pages 927-937, 2015.
- [Shang et al., 2017] Shuo Shang, Lisi Chen, Zhewei Wei, Christian S Jensen, Kai Zheng, and Panos Kalnis. Tra- jectory similarity join in spatial networks. Proceedings of the VLDB Endowment, 10(11):1178-1189, 2017.
- [Wang et al., 2019] Zheng Wang, Cheng Long, Gao Cong, and Ce Ju. Effective and efficient sports play retrieval with deep representation learning. In SIGKDD'19, pages 499- 509, 2019.
- [Wu et al., 2017] Hao Wu, Weiwei Sun, and Baihua Zheng. A fast trajectory outlier detection approach via driving be- havior modeling. In CIKM'17, pages 837-846, 2017.
- [Yao et al., 2018] Di Yao, Chao Zhang, Zhihua Zhu, Qin Hu, Zheng Wang, Jianhui Huang, and Jingping Bi. Learning deep representation for trajectory clustering. Expert Sys- tems, 35(2):e12252, 2018.
- [Yao et al., 2019] Di Yao, Gao Cong, Chao Zhang, and Jing- ping Bi. Computing trajectory similarity in linear time: A generic seed-guided neural metric learning approach. In ICDE'19, pages 1358-1369, 2019.
- [Zhang et al., 2019] Yifan Zhang, An Liu, Guanfeng Liu, Zhixu Li, and Qing Li. Deep representation learning of ac- tivity trajectory similarity computation. In ICWS'19, pages 312-319, 2019.
References were extracted automatically from the PDF and may contain errors.
Full text extracted automatically from the PDF; figures, tables and equations may differ. The PDF is the version of record.
1 Introduction
Evaluating the similarity between trajectories is a common task required by a wide range of applications, such as trajectory clustering [Lee et al., 2007], anomaly trajectory detection [Meng et al., 2019; Wu et al., 2017], and road completion of maps [Chao et al., 2019; Shan et al., 2015]. Many trajectory distance metrics have been proposed to measure the similarity between two trajectories, including the Dynamic Time Warping (DTW) [M¨uller, 2007], the Fr´echet distance [Eiter and Mannila, 1994], and the Hausdorff distance [Belogay et al., 1997]. These metrics require quadratic computational complexity O(l2 ), where l is the maximum length of the trajectories. It is time-consuming when faced with long trajectories, which limits the use of these distance metrics in many real-life scenarios.
Existing trajectory similarity evaluation methods can be clustered into two categories, the classical non-learningbased methods vs. learning-based methods. Those in the former category either reduce the top-k similarity search by designing an index and pruning strategy for the trajectory database [Chen et al., 2010; Shang et al., 2017], or rely on an approximate solution [Driemel and Silvestri, 2017; Agarwal et al., 2015]. However, they are designed by handcrafted heuristic approaches for one or two specific distances and hence are difficult to be generalized to other distance conditions. Methods in the latter category map trajectories into a d-dimensional uniform embedding representation with learnable functions. The distance between two l-length trajectories is converted to the distance between two d-dimensional vectors. In other words, it reduces the complexity of trajectory similarity evaluation from O(l2 ) to O(d). The improvement is considered significant as d << l2 . In addition, the representation vectors of trajectories can be used as a pretrained embedding that could be an input of a learning-based model for downstream applications like trajectory classification. Currently, there are many trajectory representation learning methods for similarity computation [Li et al., 2018; Zhang et al., 2019; Chow et al., 2018; Yao et al., 2018; Wang et al., 2019]. Among them, [Yao et al., 2019] is the state-of-the-art method, which uses seed-guided neural metric learning method to compute trajectory similarity.
However, existing learning-based methods still suffer from some shortcomings. First, supervised models like [Yao et al., 2019] need to calculate the distance for all trajectory pairs to construct training samples. The time complexity of this process is O(n2 l2 ), where n is the training set size. This cost limits the training set size of the model. In order to improve its scalability, we construct triplet training samples with a simple and fast trajectory simplification and indexing method, which can efficiently obtain approximate neighboring trajectories frommassive trajectory dataset. Second, existing methods utilize the distance between two complete trajectories to evaluate their similarity but ignore the rich information carried by sub-trajectories and the mutual constraint relationship between them. We propose a novel sub-trajectory-based loss function to supervise distance between sub-trajectory pairs, which makes our model more robust and helps to improve the performance of similarity computation. Third, a trajectory could be considered as a set of points, and distance metrics like Fr´echet, DTW and Hausdorff essentially find the optimal matching between two trajectory point sets under different rules. In some scenarios, we care about these point matching relationships rather than distance values. Consequently, it is desirable to support point-matching query that locates, for a given point, its optimal matching point(s) from another trajectory. Existing methods ignore the matching relationship, so they can not support the point-matching query. We propose a point matching loss to learn the optimal matching relationships between points.
In brief, we make four contributions in this paper:
- We propose a simple yet efficient approach to locate approximate neighbors for any trajectory in a massive trajectory dataset, with the help of trajectory simplification and a tree structure index. This approach allows us to expand the size of the training set with a much lower cost and hence effectively addresses the scalability issue.
- We design a sub-trajectory distance loss function that fully leverages the distances between sub-trajectories obtained from dynamic programming for auxiliary supervision. It improves both the robustness of the model and its performance in similarity computation.
- We propose a point matching loss function to learn the optimal matching relationship between points. It allows our model to support the optimal point matching query under different distance metrics.
- We conduct comprehensive experiments on two realworld datasets to evaluate our model. The results demonstrate the advantage of our model over the stateof-the-art baselines.
2 RelatedWork
Existing accelerated trajectory similarity computation methods can be broadly divided into two categories, non-learningbased methods and learning-based methods.
Non-learning-based methods can be further clustered into two categories, according to the type of queries supported. The first category supports top-k nearest neighbor search. They use tree-based index structures like k-d tree, ball-tree or R-tree to maintain trajectory data hierarchically and speed up the search processing [Chen et al., 2010; Shang et al., 2017]. For example, [Chen et al., 2010; Gowanlock and Casanova, 2015] performed pruning optimization techniques based on whether the sub-trajectories and point segments are within a bounding box, respectively. However, these methods only support top-k similarity search and can not compute the similarity between any two trajectories. The second category speeds up the computation by designing heuristic algorithms for spatial and temporal characteristics. [Driemel and Silvestri, 2017] designed a set of hash functions to speed up the computation of Fr´echet and Hausdorff distance. [Chen et al., 2005] proposed a method of pruning by grid histograms to approximate the similarity. [Agarwal et al., 2015] proposed a fast approximate algorithm for DTW distance. These methods mainly rely on hand-crafted heuristic rules for specific distances and hence there are room for further improvement. Learning-based methods mainly learn trajectory embedding vectors to represent the similarity relationship through learnable functions. [Li et al., 2018; Zhang et al., 2019; Yao et al., 2018; Wang et al., 2019] all used similar encoderdecoder models to obtain trajectory vector representations and use different spatio-temporal characteristics as features. [Chow et al., 2018] used the actor-critic reinforcement learning method to model trajectory distance. [Yao et al., 2019] proposed a neural metric learning approach to compute the similarity with pair-wise distance as guidance. These methods neither fully mine the distance information between subtrajectories nor explicitly restrict the matching relationship between trajectory points under different distance metrics.
3 Preliminary
Definition. A trajectory is a sequence of locations with timestamps. For any two trajectories X and Y , S(X, Y ) measures the similarity between them. Here, S can be the distance metrics like Fr´echet distance F , DTWD, and Hausdorff distance H, etc. Our research problem is to learn the approximate similarity function G(X, Y ) through the neural network learning functions, such that G is close to S and can be calculated in constant time O(d), where d is the dimension of the trajectory representation vector. Besides, we will also use neural network G to learn the optimal matching points in Y for points in X under different distance metrics.
Distance metrics. In this paper, we use Fr´echet distance F, Hausdorff distance H, and DTW D as representative distance metrics to measure the similarity of a given trajectory pair 〈X, Y 〉. They are computed differently, representing the similarity measurement of trajectories from different perspectives.
In discrete form, they can be calculated by dynamic programming [Bellman and others, 1954] or enumeration. Mi,j (M ∈ {F,D,H}) refers to the corresponding distance between two sub-trajectories X(1:i) and Y(1:j). Notation X(1:i) refers to a sub-trajectory formed by the first i points of X. The state transition equations are as follows,
4 Methodology
We propose a deep representation learning model Traj2SimVec as a solution. Our model consists of three parts, training data construction, trajectory encoder, and two types of supervised loss functions. First, training data construction generates triplet training samples. Second, trajectory encoder takes samples generated in previous step as inputs and map them to similarity space and matching space respectively to get trajectory representation vectors. Third, two types of supervised loss functions guide the learning in two different spaces.
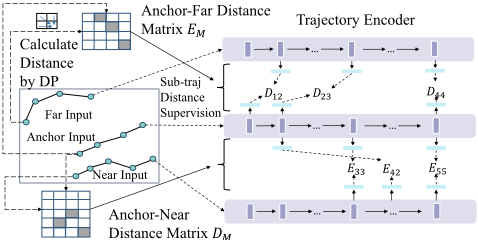
Distance Matrix 𝐷𝑀
Figure 1: An example of sub-trajectory distance loss.
4.1 Training Sample Construction
Our model requires both the distance and matching relationship of trajectory pairs to supervise the learning. As reported by existing works [Faghri et al., 2017], the choice of sample pairs has an essential impact on the final performance of learning models. [Yao et al., 2019] enumerates the distances between any pair of trajectories to find the top-k most similar results as samples. However, it suffers from high computation cost as there are in total O(n2 ) trajectory pairs, making it impractical for massive datasets. For example, given a middlesized trajectory set T with n = 100, 000 and l = 100, a total of O(1014 ) trajectory point distance calculations are required.
We adopt a different approach by taking in similar trajectory pairs (but not necessarily the most similar pairs) as input to reduce the cost of forming training samples. We use a simple yet effective trajectory simplification and an index structure to obtain similar trajectory pairs as model samples quickly. Trajectory simplification [Chen et al., 2009] is a compression method that reduces the size of the trajectory but retains the subject structure of the trajectory. Here, we divide the trajectory evenly into k segments and average the trajectory points of each segment as the representative point, to obtain a new trajectory of uniform length k. Given a trajectory T = {p1, p2, · · · , pl} of l points, its simplified trajectory T ′ is
Here, pi = (lati, loni) represents a point with latitude and longitude and ∑ki=1 ci = l with ci ∈ [⌊ lk ⌋, ⌊ lk ⌋ + 1]. A trajectory is then represented as a 2k-dimensional vector, in the form of (T ′ .lat1, T ′ .lon1, · · · , T ′ .latk, T ′ .lonk).
Given a trajectory set T , we simplify all the trajectories in T and index them using a 2k-dimensional k-d tree [Bentley, 1975]. Note, each point in the k-d tree corresponds to the simplified trajectory of a trajectory in T . When we construct training samples, we randomly sample a point from the k-d tree as an anchor input Ia, and locate its k nearest neighbors with the help of k-d tree, which incurs a time complexity of O(logn). Among those k returned neighbors, we randomly select one as near input Ine. We then randomly sample another point in the k-d tree as far input If to complete the construction of one triplet training sample, which is in the form of 〈Ia, Ine, If 〉.
4.2 Sub-trajectory Distance Loss
In order to learn the trajectory representation, we need the trajectory encoder function f : traj -→ vector to encode a trajectory to a vector. As shown in Figure 1, the trajectory encoder is a RNN-type model (e.g., GRU [Chung et al., 2014], LSTM [Gers et al., 1999] or other network structures). As introduced in Section 3, we use dynamic programming or enumeration to compute the distance between trajectories X and Y and get a distance matrix DM. Each element Dij in DM represents the distance between sub-trajectories X(1:i) and Y(1:j). Existing methods [Yao et al., 2019] only use the last element D|X||Y | in DM as the supervision signal, but ignore the other crucial sub-trajectory distance constraints carried by other elements in DM. To leverage such rich and additional supervision information, we design a sub-trajectory distance loss mechanism for auxiliary supervision.
First, we feed the original trajectories Ta, Tne, and Tf in T corresponding to Ia, Ine and If in a training sample into the RNN-based trajectory encoder to obtain the corresponding hidden state vectors Ha = {ha1 , · · · , ha|Ta| }, Hne , and Hf . Then, we map the trajectories into a specific space dedicated to computing similarity through a similarity space mapping unit fhid→sim that is in residual network structure. For an intermediate hidden state vector hi, fhid→sim calculates the vector vi in the similarity space as follows.
We can get the vector representations V a = {va 1 , · · · , va |Ta| } of trajectories Ta in the similarity space. V ne and V f can be obtained in the same way.
We can obtain the distance matrix DM for the trajectory pair 〈Ta, Tne〉 and the distance matrix EM for the trajectory pair 〈Ta, Tf〉, based on the distance metrics calculation introduced in Section 3. Each element Dij ∈ DM represents the real distance between the sub-trajectories Ta(1:i) and Tne(1:j). The similarity between them can be modeled by the L2 distance ‖va i - vne j ‖2. We randomly sample r elements {Di1,j1 ,Di2,j2 , · · · ,Dir,jr } from DM as supervised signals to define the sub-trajectory loss function Lsim near between Ta and Tne. Here D′it,jt = exp(-α · Dit,jt ) ∈ [0, 1] is the normalized similarity of Dit,jt , and α is a tunable parameter controlling the similarity value. We can get the sub-trajectory loss Lsim far between Ta and Tf in a similar way.
In addition to the above loss function, we also add distance supervision to the entire trajectory pairs. In summary, Eq. (7) defines the sub-trajectory distance loss function, where n1 = |Ta|, n2 = |Tne|, and n3 = |Tf |.
Loss function defined in Eq. (7) allows the model to learn not only the similarity between two complete trajectories, but also the similarity between different sub-trajectories. Consequently, it is equipped with the intermediate distance information of trajectory pairs. As an auxiliary supervision loss function, it has the following two advantages. First, the intermediate distance information, to some extent, provides more trajectory pair samples and makes the model more robust. Second, the intermediate supervisory information can effectively reduce the risk of vanishing gradient of long sequences.
4.3 Trajectory Point Matching Loss
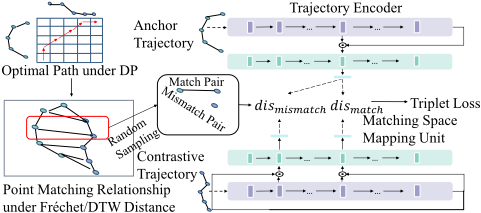
As mentioned before, the distance between two trajectories is essentially determined by the matching criteria defined by different metrics. Take Fr´echet as an example. Assume an optimal path between Ta and Tne is inferred by Eq. (1), denoted as 〈(1, 1), (2, 2), (2, 3), · · · , (|Ta|, |Tne|)〉. This is to say, based on the optimal point matching defined by Fr´echet distance, the 1st point in Ta matches the 1st point in Tne, the 2nd point in Ta matches the 2nd and the 3rd points in Tne, and so on. In some applications, we care about this optimal point matching relationship but not the real distance. For example, an interesting application of Fr´echet distance is to indicate the shortest length of dog leash required for movement between a person and a dog. The optimal matching can tell us the corresponding positions where the dog owner took the leash when the dog was at a certain position like a garden under the Fr´echet distance. The optimal matching relationship under some distance metrics (e.g., Fr´echet distance and DTW) is very complicated, which requires an enumeration (e.g., dynamic programming) to get the optimal path. In order to support a faster retrieval of the optimal matching points, we propose the trajectory point matching loss, which uses the matching space mapping unit to enable the model to learn the matching relationship.
First, we construct the matching space mapping unit fhid→mat. Since the optimal matching is a global solution that only can be obtained after computing the entire trajectory similarity, the hidden state vector hl needs to represent the information of the entire trajectory T = {p1, p2, ..., pl} to help the intermediate hidden state ht to be effectively mapped into a matching space. For an intermediate hidden state vector ht, fhid→mat uses an LSTM cell C to combine ht and hl in the matching space. We can get the vector representations M of a trajectory T in the matching space by fhid→mat.
| Dataset | Porto | Shanghai |
|---|---|---|
| # Trajectories (n) | 999,082 | 1,278,550 |
| # Trajectory points (n× l) | 45.6×10⁶ | 121.7×10⁶ |
| Trajectory sampling interval | 15.01 sec | 9.39 sec |
| Trajectory minimum length | 10 | 10 |
| Trajectory maximum length | 3836 | 5549 |
| Trajectory length mean | 45.67 | 95.19 |
As shown in Figure 2, for a point pi ∈ Ta and a point qj ∈ Tne, we learn whether they match each other based on their distance in the matching space by triplet loss [Schroff et al., 2015]. We use random sampling to sample r′ triples {〈pi1 , qj1 , ql1 〉, · · · , 〈pir′ , qjr′ , qlr′ 〉}, where 〈pit , qjt 〉s refer to the optimal matching pairs in Ta and Tne and 〈pit , qlt 〉s are the mismatching pairs. Eq. (8) defines the trajectory point matching loss between Ta and Tne, where ξ is the margin value and mait is the matching space vector of it-th point pit in Ta. We can get the trajectory point matching loss Lmatch far between Ta and Tf in the same manner. Thereafter, we define the trajectory point matching loss Lmatch as Lmatch far +Lmatch near .
5 Experiments
We conduct comprehensive experiments to compare the performance of our model with existing competitors.
Datasets. We use two real trajectory datasets in our experimental study, namely Porto that was extracted from open source dataset available at https://kaggle.com/c/pkdd15-predict-taxi-service-trajectory-i and Shanghai. Table 1 reports the description and statistics of the two datasets.
Hyperparameters. We split each dataset into training set, validation set and test set in the ratio 3:1:6. We set the length of simplified trajectory T ′ to 5, and the number of elements sampled from distance matrix D and E to 10 (i.e., k = 5, r = 10). The tunable parameter α is the reciprocal of the maximum distance of training sample distances for Fr´echet and Hausdorff distance, and the mean plus three times the variance of training sample distances for DTW. The margin value ξ of point matching loss is 0.01. The sampled triple number of point matching loss is 10 (i.e., r′ = 10). The trajectory representation vector has a dimensionality of 128 (i.e., d = 128). We use the LSTM model as the RNN encoder and matching space mapping unit. The hidden unit is 128. We train the model using Adam algorithm [Kingma and Ba, 2014] with an initial learning rate at 0.001. All the weights are uniformly initialized to (- 1 √128 , 1 √128 ).
Metrics. Following the state-of-the-art approach [Yao et al., 2019], we adopt HR@10, HR@50 and R10@50 as major performance metrics. The top-k hitting ratio (HR@k) examines the overlap (in terms of percentage) between the returned top-k results and the ground truth; top-t recall for the top-k ground truth (Rk@t) evaluates the top-k ground truth recovered by the top-t produced by different methods.
Competitors. We implement histogram [Chen et al., 2005], traj2vec [Yao et al., 2018], t2vec [Li et al., 2018], NT-NoSAM [Yao et al., 2019], and NEUTRAJ [Yao et al., 2019] as representatives. histogram is a non-learning based embedding method, which splits a region into grids and approximates the similarity by counting the number of trajectory points in different grids. traj2vec and t2vec are both auto-encoder models, but t2vec uses additional embedding and attention techniques and processes the data noise. NEUTRAJ is the state-of-the-art trajectory similarity learning method with its source code openly available at https://github.com/yaodi833/NeuTraj. It is a metric learning approach using seed-guided neural network to compute similarity. NT-No-SAM is a weaker version of NEUTRAJ, which replaces the spatial attention module with standard LSTM.
5.1 Overall Evaluation
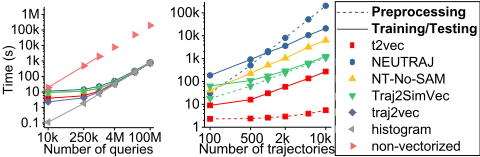
The performance of similarity search. We evaluate the performance of similarity computation approaches for the topk similarity search task. We randomly selected 10,000 trajectories from the test set, and try to find top-k similar trajectories from the entire test set (600k+ and 700k+ trajectories in Porto and Shanghai) for each of these trajectories. Since NEUTRAJ and NT-No-SAM need to calculate the distance matrix for all trajectory pairs in the training set to construct training samples, they cannot handle large datasets. Instead, we randomly select 10,000 trajectories from the training set to form their training samples. As reported in Table 2, our model Traj2SimVec outperforms all the competitors substantially. Compared with state-of-the-art algorithm (NEUTRAJ), Traj2SimVec performs much better. For example, it achieves at least 25%+ gain in terms of HR@10 on both datasets. Although Traj2SimVec and NEUTRAJ both use metric learning methods to learn the similarity of trajectories, Traj2SimVec performs better since it is scalable to large-scale datasets and it uses a sub-trajectory distance loss for extra auxiliary supervision. In addition, we report the testing time, preprocessing and training time required by different methods in Figure 3. We compare the non-vectorized method to directly query the similarity of original trajectories with learning models. The results show that the testing time for learning models is significantly shorter than nonvectorized method. We could also observe that NEUTRAJ and Nt-No-SAM require significantly longer preprocessing time than other methods, as they have to calculate the trajectory distance matrix for training.
The performance of point matching. We evaluate the performance of point matching approaches for the top-k matching task. We implement two baselines, namely Nearest and Order. Nearest finds the nearest neighbor in the corresponding trajectory as a matching point for every query point. Order uses the relative position of each point in the entire trajectory as a distance metrics. Given a trajectory T1 = {p1, · · · , p5}, the relative position of point p3 ∈ T1 is 3/5.
Consequently, its nearest point in another trajectory T2 is the one located at the same relative position. The point optimal matching relationship in Hausdorff distance finds the point in another trajectory that is closest to it, which is equivalent to the baseline Nearest. However, the point optimal matching relationship under the distance metrics of DTW and Fr´echet is much more complicated. We use M@1, M@5 and M@10 as performance metrics. M@k examines the overlap percentage of the returned top-k nearest points and the ground truth optimal matching points. As shown in Table 3, Traj2SimVec consistently outperforms both baseline methods with noticeable advantage. It shows that the distance between points and the order of points in the trajectory cannot characterize the relationship of point optimal matching well. Our model learns more complex matching rules than baselines.
5.2 Performance of Traj2SimVec
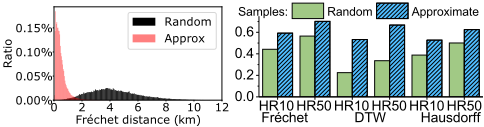
The effectiveness of approximate sampling. Figure 4 reports the distribution of distances of trajectory pairs in training set under two different sampling approaches. Random sampling (RS) randomly selects a trajectory from the training set to form a sample pair with anchor trajectory Ta. Approximate nearest sampling (AS) uses trajectory simplification and indexing to find a trajectory close to Ta to form a trajectory pair with Ta. As reported, samples formed by AS have much shorter distances, as compared with those generated by RS. This demonstrates the superior performance of the training sample construction component of Traj2SimVec. We also report the performance of our model trained by different training samples under Porto dataset in Figure 4. As observed, samples generated by AS approach are more powerful as they help the learning model to achieve a much better performance. That is to say, our model can construct approximate near and far samples to effectively train on a large-scale dataset, which enhances the scalability of our model.
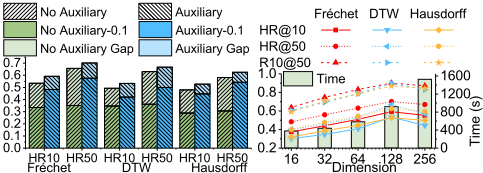
The effectiveness of sub-trajectory distance loss. In order to demonstrate the effectiveness of the proposed subtrajectory distance loss with auxiliary supervision, we compare it with the model without the auxiliary supervision. As shown in Figure 5, the model using sub-trajectory distance loss as auxiliary supervision performs better than the model without sub-trajectory distance loss. We also keep only the first 10% sub-trajectory for each trajectory in the test set, and conduct experiments on the sub-trajectories to test the robustness of the model, denoted as Auxiliary-0.1 and No Auxiliary-0.1 in the left subfigure of Figure 5. We could observe from the result that the gap of decline in the model with auxiliary supervision is significantly smaller than the model without auxiliary supervision. This proves that our sub-trajectory distance loss not only improves the overall performance , but also effectively supervises the similarity relationship of sub-trajectories, making the model more robust. The impact of the dimensions of representation vector. In all the above experiments, a trajectory is represented by a 128-dimensional vector. In order to evaluate the impact of the dimensions d of the vector, we evaluate the performance Traj2SimVec under different settings (i.e., 16, 32, 64, 128, and 256), with result reported in the right subfigure of Figure 5. It is observed that Traj2SimVec gradually improves its performance as the vector dimension increases, and it reaches its best performance when d = 128. This shows that the representation vector of a trajectory needs enough large dimension to represent the spatio-temporal information of the trajectory, but a space of too many dimensions actually increases the difficulty of learning. In addition, we report the time cost of computing vector distance and performing top-k similarity search on the entire test set under different d settings. We test the time cost on an AMD Ryzen Threadripper 2950X processor with 32 threads. As d increases, it only requires more time for computing the trajectory similarity. However, as compared with computing similarity between original trajectories that requires more than 20 hours, the evaluation of trajectory similarity in this vector space is far more efficient.
| Dataset | Method | Fr´echet | DTW | Hausdorff | ||||||
|---|---|---|---|---|---|---|---|---|---|---|
| HR@10 | HR@50 | R10@50 | HR@10 | HR@50 | R10@50 | HR@10 | HR@50 | R10@50 | ||
| histogram | 0.0111 | 0.0255 | 0.0336 | 0.0149 | 0.0331 | 0.0420 | 0.0115 | 0.0269 | 0.0359 | |
| traj2vec | 0.1039 | 0.1457 | 0.3003 | 0.1336 | 0.1789 | 0.3729 | 0.0931 | 0.1236 | 0.2598 | |
| Porto t2vec | 0.2401 | 0.2832 | 0.4655 | 0.2476 | 0.2922 | 0.4819 | 0.2219 | 0.2543 | 0.4313 | |
| NT-No-SAM | 0.4727 | 0.5909 | 0.8021 | 0.3931 | 0.4979 | 0.7329 | 0.4024 | 0.5004 | 0.7512 | |
| NEUTRAJ | 0.4751 | 0.5928 | 0.8071 | 0.4126 | 0.5223 | 0.7525 | 0.3992 | 0.5029 | 0.7484 | |
| Traj2SimVec | 0.5919 | 0.7017 | 0.9011 | 0.5332 | 0.6669 | 0.8988 | 0.5270 | 0.6251 | 0.8694 | |
| histogram | 0.0212 | 0.0393 | 0.0547 | 0.0270 | 0.0488 | 0.0666 | 0.0238 | 0.0463 | 0.0657 | |
| traj2vec | 0.0936 | 0.1317 | 0.2888 | 0.1047 | 0.1413 | 0.3199 | 0.0667 | 0.0966 | 0.2229 | |
| Shanghai t2vec | 0.2735 | 0.2921 | 0.5021 | 0.2690 | 0.2856 | 0.4849 | 0.2064 | 0.2202 | 0.4234 | |
| NT-No-SAM | 0.4663 | 0.5894 | 0.7628 | 0.2484 | 0.3393 | 0.5674 | 0.3260 | 0.3999 | 0.7077 | |
| NEUTRAJ | 0.4774 | 0.5981 | 0.7944 | 0.2597 | 0.3497 | 0.5857 | 0.3272 | 0.4032 | 0.7092 | |
| Traj2SimVec | 0.6136 | 0.6910 | 0.8902 | 0.3626 | 0.4829 | 0.7376 | 0.4805 | 0.5625 | 0.8867 | |
| Dataset | Porto (Fr´echet) | Porto (DTW) | Shanghai (Fr´echet) | Shanghai (DTW) | ||||||||
|---|---|---|---|---|---|---|---|---|---|---|---|---|
| Method | M@1 | M@5 | M@10 | M@1 | M@5 | M@10 | M@1 | M@5 | M@10 | M@1 | M@5 | M@10 |
| Nearest | 0.1484 | 0.2995 | 0.4361 | 0.1931 | 0.3318 | 0.4482 | 0.2125 | 0.2991 | 0.3794 | 0.2265 | 0.3047 | 0.3729 |
| Order | 0.1087 | 0.2979 | 0.4688 | 0.1470 | 0.4147 | 0.6127 | 0.0563 | 0.1548 | 0.2585 | 0.0723 | 0.2066 | 0.3368 |
| Traj2SimVec | 0.3353 | 0.6649 | 0.8010 | 0.3338 | 0.7373 | 0.8780 | 0.3153 | 0.5602 | 0.6872 | 0.3049 | 0.5442 | 0.6799 |
6 Conclusion
In this paper, we propose a novel trajectory similarity learning model Traj2SimVec. It adopts trajectory simplification and indexing technique to reduce the cost of generating samples, hence making it applicable to large datasets; it proposes a sub-trajectory distance loss to further improve the robustness and performance of the model; and it utilizes a point matching loss to learn the optimal matching between points.
Acknowledgements
This research is supported in part by the National Natural Science Foundation of China under grant 61772138, the National Key Research and Development Program of China under grant 2018YFB0505000,2019YFB1704400 and the National Research Foundation, Prime Ministers Office, Singapore under its International Research Centres in Singapore Funding Initiative. Any opinions, findings and conclusions or recommendations expressed in this material are those of the author(s) and do not reflect the views of National Research Foundation, Singapore.
@inproceedings{ijcai2020p444,
  title     = {Trajectory Similarity Learning with Auxiliary Supervision and Optimal Matching},
  author    = {Zhang, Hanyuan and Zhang, Xinyu and Jiang, Qize and Zheng, Baihua and Sun, Zhenbang and Sun, Weiwei and Wang, Changhu},
  booktitle = {Proceedings of the Twenty-Ninth International Joint Conference on
               Artificial Intelligence, {IJCAI-20}},
  publisher = {International Joint Conferences on Artificial Intelligence Organization},
  editor    = {Christian Bessiere},
  pages     = {3209--3215},
  year      = {2020},
  month     = {7},
  note      = {Main track},
  doi       = {10.24963/ijcai.2020/444},
  url       = {https://doi.org/10.24963/ijcai.2020/444},
}
TY - CPAPER TI - Trajectory Similarity Learning with Auxiliary Supervision and Optimal Matching AU - Zhang, Hanyuan AU - Zhang, Xinyu AU - Jiang, Qize AU - Zheng, Baihua AU - Sun, Zhenbang AU - Sun, Weiwei AU - Wang, Changhu T2 - Proceedings of the Twenty-Ninth International Joint Conference on Artificial Intelligence, IJCAI-20 PB - International Joint Conferences on Artificial Intelligence Organization PY - 2020 SP - 3209 EP - 3215 DO - 10.24963/ijcai.2020/444 UR - https://doi.org/10.24963/ijcai.2020/444 ER -Copied
Machine-readable versions of this paper, for tools and AI agents:





