
Simultaneous Prediction Intervals for Patient-Specific Survival Curves
Proceedings of the Twenty-Eighth International Joint Conference on Artificial Intelligence. AI for Improving Human Well-being. Pages 5975-5981.
https://doi.org/10.24963/ijcai.2019/828
Keywords
- Special Track on AI for Improving Human-Well Being: Health applications (Special Track on AI and Human Wellbeing)
Abstract
Accurate models of patient survival probabilities provide important information to clinicians prescribing care for life-threatening and terminal ailments. A recently developed class of models -- known as individual survival distributions (ISDs) -- produces patient-specific survival functions that offer greater descriptive power of patient outcomes than was previously possible. Unfortunately, at the time of writing, ISD models almost universally lack uncertainty quantification. In this paper we demonstrate that an existing method for estimating simultaneous prediction intervals from samples can easily be adapted for patient-specific survival curve analysis and yields accurate results. Furthermore, we introduce both a modification to the existing method and a novel method for estimating simultaneous prediction intervals and show that they offer competitive performance. It is worth emphasizing that these methods are not limited to survival analysis and can be applied in any context in which sampling the distribution of interest is tractable. Code is available at https://github.com/ssokota/spie.
- [Broad Institute TCGA Genome Data Analysis Center, 2016] Broad Institute TCGA Genome Data Analysis Center. Analysis-ready standardized tcga data from broad gdac firehose 2016 01 28 run, 2016.
- [Cheng et al., 1997] SC Cheng, LJ Wei, and Z Ying. Pre- dicting survival probabilities with semiparametric trans- formation models. Journal of the American Statistical Association, 1997.
- [Colditz and Rosner, 2000] Graham A. Colditz and Bernard A Rosner. Cumulative risk of breast cancer to age 70 years according to risk factor status: data from the nurses' health study. American journal of epidemiology, 2000.
- [Cox, 1972] David R Cox. Regression models and life- tables. Journal of the Royal Statistical Society: Series B (Methodological), 34(2):187-202, 1972.
- [Giunchiglia et al., 2018] Eleonora Giunchiglia, Anton Nemchenko, and Mihaela van der Schaar. Rnn-surv: A deep recurrent model for survival analysis. In In- ternational Conference on Artificial Neural Networks. Springer, 2018.
- [Greenwood and others, 1926] Major Greenwood et al. A report on the natural duration of cancer. A Report on the Natural Duration of Cancer., 1926.
- [Griewank and Walther, 2008] Andreas Griewank and An- drea Walther. Evaluating derivatives: principles and techniques of algorithmic differentiation, volume 105. Siam, 2008.
- [Haider et al., 2018] Humza Haider, Bret Hoehn, Sarah Davis, and Russell Greiner. Effective ways to build and evaluate individual survival distributions. arXiv:1811.11347, 2018.
- [Hall and Wellner, 1980] Wendy J Hall and Jon A Wellner. Confidence bands for a survival curve from censored data. Biometrika, 1980.
- [Hoffman and Gelman, 2014] Matthew D Hoffman and An- drew Gelman. The no-u-turn sampler: adaptively setting path lengths in hamiltonian monte carlo. Journal of Ma- chine Learning Research, 2014.
- [Ishwaran and Lu, 2008] Hemant Ishwaran and Min Lu. Random survival forests. Wiley StatsRef: Statistics Refer- ence Online, pages 1-13, 2008.
- J. D. Kalbfleisch and R. L. Prentice. The Statistical Analysis of Failure Time Data. John Wiley & Sons, 2nd edition, 2002.
- [Kaplan and Meier, 1958] E. L. Kaplan and Paul Meier. Nonparametric estimation from incomplete observations. Journal of the American Statistical Association, 1958.
- [Katzman et al., 2016] Jared L Katzman, Uri Shaham, Alexander Cloninger, Jonathan Bates, Tingting Jiang, and Yuval Kluger. Deep survival: A deep cox proportional hazards network. stat, 2016.
- [Lin et al., 1994] DY Lin, TR Fleming, and LJ Wei. Con- fidence bands for survival curves under the proportional hazards model. Biometrika, 1994.
- [Luck et al., 2017] Margaux Luck, Tristan Sylvain, Héloïse Cardinal, Andrea Lodi, and Yoshua Bengio. Deep learn- ing for patient-specific kidney graft survival analysis. arXiv:1705.10245, 2017.
- [Nair, 1984] Vijayan N Nair. Confidence bands for survival functions with censored data: a comparative study. Tech- nometrics, 1984.
- [Olshen et al., 1989] Richard A Olshen, Edmund N Biden, Marilynn P Wyatt, and David H Sutherland. Gait analysis and the bootstrap. The annals of statistics, 1989.
- [Ranganath et al., 2016] Rajesh Ranganath, Adler Perotte, Noémie Elhadad, and David Blei. Deep survival analysis. arXiv:1608.02158, 2016.
- [Salvatier et al., 2016] John Salvatier, Thomas V Wiecki, and Christopher Fonnesbeck. Probabilistic programming in python using pymc3. PeerJ Computer Science, 2016.
- [Yu et al., 2011] Chun-Nam Yu, Russell Greiner, Hsiu-Chin Lin, and Vickie Baracos. Learning patient-specific cancer survival distributions as a sequence of dependent regres- sors. In Advances in Neural Information Processing Sys- tems, 2011.
References were extracted automatically from the PDF and may contain errors.
Full text extracted automatically from the PDF; figures, tables and equations may differ. The PDF is the version of record.
1 Introduction
Understanding a patient's probability of survival is critical for patient care - predicting survival outcomes both facilitates better treatment decisions and more informed time management. While learning survival times resembles standard regression, it is more challenging in that many training instances are censored - only a lower bound of the survival time is known. Survival analysis, a field of statistics concerned with analyzing the time until an event of interest occurs, offers a natural language for studying patient survival times. Unfortunately, most standard survival analysis tools cannot answer comprehensive questions about individual patients' survival probabilities. Risk scores, such as those given by the Cox proportional hazards model [Cox, 1972], produce patient-specific hazard scores, which predict the order of patient deaths rather than survival probabilities. Single-time probabilistic models, such as the Gail model [Colditz and Rosner, 2000], produce a probability of survival for each patient, but only for one point in time. Population-based survival curves, such as KaplanMeier [Kaplan and Meier, 1958], offer probability values for each point in time but for populations rather than individual patients.
∗These authors contributed equally to this work.
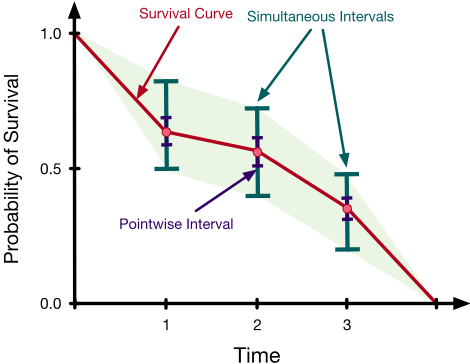
These limitations have motivated a class of models that learn an individual survival distribution (ISD) - a function that gives the probability P(T > t | x) that a patient with feature vector x will survive to at least time t [Haider et al., 2018]. In other words, an ISD model produces a survival curve (see Figure 1; red line) specific to each patient. This class of models includes classical systems such as the the Cox model with the Kalbfleisch-Prentice extension (Cox-KP) [Kalbfleisch and Prentice, 2002], and the Accelerated Failure Time model (AFT) [Kalbfleisch and Prentice, 2002], but also more recent models such as Random Survival Forests [Ishwaran and Lu, 2008], Multi-Task Logistic Regression (MTLR) [Yu et al., 2011], and a host of deep learning models [Luck et al., 2017; Katzman et al., 2016; Ranganath et al., 2016].
Unfortunately, while the greater complexity of ISD models allows for greater expressive power, it makes analytical uncertainty quantification difficult or impossible. This is problematic because, to make an intelligent decision based on an agglomeration of sources, it is essential that a clinician be able to understand the trustworthiness of each piece of information. If clinicians cannot judge the reliability of patient-specific survival curves, the applicability of ISD models in clinical settings is limited.
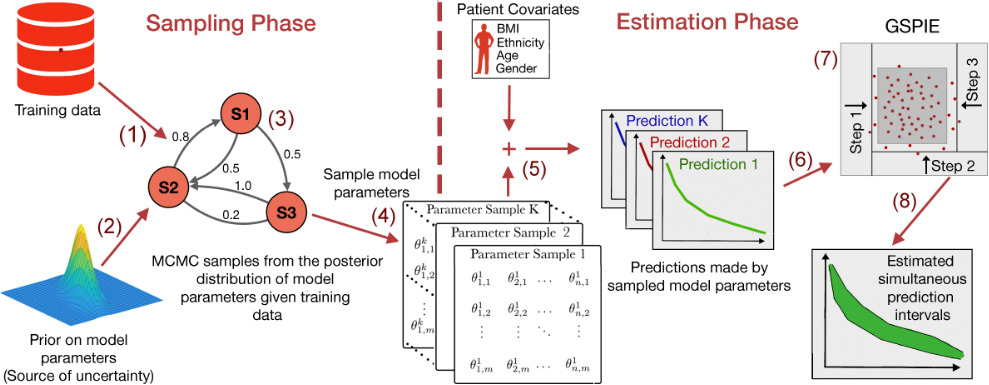
In this work we seek to remedy this situation by showcasing an easily implementable pipeline for estimating the uncertainty of patient-specific survival curves. This pipeline has two phases. First, in the sampling phase, we acquire model samples using either bootstrapping or posterior sampling. Second, in the estimation phase, we use the model samples to estimate uncertainty for specific patients. Whereas analytical methods for estimating uncertainty are typically model specific, this pipeline is largely model agnostic - it is applicable to any model for which it is feasible to acquire bootstrap or posterior samples. Many modern ISD models meet this condition and stand to benefit from the advent of flexible, efficient, and accurate uncertainty quantification.
2 RelatedWork
There is a large body of literature regarding the construction of confidence intervals for population-based models. The Kaplan-Meier (KM) estimator is an example of a model possessing both pointwise confidence intervals (see Figure 1; blue lines), which can be derived with Greenwood's approximation coupled with the normal approximation [Greenwood and others, 1926], and confidence regions (see Figure 1; light green area), which can be derived with an adaptation of Greenwood's formula [Nair, 1984] or using Brownian bridge limits [Hall and Wellner, 1980]. Approximate confidence regions also exist for the Cox model [Lin et al., 1994], and a large class of semi-parametric transform models [Cheng et al., 1997] via approximations with a Gaussian process. The transformation models allow for a non-parametric baseline hazard and relax the proportional hazard assumption, making them more flexible than the Cox model. However, these transformation models assume that a predetermined function of the survival curve varies linearly with patient features. Additionally, these approximations tend to be poor at extreme time points, yielding useful confidence regions only between the smallest and largest observed event times.
Individual survival distribution models are more expressive than population-based models but in general lack uncertainty quantification. In this work we address this shortcoming by proposing a sampled-based pipeline for finding simultaneous prediction intervals over a discrete sequence of time points for patient-specific survival curves produced by ISD models. The discretization of time is less of an issue than it might seem, as many of the top performing ISD models already discretize time to facilitate learning [Yu et al., 2011; Giunchiglia et al., 2018; Luck et al., 2017]. Moreover, for ISD models that produce a continuous prediction, simultaneous prediction intervals can be estimated over a very large number of time points.
Closest to the present work, Olshen et al. introduced methodology to estimate simultaneous prediction intervals for gaits of normal children. The methodology, henceforth Olshen's method, is an instance of what we refer to as a simultaneous prediction intervals estimator (SPIE). In this work we show that Olshen's method can easily be applied to patient-specific survival analysis and offers strong performance. We also introduce both a modification to Olshen's method and a novel SPIE which offer competitive performance.
3 Background
An ISD is a function f(x, t) := P(T > t | x) inducing a survival curve for each patient with feature vector x ∈ Rd . In practice, many algorithms model an ISD over a discretized set of n time points t1 < t2 < · · · < tn - i.e., each survival curve is a member of the n-discretized survival space
A learned ISD model m of Sn yields survival curves given by
where
For brevity, we will omit the n superscript.
From a Bayesian perspective, m has prior distribution p(m). Because a patient's learned survival vector s(x,m) is a function of m, it is a random vector. This uncertainty is reflected by the predictive posterior distribution p(s(x,m) | D) for observed training data D. Usually, the posterior distribution over models p(m | D) does not exist in closed form. However, if the posterior can be computed up to a normalization constant - as is often the case - it can be sampled using Markov chain Monte Carlo (MCMC) methods, as is shown in the sampling phase of Figure 2. Furthermore, if the gradient of the log posterior is available, modern MCMC methods [Hoffman and Gelman, 2014] can efficiently sample high-dimensional parameter spaces with minimal tuning [Salvatier et al., 2016]. For many models, this gradient exists and can be computed with little effort using open source packages and automatic differentiation [Griewank and Walther, 2008].
From a frequentist perspective, uncertainty arises from the distribution over possible training datasets, each of which may induce a different instance of the model. Since the empirical distribution of data approximates the underlying distribution from which it was drawn, sampling from the empirical distribution - bootstrapping - approximates sampling possible training datasets from the underlying distribution. For models with efficient fitting procedures, an instance can be fit to each bootstrapped dataset, yielding a set of models analogous to Bayesian posterior samples collected from MCMC methods.
Ultimately, we are interested in using these sampled models to estimate simultaneous prediction intervals for the survival curves of specific patients. In the context of this work, a prediction interval is an interval within which, with a certain probability, the patient's likelihood of survival falls at a certain time point given the observed information. Prediction intervals arise in both Bayesian and frequentist frameworks.
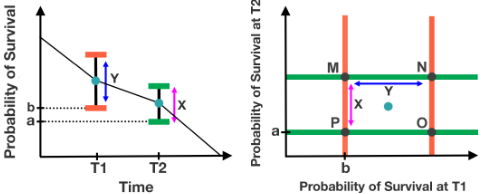
When dealing with n-discretized survival space, we can view simultaneous prediction intervals as an orthotope 1 in [0, 1]n . We display the visual relationship between simultaneous prediction intervals as viewed on a survival graph and as viewed as a subset of [0, 1]n for a two-discretized survival curve in Figure 3. SPIEs can be viewed as estimating an ndimensional orthotope that, with the prescribed probability, contains a point sampled from the appropriate n-dimensional distribution. From this perspective, given samples {z(i) }, Olshen's method yields orthotopes Ok({z(i) }) of the form
where µ gives the sample mean, σ gives the sample standard deviation, and subscript t gives the tth component. In our context {z(i) } = {s(x,m(i) )} is a set of survival curves specific to a patient with features x (as shown by the green, red and blue curves in the estimation phase of Figure 2) and {z(i) t } = {s(x,m(i) )t} is the values of these survival curves at time t. Ideally k is chosen such that the orthotope contains a sample from the underlying distribution with probability 1 - α. To approximate this choice, Olshen's method bootstraps the samples to construct a collection of sample sets {{z(i) }b}b∈B. Letting ρ(C, D) denote the proportion of elements of C that are elements of D, Olshen's method chooses the smallest k such that
4 Methodology
The pipeline examined in this paper has two phases. In the sampling phase (see Figure 2; left) bootstrap or posterior samples of the model are acquired. These model samples approximate the uncertainty that is present in the system and are used to quantify uncertainty of predictions for new patients. In the estimation phase (see Figure 2; right), given a new patient, these model samples are used for simultaneous prediction interval estimation. In addition to investigating this framework in the context of patient-specific survival analysis, this paper also introduces two alternative SPIEs to that used by Olshen. One is a small modification to Olshen's method that can produce asymmetric intervals; the other takes a simple but effective greedy hill climbing approach.
1 An orthotope is a Cartesian product of intervals.
4.1 Two-Sided Olshen's Method
One disadvantage of Olshen's original method is that the prediction intervals are constrained to be symmetric about the mean. In the case of a highly asymmetric sample distribution, this could be a costly restriction. To address this, twosided Olshen's method replaces Ok({z(i) }) by O± k ({z(i) }, for both orthotope construction and the computation of k, where O± k ({z(i) } is given by
where m gives the median, σ+ gives the sample root mean squared difference between the median and the values greater than or equal to the median, and σ- gives the sample root mean squared difference between the median and the values less than or equal to the median. We think of σ+ and σ- as capturing information about the variance of each side of the distribution.
4.2 Greedy Hill Climbing
A simple alternative to Olshen's method is to do greedy optimization over the landscape of orthotopes. We call this approach greedy simultaneous prediction intervals estimator (GSPIE). GSPIE begins with an orthotope O containing all samples {z(i) }. At each time step, GSPIE retracts one "wall" of the orthotope O from its current position inwards such that it lies on the nearest sample in {z(i) } in the interior of O (see Figure 2; (7)). GSPIE makes this decision greedily - at each time step it considers retracting each wall, selecting the retraction corresponding to the greatest reduction in interval width per sample excluded. For example, if exactly one sample lies on each wall, GSPIE takes a step that reduces the sum over interval widths ∑t Out -Oℓt of O = ∏t [Oℓt , Out ] by the value
where rx is the retraction operator discussed above moving "wall" x inwards. The hill climbing procedure ends when the next retraction would leave O containing less than 1 - α of a validation set {z(i) val }.
5 Experiments
In our experiments, we consider four survival datasets. The Northern Alberta Cancer Dataset (NACD; 2402 patients, 53 features, 36% censorship), includes patients with many types of cancer: including lung, colorectal, head and neck, esophagus, stomach, etc. The other three datasets are from The Cancer Genome Atlas (TCGA) Research Network [Broad Institute TCGA Genome Data Analysis Center, 2016]: Glioblastoma multiforme (GBM; 592 patients, 12 features, 18% censorship), Rectum adenocarcinoma (READ; 170 patients, 18 features, 84% censorship), and Breast invasive carcinoma (BRCA; 1095 patients, 61 features, 86% censorship). These datasets contain "rightcensored patients" - patients for whom the dataset specifies only a lower-bound on survival time.
For each dataset, we converted categorical variables into one-hot labels and imputed the mean for missing real-valued features. Each feature was normalized to mean zero and unit variance. Each dataset was shuffled and divided into a training set and a testing set with a 75/25 split. For its greedy hill climbing procedure, GSPIE divided each test patient's survival curve samples into an optimization set and a validation set with a 50/50 split. Since our experiments are in the context of survival analysis, we project the upper and lower bounds of each estimated SPI into Sn .
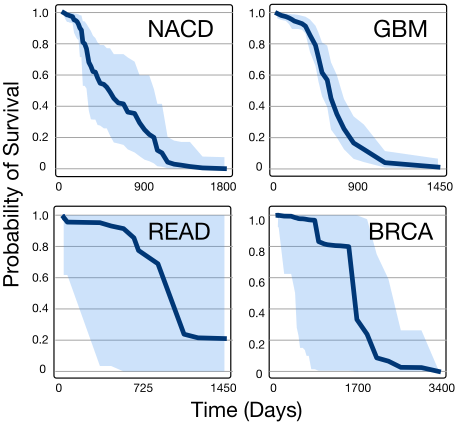
In Figure 4 we show an example of 95% simultaneous prediction intervals (with linear interpolation) of a patient's survival function for each dataset. We attempted to select representative examples for each dataset. As might be expected, models trained on datasets with high censorship rates (READ and BRCA) yield highly uncertain survival functions.
Prescribed Coverage Probability
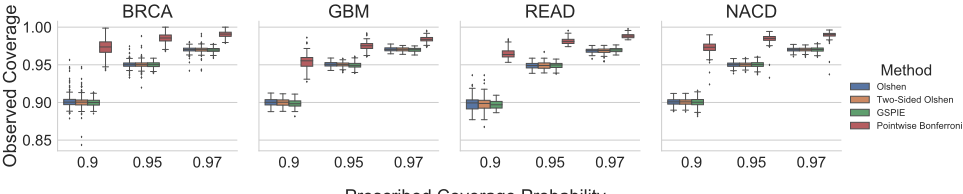
Figure 5: An accurate method's observed coverage should closely correspond to the prescribed coverage. Both of Olshen variants and GSPIE show much better accuracy than a naive Bonferroni correction, which guarantees conservative simultaneous intervals.
5.1 Evaluating Performance
In evaluating SPIEs, there are two metrics of concern. First, an estimator should be accurate - prescribing a 1 - α coverage probability should yield simultaneous intervals that include a random sample with probability 1 - α. Second, an estimator should produce tight prediction intervals - i.e., simultaneous prediction intervals with small average width. However, note that these two metrics are not independently meaningful. It is neither useful to have loose, accurate intervals, nor to have tight inaccurate intervals. 2 Unfortunately, as far we are aware, there exists no established metric that unifies accuracy and tightness in a manner that is robust to different tradeoff preferences. Therefore, while we present these metrics separately, we encourage readers to take a holistic perspective.
To examine the performance of these methods, we used multi-task logistic regression (MTLR), which had the strongest performance of the methods examined in [Haider et al., 2018], as our ISD model. We trained MTLR using a regularization factor of 1/2, which was tuned with fivefold cross-validation and √N time points (where N is the size of the training set), such that an equal number of events occurs between each two time points, as is recommended by [Yu et al., 2011]. We considered a Bayesian approach - we collected 10,000 posterior samples from the posterior p(m | D) using NUTS [Hoffman and Gelman, 2014] and estimated joint prediction intervals for the predictive posterior distribution p(s(x,m) | D) of test set patients. We used an isotropic Gaussian prior for MTLR's model parameters with a variance corresponding with the tuned ℓ2 regularization factor. While not strictly necessary, enforcing this correspondence causes the predictions from the fitted MTLR model to coincide with the maximum a posteriori (MAP) estimate.
Accuracy
To evaluate the accuracy of the prediction orthotopes, we ran a second chain and collected 10,000 test samples from the predictive posterior distribution p(s(x,m) | D) for each test set patient. Accurate 1-α simultaneous prediction intervals should contain roughly (1 - α) × 10, 000 of these samples. Figure 5 displays the results of the analysis on each patient in the test set. We include Olshen's method, twosided Olshen's method, GSPIE, and also a pointwise interval baseline 3 with a Bonferroni correction. The most significant takeaway from the results is that the former three methods are much more accurate than the conservative Bonferroni correction, which guarantees a lower bound on the coverage probability of the simultaneous intervals. Of course, the accuracy of all of the methods is highly dependent on the number of model samples that are available.
2 Though in many contexts we may not mind a method producing conservative simultaneous intervals, insofar as conservatism does not come at the cost of tightness.
Tightness
To evaluate the tightness of the prediction intervals we measure the average interval width. On a survival graph, this metric is proportional to Lebesgue measure in the case that intervals exist for every time point, but extends more sensibly to our circumstance, in which intervals exist for only a finite number of time points. Figure 6 displays the result of the analysis. For each patient in the test set and for each SPIE, we measured the percentage change in the average interval width compared to pointwise intervals with a Bonferroni correction - lower is better. For BRCA and READ, all three methods appear to have perform similarly, notably exceeding the baseline. For GBM and NACD, there seems to be a clearer distinction between the methods - GSPIE generally gave tighter intervals than two-sided Olshen's method, which itself generally gave tighter intervals than Olshen's method.
5.2 Discretization of Continuous Time Curves
Although the methods discussed in this paper are limited to a finite number of time points, there is no reason they cannot be applied to ISD models that produce continuous time curves. However, one might worry that using a very large number of time points (i.e., a fine discretization) might cause SPIEs to produce trivially large prediction intervals. To investigate this possibility, we used the Weibull accelerated failure time model [Kalbfleisch and Prentice, 2002], which produces continuous time patient-specific survival curves, Average Width on each of the four datasets. We considered a Bayesian perspective, assuming an isotropic Gaussian prior for the model parameters and a Gumbel distribution with a half-normal hyperprior for the noise. We show the results in Figure 7, where mean average width with 95% pointwise confidence intervals is plotted as a function of the discretization for each of the different datasets. We observe that all three methods were able to find highly nontrivial simultaneous prediction intervals for finely discretized curves. We expect this result to hold generally across other continuous models and datasets.
3 Pointwise intervals were obtained from percentile estimates via the ogive (i.e., the empirical distribution with linear interpolation).
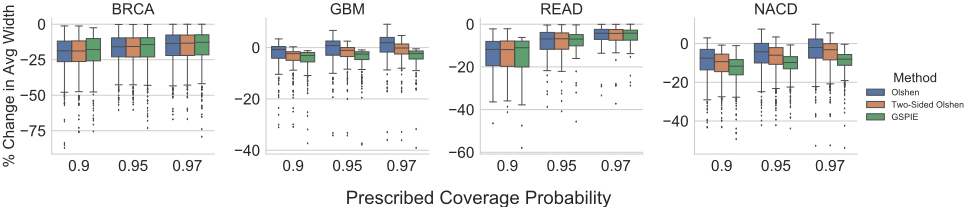
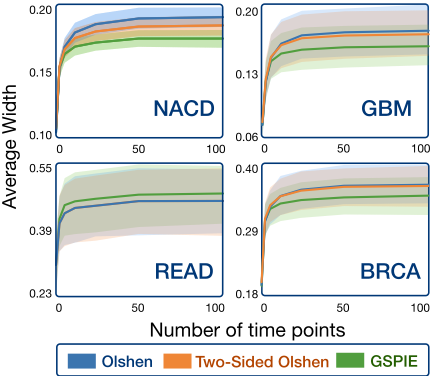
Figure 7: The figure shows SPI tightness as a function of discretization. Even with fine discretizations, all three methods found highly nontrivial prediction intervals.
5.3 Discussion
Our experiments suggest that Olshen's method, two-sided Olshen's method, and GSPIE all perform well as SPIEs. All three are accurate, efficient, find relatively tight intervals, and can be applied to continuous time models with fine discretizations. The right choice of estimator appears to be context dependent. For example, with MTLR, on NACD and GBM, GSPIE may offer the best compromise between accuracy and tightness, whereas on READ and BRCA, it is less clear. Luckily, given that all three methods are efficient and can make use of the same model samples, it is relatively easy to try and test 4 all of them.
6 Conclusion
In this work we promote a framework for quantifying the uncertainty of patient-specific survival curves. The methods examined here are easily-implementable and applicable to a large class of ISD models. We hope this framework will allow clinicians to more comfortably consider ISD models as a source of information for patient-specific decisions.
Lastly, although the focus of this paper is patient-specific survival analysis, the SPIEs we examined are general purpose tools for estimating SPI from samples. We anticipate that these methods could prove useful in many contexts outside of survival analysis, such as time series analysis, trigonometric regression, and quantile regression.
@inproceedings{ijcai2019p828,
  title     = {Simultaneous Prediction Intervals for Patient-Specific Survival Curves},
  author    = {Sokota, Samuel and D'Orazio, Ryan and Javed, Khurram and Haider, Humza and Greiner, Russell},
  booktitle = {Proceedings of the Twenty-Eighth International Joint Conference on
               Artificial Intelligence, {IJCAI-19}},
  publisher = {International Joint Conferences on Artificial Intelligence Organization},
  editor    = {Sarit Kraus},
  pages     = {5975--5981},
  year      = {2019},
  month     = {8},
  note      = {AI for Improving Human Well-being},
  doi       = {10.24963/ijcai.2019/828},
  url       = {https://doi.org/10.24963/ijcai.2019/828},
}
TY - CPAPER TI - Simultaneous Prediction Intervals for Patient-Specific Survival Curves AU - Sokota, Samuel AU - D'Orazio, Ryan AU - Javed, Khurram AU - Haider, Humza AU - Greiner, Russell T2 - Proceedings of the Twenty-Eighth International Joint Conference on Artificial Intelligence, IJCAI-19 PB - International Joint Conferences on Artificial Intelligence Organization PY - 2019 SP - 5975 EP - 5981 DO - 10.24963/ijcai.2019/828 UR - https://doi.org/10.24963/ijcai.2019/828 ER -Copied
Machine-readable versions of this paper, for tools and AI agents:





