
Delayed Impact of Fair Machine Learning
Proceedings of the Twenty-Eighth International Joint Conference on Artificial Intelligence. Best Sister Conferences. Pages 6196-6200.
https://doi.org/10.24963/ijcai.2019/862
Keywords
- Machine Learning: Learning Theory
- Machine Learning: Interpretability
- Humans and AI: Ethical Issues in AI
- Machine Learning: Classification
Abstract
Static classification has been the predominant focus of the study of fairness in machine learning. While most models do not consider how decisions change populations over time, it is conventional wisdom that fairness criteria promote the long-term well-being of groups they aim to protect. This work studies the interaction of static fairness criteria with temporal indicators of well-being. We show a simple one-step feedback model in which common criteria do not generally promote improvement over time, and may in fact cause harm. Our results highlight the importance of temporal modeling in the evaluation of fairness criteria, suggesting a range of new challenges and trade-offs.
- [Barocas and Selbst, 2016] Solon Barocas and Andrew D. Selbst. Big data's disparate impact. California Law Re- view, 104, 2016.
- [Calders et al., 2009] Toon Calders, Faisal Kamiran, and Mykola Pechenizkiy. Building classifiers with indepen- dency constraints. In Proc. IEEE ICDMW, ICDMW '09, pages 13-18, 2009.
- [Chouldechova, 2016] Alexandra Chouldechova. Fair pre- diction with disparate impact: A study of bias in recidi- vism prediction instruments. FATML, 2016.
- [Coate and Loury, 1993] Stephen Coate and Glenn Loury. Will affirmative-action policies eliminate negative stereo- types? 83:1220-40, 02 1993.
- [Ensign et al., 2017] Danielle Ensign, Sorelle A Friedler, Scott Neville, Carlos Scheidegger, and Suresh Venkata- subramanian. Runaway feedback loops in predictive polic- ing. arXiv preprint arXiv:1706.09847, 2017.
- [Executive Office of the President, 2016] Executive Office of the President. Big data: A report on algorithmic systems, opportunity, and civil rights. Technical report, White House, May 2016.
- [Foster and Vohra, 1992] Dean P Foster and Rakesh V Vohra. An economic argument for affirmative action. Ra- tionality and Society, 4(2):176-188, 1992.
- [Fuster et al., 2017] Andreas Fuster, Paul Goldsmith- Pinkham, Tarun Ramadorai, and Ansgar Walther. Predictably unequal? the effects of machine learning on credit markets. SSRN, 2017.
- [Green and Hu, 2018] Ben Green and Lily Hu. The myth in the methodology: Towards a recontextualization of fair- ness in machine learning. Stockholm, Sweden, 2018.
- [Hardt et al., 2016] Moritz Hardt, Eric Price, and Nati Sre- bro. Equality of opportunity in supervised learning. In Proc. 30th NIPS, 2016.
- [Hu and Chen, 2018] Lily Hu and Yiling Chen. A short-term intervention for long-term fairness in the labor market. In Proc. 27th WWW, 2018.
- [Joseph et al., 2016] Matthew Joseph, Michael Kearns, Jamie H Morgenstern, and Aaron Roth. Fairness in learning: Classic and contextual bandits. In Proc. 30th NIPS, pages 325-333, 2016.
- [Kalev et al., 2006] Alexandra Kalev, Frank Dobbin, and Erin Kelly. Best Practices or Best Guesses? Assessing the Efficacy of Corporate Affirmative Action and Diversity Policies. American Sociological Review, 71(4):589-617, 2006.
- [Keith et al., 1985] Stephen N. Keith, Robert M. Bell, Au- gust G. Swanson, and Albert P. Williams. Effects of affir- mative action in medical schools. New England Journal of Medicine, 313(24):1519-1525, 1985.
- [Kleinberg et al., 2017] Jon M. Kleinberg, Sendhil Mul- lainathan, and Manish Raghavan. Inherent trade-offs in the fair determination of risk scores. Proc. 8th ITCS, 2017.
- [Knowles et al., 2001] John Knowles, Nicola Persico, and Petra Todd. Racial bias in motor vehicle searches: Theory and evidence. Journal of Political Economy, 109(1):203- 229, 2001.
- [Liu et al., 2018] Lydia T. Liu, Sarah Dean, Esther Rolf, Max Simchowitz, and Moritz Hardt. Delayed impact of fair machine learning. In International Conference on Ma- chine Learning, pages 3156-3164, 2018.
- [Pleiss et al., 2017] Geoff Pleiss, Manish Raghavan, Felix Wu, Jon Kleinberg, and Kilian Q Weinberger. On fair- ness and calibration. In Advances in Neural Information Processing Systems 30, pages 5684-5693, 2017.
- [Ross and Yinger, 2006] Stephen Ross and John Yinger. The Color of Credit: Mortgage Discrimination, Research Methodology, and Fair-Lending Enforcement. MIT Press, Cambridge, 2006.
- [US Federal Reserve, 2007] US Federal Reserve. Report to the congress on credit scoring and its effects on the avail- ability and affordability of credit, 2007.
- [Zafar et al., 2017] Muhammad Bilal Zafar, Isabel Valera, Manuel Gomez Rogriguez, and Krishna P. Gummadi. Fair- ness Constraints: Mechanisms for Fair Classification. In Proc. 20th AISTATS, pages 962-970. PMLR, 2017.
References were extracted automatically from the PDF and may contain errors.
Full text extracted automatically from the PDF; figures, tables and equations may differ. The PDF is the version of record.
1 Introduction
Machine learning commonly considers static objectives defined on a snapshot of the population at one instant in time; consequential decisions, in contrast, reshape the population over time. Lending practices, for example, can shift the distribution of debt and wealth in the population. Job advertisements allocate opportunity. School admissions shape the level of education in a community.
Existing scholarship on fairness in automated decisionmaking criticizes unconstrained machine learning for its potential to harm historically underrepresented or disadvantaged groups in the population [Executive Office of the President, 2016; Barocas and Selbst, 2016]. Consequently, a variety of fairness criteria have been proposed as constraints on standard learning objectives. Even though, in each case, these constraints are clearly intended to protect the disadvantaged group by an appeal to intuition, a rigorous argument to that effect is often lacking.
In this work, we formally examine under what circumstances fairness criteria do indeed promote the long-term well-being of disadvantaged groups measured in terms of a temporal variable of interest. Going beyond the standard classification setting, we introduce a one-step feedback model of decision-making that exposes how decisions change the underlying population over time.
∗This paper is an abridged version of the paper of the same name which appeared at the 35th International Conference of Machine Learning [Liu et al., 2018]. The interested reader is referred to the full version for extended results and discussion.
Our running example is a hypothetical lending scenario. There are two groups in the population with features described by a summary statistic, such as a credit score, whose distribution differs between the two groups. The bank can choose thresholds for each group at which loans are offered. While group-dependent thresholds may face legal challenges [Ross and Yinger, 2006], they are generally inevitable for some of the criteria we examine. The impact of a lending decision has multiple facets. A default event not only diminishes profit for the bank, it also worsens the financial situation of the borrower as reflected in a subsequent decline in credit score. A successful lending outcome leads to profit for the bank and also to an increase in credit score for the borrower.
When thinking of one of the two groups as disadvantaged, it makes sense to ask what lending policies (choices of thresholds) lead to an expected improvement in the score distribution within that group. An unconstrained bank would maximize profit, choosing thresholds that meet a break-even point above which it is profitable to give out loans. One frequently proposed fairness criterion, sometimes called demographic parity, requires the bank to lend to both groups at an equal rate. Subject to this requirement the bank would continue to maximize profit to the extent possible. Another criterion, originally called equality of opportunity, equalizes the true positive rates between the two groups, thus requiring the bank to lend in both groups at an equal rate among individuals who repay their loan. Other criteria are natural, but for clarity we restrict our attention to these three.
Do these fairness criteria benefit the disadvantaged group? When do they show a clear advantage over unconstrained classification? Under what circumstances does profit maximization work in the interest of the individual? These are important questions that we begin to address in this work.
2 Problem Setting
We introduce a one-step feedback model that allows for the quantification of the long-term impact of classification on different groups in the population. Individuals are assigned scores in X := {1, . . . ,C}, where a score highlights one variable of interest in a specific domain such that higher score values correspond to a higher probability of a positive outcome. This score is used by an institution, which makes a binary decision for each individual in each group. The institution designs selection policies τ : X → [0, 1] that assign to each possible score a number representing the rate of selection for that value. In our example, these policies specify the lending rate at a given credit score. We consider policies designed to maximize the utility of the institution, potentially subject to fairness constraints.
To measure the impact of decisions, we assume the availability of a function ∆: X → R that provides the expected change in score for a selected individual at a given score. The central quantity we study is the expected difference ∆µ in the mean score that results from the selection policy. When modeling the problem, the expected mean difference can also absorb external factors so long as they are mean-preserving.
We focus on the impact of a selection policy over a single epoch. The motivation is that the designer of a system usually has an understanding of the time horizon after which the system is evaluated and possibly redesigned. Formally, nothing prevents the repeated application of our model and to trace changes over multiple epochs. In reality, however, it is plausible that over greater time periods, economic background variables might dominate the effect of selection.
To compare the impact of classification for different groups, we consider two groups A and B, which comprise a gA and gB = 1 - gA fraction of the total population. We use subscripts on previously defined quantities to denote the group-specific values, e.g. πA denotes the distribution of A over scores. We assume that that there exists a function u : X → R, such that the institution's expected utility for a policy τ is additive over individuals:
Then we consider how the outcome of the decision differs between groups. The average change of the mean score µj for group j is given by
We remark that many of our results also go through if ∆µj(τ ) simply refers to an abstract change in group well-being, not necessarily a change in the mean score. Lastly, we assume that the success of an individual is independent of their group given the score; that is, the score summarizes all relevant information about the success event, so there exists a function ρ : X → [0, 1] such that individuals of score x succeed with probability ρ(x).
Example 2.1 (Credit scores). In the setting of loans, scores x ∈ [C] represent credit scores, and the bank serves as the institution. The bank chooses to grant or refuse loans to individuals according to a policy τ . Both the profit and the change in credit score are given as functions of loan repayment, and therefore depend on the success probabilities ρ(x), representing the probability that any individual with credit score x can repay a loan within a fixed time frame. The expected utility to the bank is given by the expected return from a loan, which can be modeled as an affine function of ρ(x): u(x) = u+ρ(x) + u-(1 - ρ(x)), where u+ denotes the profit when loans are repaid and u- the loss when they are defaulted on. Individual outcomes of being granted a loan
OUTCOME CURVE
are based on whether or not an individual repays the loan, and a simple model for ∆(x) may also be affine in ρ(x): ∆(x) = c+ρ(x) + c-(1 - ρ(x)), modified accordingly at boundary states. The constant c+ > 0 denotes the gain in credit score if loans are repaid and c- < 0 is the score penalty in case of default.
2.1 The Outcome Curve
We now introduce important outcome regimes, stated in terms of the change in average group score. In particular, we focus on these outcomes for a disadvantaged group, and from this point forward, we take A to be the disadvantaged or protected group. We denote the policy that maximizes the institution's utility in the absence of constraints as MaxUtil. Under our model, MaxUtil policies can be chosen in a standard fashion which applies the same threshold τ MaxUtil for both groups, and is agnostic to the distributions πA and πB. Hence, if we define
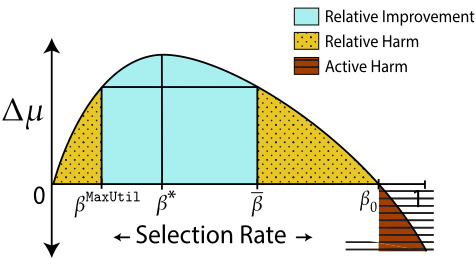
we say that a policy causes relative harm to the protected group if ∆µA(τA) < ∆µMaxUtil A , relative improvement if ∆µA(τ A) > ∆µMaxUtil A , and active harm if ∆µA(τA) < 0.
Figure 1 displays the important outcome regimes in terms of selection rates βj := ∑x∈X πj(x)τ j(x). This succinct characterization is possible when considering decision rules based on score thresholding, in which all individuals with scores above a threshold are selected. To explicitly connect selection rates to decision policies, we define the rate function rπj (τ j) which returns the proportion of group j selected by the policy. In the following, we will abuse notation to abbreviate ∆µj(r-1 πj (β)) as ∆µj(β). Now we define the values of β that mark boundaries of the outcome regions:
Definition 2.1 (Selection rates of interest). Given the protected group A, the following selection rates are of interest in distinguishing between qualitatively different classes of outcomes (Figure 1): βMaxUtil is the selection rate for A under MaxUtil; β0 is the harm threshold, such that ∆µA(β0) = 0; β∗ is the selection rate such that ∆µA is maximized; β
is the outcome-complement of the MaxUtil selection rate, ∆µA(β) = ∆µA(βMaxUtil ) with β ≥ βMaxUtil .
2.2 Decision Rules and Fairness Criteria
We will consider policies that maximize the institution's total expected utility, potentially subject to a constraint set C which enforces some notion of "fairness". Formally, the institution selects τ∗ ∈ argmax U(τ) s.t. τ ∈ C. We consider the three following constraints:
Definition 2.2 (Fairness criteria). The maximum utility (MaxUtil) policy corresponds to the null-constraint, so that the institution is free to focus solely on utility. The demographic parity (DemParity) policy results in equal selection rates between both groups. Formally, the constraint is C = {(τA, τB) : ∑x∈X πA(x)τA = ∑x∈X πB(x)τB} . The equal opportunity (EqOpt) policy results in equal true positive rates (TPR) between both group, where TPR is defined as TPRj(τ) := ∑x∈X πj (x)ρ(x)τ (x) ∑x∈X πj(x)ρ(x) . EqOpt ensures that the conditional probability of selection given that the individual will be successful is independent of the population, formally enforced by the constraint C = {(τA, τB) : TPRA(τA) = TPRB(τB)} .
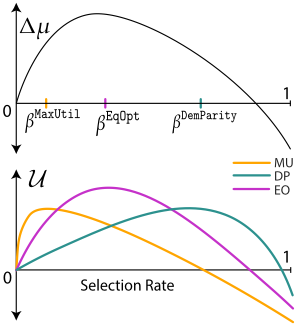
Just as the expected outcome ∆µ can be expressed in terms of selection rate for threshold policies, so can the total utility U. In the unconstrained case, U varies independently over the selection rates for group A and B; however, in the presence of fairness constraints the selection rate for one group determines the allowable selection rate for the other. The selection rates must be equal for DemParity, and for EqOpt there is a one-to-one mapping. Therefore, when considering threshold policies, decision rules amount to maximizing functions of single parameters. This idea is expressed in Figure 2, and underpins the results to follow.
3 Results
In order to clearly characterize the outcome of applying fairness constraints, we make the following assumption.
Assumption 1 (Institution utilities). The institution's individual utility function is more stringent than the expected score changes, u(x) > 0 =⇒ ∆(x) > 0. (For the linear form presented in Example 2.1, uu+ < cc+ is necessary and sufficient.)
This simplifying assumption quantifies the intuitive notion that institutions take a greater risk by accepting than the individual does by applying. For example, in the credit setting, a bank loses the amount loaned in the case of a default, but makes only interest in case of a payback. Using Assumption 1, we can restrict the position of MaxUtil on the outcome curve in the following sense.
Proposition 3.1 (MaxUtil does not cause active harm). Under Assumption 1, 0 ≤ ∆µMaxUtil ≤ ∆µ∗ .
We direct the reader to the full version of this paper [Liu et al., 2018] for the proof of the above proposition, and all subsequent theorems presented in this section.
3.1 Prospects and Pitfalls of Fairness Criteria
We begin by characterizing general settings under which fairness criteria act to improve outcomes over unconstrained MaxUtil strategies.
Proposition 3.2 (Fairness criteria can cause relative improvement). Assume that group A is disadvantaged in the sense that the MaxUtil acceptance rate for B is large compared to relevant acceptance rates for A. Then there are general settings under which g0, g1, g2, g3 exist such that (a) DemParity causes relative improvement as long as gA ∈ [g0, g1], and (b) EqOpt causes relative improvement as long as gA ∈ [g2, g3].
A full description of conditions under which we can guarantee that fairness criteria cause improvement relative to MaxUtil is given in [Liu et al., 2018]. The result follows from comparing the position of optima on the utility curve to the outcome curve. Figure 2 displays an illustrative example of both the outcome curve and the institution's utility U as a function of the selection rates in group A. In the utility function (1), the contributions of each group are weighted by their population proportions gj, and thus the resulting selection rates are sensitive to these proportions. As we see in the remainder of this section, fairness criteria can achieve nearly any position along the outcome curve under the right conditions. This fact comes from the potential mismatch between the outcomes, controlled by ∆, and the institution's utility u.
The next theorem implies that DemParity can be bad for long term well-being of the protected group by being overgenerous.
Proposition 3.3 (DemParity can cause harm by being over-eager). Assume that ∆µA(βMaxUtil B ) < 0. Then there are general settings under which a g0 exists such that DemParity cases active or relative harm as long as gA ∈ [0, g0].
Notice that both the assumption and the condition encode notions that could be taken to mean 'disadvantage:' The assumption says that a policy which selects individuals from group A at the selection rate that MaxUtil would have used for group B necessarily lowers average score in A. The condition requires that gA is small enough.
Using credit scores as an example, Theorem 3.3 tells us that an overly aggressive fairness criterion will give too many loans to people in a protected group who cannot pay them back, hurting the group's credit scores on average. An analogous result holds for EqOpt, and is stated in [Liu et al., 2018].
3.2 Comparing EqOpt and DemParity
It is difficult to compare DemParity and EqOpt on general terms. In fact, we have found that settings exist both in which DemParity causes harm while EqOpt causes improvement and in which DemParity causes improvement while EqOpt causes harm.
Proposition 3.4 (EqOpt may avoid active harm where DemParity fails). For a simple example of distributions, there exists g0, g1 such that for gA ∈ [g0, g1], DemParity causes active harm while EqOpt causes improvement.
In the simple geometry of the example for the above result, EqOpt is better than DemParity at avoiding active harm because it is more conservative. A natural question then is: can EqOpt cause relative harm by being too stingy?
Theorem 3.5 (DemParity never loans less than MaxUtil, but EqOpt might). Suppose that the MaxUtil policy is such that βMaxUtil A < βMaxUtil B and TPRA(τ MaxUtil ) > TPRB(τ MaxUtil ). Then EqOpt causes relative harm by selecting at a rate lower than MaxUtil.
4 Simulations
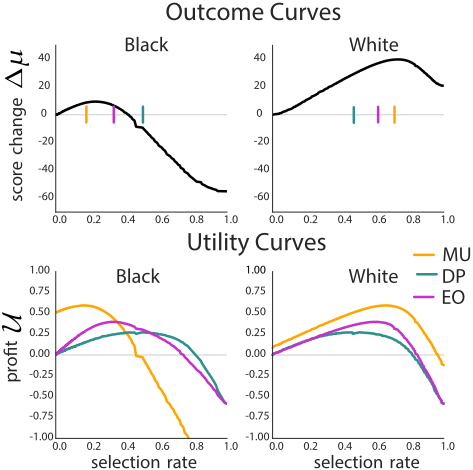
We examine the outcomes induced by fairness constraints in the context of FICO scores for two race groups. FICO scores are a proprietary classifier widely used in the United States to predict credit worthiness. Our FICO data is based on a sample of 301,536 TransUnion TransRisk scores from 2003 [US Federal Reserve, 2007], preprocessed by [Hardt et al., 2016]. Empirical data labeled by race allows us to estimate the distributions πj, where j represents race, which is restricted to two values: white non-Hispanic (labeled "white" in figures), and black. We use the outcome and profit models from Example 2.1, with individual penalties as a score drop of c- = -150 in the case of a default, and in increase of c+ = 75 in the case of successful repayment. We also model the utility ratio of the bank as uu+ = -4. Further details of the presented simulations are in [Liu et al., 2018].
Figure 3 displays the outcome and utility curves for both the white and the black group. In this figure, the top panel corresponds to the average simulated change in credit scores for each group under different loaning rates β; the bottom panels shows the corresponding total utility U (summed over both groups and weighted by group population sizes) for the bank. Although one might hope for decisions made under fairness constraints to positively affect the black group, we observe the opposite behavior for DemParity, which causes a decrease in the average credit score. This behavior stems from a discrepancy in the outcome and profit curves for the black population.
5 Conclusion
Reflecting on our findings, we argue that careful temporal modeling is necessary in order to accurately evaluate the impact of different fairness criteria on the population. The nuances of our characterization underline how intuition may be a poor guide in judging the long-term impact of fairness constraints. Our formal framework exposes a concise, yet expressive way to model outcomes via the expected change in a variable of interest caused by an institutional decision. This leads to the natural concept of an outcome curve that allows us to interpret and compare solutions effectively. In essence, the formalism we propose requires us to understand the twovariable causal mechanism that translates decisions to outcomes. Depending on the application, such an understanding might necessitate greater domain knowledge and additional research into the specifics of the application. This is consistent with much scholarship that points to the context-sensitive nature of fairness in machine learning [Green and Hu, 2018].
Acknowledgements
We thank Lily Hu, Aaron Roth, and Cathy O'Neil for discussions and feedback on an earlier version of the manuscript. We thank the students of CS294: Fairness in Machine Learning (Fall 2017, University of California, Berkeley) for inspiring class discussions and comments on a presentation that was a precursor of this work. This material is based upon work supported by the National Science Foundation Graduate Research Fellowship under Grant No. DGE 1752814.
@inproceedings{ijcai2019p862,
  title     = {Delayed Impact of Fair Machine Learning},
  author    = {Liu, Lydia T. and Dean, Sarah and Rolf, Esther and Simchowitz, Max and Hardt, Moritz},
  booktitle = {Proceedings of the Twenty-Eighth International Joint Conference on
               Artificial Intelligence, {IJCAI-19}},
  publisher = {International Joint Conferences on Artificial Intelligence Organization},
  editor    = {Sarit Kraus},
  pages     = {6196--6200},
  year      = {2019},
  month     = {8},
  note      = {Best Sister Conferences},
  doi       = {10.24963/ijcai.2019/862},
  url       = {https://doi.org/10.24963/ijcai.2019/862},
}
TY - CPAPER TI - Delayed Impact of Fair Machine Learning AU - Liu, Lydia T. AU - Dean, Sarah AU - Rolf, Esther AU - Simchowitz, Max AU - Hardt, Moritz T2 - Proceedings of the Twenty-Eighth International Joint Conference on Artificial Intelligence, IJCAI-19 PB - International Joint Conferences on Artificial Intelligence Organization PY - 2019 SP - 6196 EP - 6200 DO - 10.24963/ijcai.2019/862 UR - https://doi.org/10.24963/ijcai.2019/862 ER -Copied
Machine-readable versions of this paper, for tools and AI agents:





