
VEST: A System for Vulnerability Exploit Scoring & Timing
Proceedings of the Twenty-Eighth International Joint Conference on Artificial Intelligence. Demos. Pages 6503-6505.
https://doi.org/10.24963/ijcai.2019/937
Keywords
- Applications: Security and surveillance
- Applications: Defense
- AI: Machine Learning
Abstract
Knowing if/when a cyber-vulnerability will be exploited and how severe the vulnerability is can help enterprise security officers (ESOs) come up with appropriate patching schedules. Today, this ability is severely compromised: our study of data from Mitre and NIST shows that on average there is a 132 day gap between the announcement of a vulnerability by Mitre and the time NIST provides an analysis with severity score estimates and 8 important severity attributes. Many attacks happen during this very 132-day window. We present Vulnerability Exploit Scoring \& Timing (VEST), a system for (early) prediction and visualization of if/when a vulnerability will be exploited, and its estimated severity attributes and score.
- [Bullough et al., 2017] Benjamin L Bullough, Anna K Yanchenko, Christopher L Smith, and Joseph R Zipkin. Predicting exploitation of disclosed software vulnerabil- ities using open-source data. In Proceedings of the 3rd ACM on International Workshop on Security And Privacy Analytics, pages 45-53. ACM, 2017.
- [Chen et al., 2019] Haipeng Chen, Rui Liu, Noseong Park, and V.S. Subrahmanian. Using twitter to predict when vulnerabilities will be exploited. In Proceedings of the ACM International Conference on Knowledge Discovery and DataMining (SigKDD). ACM, 2019.
- [Graves et al., 2014] Alex Graves, Greg Wayne, and Ivo Danihelka. Neural turing machines. arXiv preprint arXiv:1410.5401, 2014.
- [Khandpur et al., 2017] Rupinder Paul Khandpur, Taoran Ji, Steve Jan, Gang Wang, Chang-Tien Lu, and Naren Ra- makrishnan. Crowdsourcing cybersecurity: Cyber attack detection using social media. In Proceedings of the 2017 ACM on Conference on Information and Knowledge Man- agement, pages 1049-1057. ACM, 2017.
- [Kipf and Welling, 2016] Thomas N Kipf and Max Welling. Semi-supervised classification with graph convolutional networks. arXiv preprint arXiv:1609.02907, 2016.
- [Liao et al., 2016] Xiaojing Liao, Kan Yuan, XiaoFeng Wang, Zhou Li, Luyi Xing, and Raheem Beyah. Acing the ioc game: Toward automatic discovery and analysis of open-source cyber threat intelligence. In Proceedings of the 2016 ACM SIGSAC Conference on Computer and Communications Security, pages 755-766. ACM, 2016.
- [Lippmann et al., 2016] Richard P Lippmann, Joseph P Campbell, David J Weller-Fahy, Alyssa C Mensch, and William M Campbell. Finding malicious cyber discussions in social media. Technical report, 2016.
- [Sabottke et al., 2015] Carl Sabottke, Octavian Suciu, and Tudor Dumitras. Vulnerability disclosure in the age of so- cial media: Exploiting twitter for predicting real-world ex- ploits. In USENIX Security Symposium, pages 1041-1056, 2015.
- [Zong et al., 2019] Shi Zong, Alan Ritter, Graham Mueller, and Evan Wright. Analyzing the perceived severity of cybersecurity threats reported on social media. arXiv preprint arXiv:1902.10680, 2019.
References were extracted automatically from the PDF and may contain errors.
Full text extracted automatically from the PDF; figures, tables and equations may differ. The PDF is the version of record.
1 Introduction &Motivation
When a new cyber-vulnerability is discovered, a Common Vulnerability and Exposure (CVE) number is publicly assigned to it by a vulnerability number assigning authority like the MITRE Corporation. The vulnerability is then analyzed by the US National Institute of Standards and Technology (NIST) whose Common Vulnerability Scoring System (CVSS) provides both a severity score and 8 commonly adopted security attributes of the vulnerability. We studied 23 months of CVE numbers assigned by MITRE and found that NIST takes an average of 132 days to release CVSS.
Early knowledge of the severity and security properties of a vulnerability is critical for ESOs as it enables them to to take appropriate security actions (e.g., deactivate buggy software, prioritize patching). To this end, we present VEST (Vulnerability Exploit Scoring & Timing), a vulnerability analysis system consisting of two parts. The first part predicts if and when a CVE will be exploited by cyber attackers. The second part estimates the CVSS score and its associated 8 attributes released by NIST. Twitter discussions about CVEs are used by both predictors. The predicted results, along with other information related to a vulnerability, are visualized by a web-based user interface (UI).
2 The Problems & Solutions
VEST develops predictive models for two major problems.
First, we estimate if and when a CVE Will be exploited. From our extracted CVE-related Twitter discussion data, we propose a novel concept called CVE-Author-Tweet (CAT) graph, which captures the intrinsic inter-dependencies among the three types of entities in the graph. Based on the CAT graph, VEST automatically estimates a popularity score for each CVE, author and tweet. These unknown quantities are expressed as variables and a set of recursively defined equations are obtained from the CAT graph. The resulting popularity scores generate features that can be used to efficiently estimate if/when a CVE will be exploited. We show that VEST accurately predicts when real-world exploits of vulnerabilities emerge to ±11.90 days. A detailed description of this component could be found at [Chen et al., 2019].
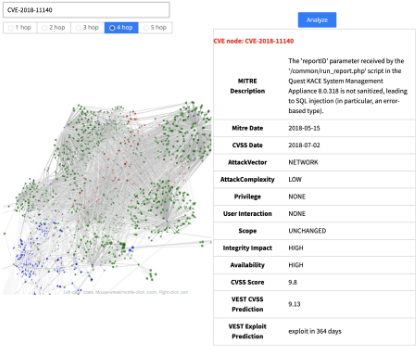
Second, we estimate CVSS severity scores & attributes. The second part of VEST is to automatically estimate the overall CVSS score of a vulnerability (which is on a 0-10 scale) as well as the values of the 8 severity attributes (cf. Fig. 3) produced by NIST as part of the CVSS report. To achieve this, we propose a novel attention-based feature embedding [Graves et al., 2014] method to extract useful latent features for each vulnerability from the Twitter discussion contents. Moreover, to exploit the intrinsic correlations among different vulnerabilities, we adopt a Graph Convolutional Network (GCN) [Kipf and Welling, 2016] approach to further improve the prediction. The embedded tweet content vector is fed into the GCN for a final prediction. Our predictor is able to accurately predict CVSS severity scores with a Mean Absolute Percentage Error (MAPE) of 0.18, using only 3 days of Twitter discussion data that is related to a CVE.
3 The Overall VEST SystemArchitecture
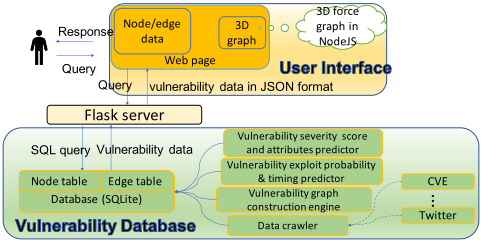
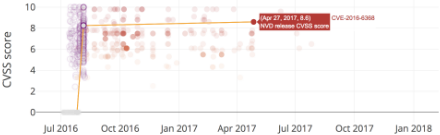
Fig. 1 shows the VEST architecture, which consists of a frontend UI and a back-end with a vulnerability database (VDB) and the two predictors. The two components are integrated via the Flask framework. A video of the UI's detailed description can be viewed online. 1 Fig. 2 shows one of the functions of the UI, which is used to visualize the performance of the prediction results for the CVSS severity score. The UI allows users to specify the time interval during which the CVEs are publicly released by MITRE, and then returns a set of relevant CVEs. The x-axis is the date on which the CVEs are released by MITRE, and the y-axis is the CVSS score. There are three types of circles for each CVE. E.g., Fig. 2 shows the three circles (linked by lines) of CVE-2018-11140. The grey circle on the bottom represents the date of release by MITRE. The same CVE is depicted as a hollow purple circle to represent the predicted CVSS score of the CVE by VEST. The 3rd type of circle is a solid red circle, which represents the ground truth CVSS score and the date it is released by NIST. Naturally, the color of a circle is darker if the predicted/groundtruth CVSS score is higher. The vertical gap between the purple and red circles visualizes the prediction error.
Users can also click on the CVE to see detailed information of that CVE, including the basic information from MITRE and NIST, the predicted results, and a 3d graph to visualize the popularity of the CVE on Twitter, as shown in Fig. 3. When the user selects a CVE via the UI, an SQL query is transmitted via the Flask framework to the VDB. The answer to the query is then returned to the UI for further visualization. Note that VEST does not make predictions when the user sends a query - rather, CVE information is updated daily. Thus, when a user asks about a specific CVE, that information can be quickly retrieved and served up in the UI.
The vulnerability database (maintained by SQLite) is updated daily via the following three modules. i) Data crawler. This module crawls CVE data from MITRE's CVE dataset 2 , CVSS related data from NVD 3 and vulnerability-related Twitter data. ii) CAT graph engine. This module builds out the CAT graph (c.f. Fig. 3) using the Twitter data, which consists of CVE, Author, Tweet nodes. Author-tweet edges connect authors to tweets they wrote, tweet-CVE and authorCVE edges connect tweets/authors to CVEs they mention, etc. iii) Vulnerability severity predictors. As described above, these two novel predictors use CVE-related Twitter discussions from the data crawler as well as the constructed CAT graph to make predictions. The predicted results are then updated and stored in the VDB, which can be queried from the UI via the Flask framework.
1 https://www.dropbox.com/sh/o81u50orfd35dtw/
AAAljqcBwi6eAjRiR9bxIxLSa?dl=0
2 https://cve.mitre.org/cve/
3 https://nvd.nist.gov/
4 RelatedWork
[Khandpur et al., 2017] uses Twitter to detect potential cyberattack events, while [Lippmann et al., 2016] does the same with Stack Exchange, Reddit, and Twitter data. [Liao et al., 2016] develops an automated feature content extraction engine to extract information from open sources such as technology blogs and forums and then tries to automatically identify cyber threats. Unlike [Zong et al., 2019] which predicts the severity of a vulnerability based on only one tweet and then returns the max severity of the vulnerability across all tweets that mention the vulnerability, our approach makes prediction based on a much larger set of tweets using GCNs with attention based feature embedding. In addition, we are also able to predict the various CVSS severity attributes of a vulnerability. Compared with [Sabottke et al., 2015; Bullough et al., 2017] which can only predict after NIST releases the CVSS scores (which are used as features in their predictor), our predictor makes a much earlier prediction using a suite of more advanced features, without using any prior information from NIST. Moreover, our predictor also predicts when, not only if a vulnerability will be exploited.
5 Conclusion
We presented VEST, a visualization tool for vulnerability severity-related scoring and exploit timing information. Using an integration of a powerful and novel vulnerability severity prediction engine and a flexible and interactive UI, VEST is able to serve a handy early analysis and warning system for cyber vulnerabilities.
Acknowledgements
This work is supported by ONR grants N00014-18-1-2670 and N00014-16-1-2896 and ARO grant W911NF-13-1-0421.
@inproceedings{ijcai2019p937,
  title     = {VEST: A System for Vulnerability Exploit Scoring & Timing},
  author    = {Chen, Haipeng and Liu, Jing and Liu, Rui and Park, Noseong and Subrahmanian, V. S.},
  booktitle = {Proceedings of the Twenty-Eighth International Joint Conference on
               Artificial Intelligence, {IJCAI-19}},
  publisher = {International Joint Conferences on Artificial Intelligence Organization},
  editor    = {Sarit Kraus},
  pages     = {6503--6505},
  year      = {2019},
  month     = {8},
  note      = {Demos},
  doi       = {10.24963/ijcai.2019/937},
  url       = {https://doi.org/10.24963/ijcai.2019/937},
}
TY - CPAPER TI - VEST: A System for Vulnerability Exploit Scoring & Timing AU - Chen, Haipeng AU - Liu, Jing AU - Liu, Rui AU - Park, Noseong AU - Subrahmanian, V. S. T2 - Proceedings of the Twenty-Eighth International Joint Conference on Artificial Intelligence, IJCAI-19 PB - International Joint Conferences on Artificial Intelligence Organization PY - 2019 SP - 6503 EP - 6505 DO - 10.24963/ijcai.2019/937 UR - https://doi.org/10.24963/ijcai.2019/937 ER -Copied
Machine-readable versions of this paper, for tools and AI agents:





