
Crowd View: Converting Investors' Opinions into Indicators
Proceedings of the Twenty-Eighth International Joint Conference on Artificial Intelligence. Demos. Pages 6500-6502.
https://doi.org/10.24963/ijcai.2019/936
Keywords
- AI: Natural Language Processing
- Applications: Finance
Abstract
This paper demonstrates an opinion indicator (OI) generation system, named Crowd View, with which traders can refer to the fine-grained opinions, beyond the market sentiment (bullish/bearish), from crowd investors when trading financial instruments. We collect the real-time textual information from Twitter, and convert it into five kinds of OIs, including the support price level, resistance price level, price target, buy-side cost, and sell-side cost. The OIs for all component stocks in Dow Jones Industrial Average Index (DJI) are provided, and shown with the real-time stock price for comparison and analysis. The information embedding in the OIs and the application scenarios are introduced.
- [Behrendt and Schmidt, 2018] Simon Behrendt and Alexan- der Schmidt. The twitter myth revisited: Intraday investor sentiment, twitter activity and individual-level stock return volatility. Journal of Banking & Finance, 96:355-367, 2018.
- [Bollen et al., 2011] Johan Bollen, Huina Mao, and Xiaojun Zeng. Twitter mood predicts the stock market. Journal of Computational Science, 2(1):1-8, 2011.
- [Chen et al., 2018] Chung-Chi Chen, Hen-Hsen Huang, Yow-Ting Shiue, and Hsin-Hsi Chen. Numeral under- standing in financial tweets for fine-grained crowd-based forecasting. In 2018 IEEE/WIC/ACM International Con- ference on Web Intelligence (WI), pages 136-143. IEEE, 2018.
- [Chen et al., 2019] Chung-Chi Chen, Hen-Hsen Huang, Chia-Wen Tsai, and Hsin-Hsi Chen. Crowdpt: Summariz- ing crowd opinions as professional analyst. In The World Wide Web Conference, pages 3498-3502. ACM, 2019.
- [Fan et al., 2017] Zhi-Ping Fan, Yu-Jie Che, and Zhen-Yu Chen. Product sales forecasting using online reviews and historical sales data: A method combining the bass model and sentiment analysis. Journal of Business Research, 74:90-100, 2017.
- [Jame et al., 2016] Russell Jame, Rick Johnston, Stanimir Markov, and Michael C Wolfe. The value of crowd- sourced earnings forecasts. Journal of Accounting Re- search, 54(4):1077-1110, 2016.
- [Nguyen et al., 2015] Thien Hai Nguyen, Kiyoaki Shirai, and Julien Velcin. Sentiment analysis on social media for stock movement prediction. Expert Systems with Applica- tions, 42(24):9603-9611, 2015.
- [Oliveira et al., 2017] Nuno Oliveira, Paulo Cortez, and Nel- son Areal. The impact of microblogging data for stock market prediction: using twitter to predict returns, volatil- ity, trading volume and survey sentiment indices. Expert Systems with Applications, 73:125-144, 2017.
- [Reboredo and Ugolini, 2018] Juan C Reboredo and Andrea Ugolini. The impact of twitter sentiment on renewable energy stocks. Energy Economics, 76:153-169, 2018.
- [Sul et al., 2017] Hong Kee Sul, Alan R Dennis, and Lingyao Yuan. Trading on twitter: Using social media sentiment to predict stock returns. Decision Sciences, 48(3):454-488, 2017.
- [Yu et al., 2012] Xiaohui Yu, Yang Liu, Xiangji Huang, and Aijun An. Mining online reviews for predicting sales per- formance: A case study in the movie domain. IEEE Trans- actions on Knowledge and Data engineering, 24(4):720- 734, 2012.
References were extracted automatically from the PDF and may contain errors.
Full text extracted automatically from the PDF; figures, tables and equations may differ. The PDF is the version of record.
1 Introduction andMotivation
Over the past decade, sentiment analysis toward the textual data on Twitter is one of the hot research topics. Many researchers explore the impacts of the sentiment on different themes, including movie sales [Yu et al., 2012], product sales [Fan et al., 2017], and stock price movement [Bollen et al., 2011]. We find that the influence of the crowd sentiment on predicting stock price is diminishing. Formerly, several works showed that the sentiment of social media users was significantly correlated to the stock price movement [Bollen et al., 2011; Nguyen et al., 2015; Oliveira et al., 2017; Sul et al., 2017]. However, some recent works indicated that the sentiment may not be useful for trading the stocks [Reboredo and Ugolini, 2018; Behrendt and Schmidt, 2018]. This phenomenon points out an important issue that only capturing the sentiment information is not enough for trading.
Recently, more and more researchers attempt to mine the fine-grained information from the crowd such as earning expectations [Jame et al., 2016] and price target [Chen et al., 2018], and get the positive results for market information prediction. These results indicate that fine-grained analysis toward crowd opinions is promising.
In this paper, we demonstrate an OI generation system for traders 1 , providing five novel indicators, called opinion indicators, which contain fine-grained opinions of crowd investors. Unlike the previous platforms such as Estimize, which ask users to fill a form and conduct an analysis based on the received structured data, our OIs are constructed by using the real-time textual data, which is unstructured and written in informal style. We discuss the information embedding in OIs and the the usefulness of our OIs in Sections 2.2. The empirical studies in Section 2.3 show that the extracted OIs are promising.
1 https://ntu-nlp.shinyapps.io/crowdview/
2 Crowd View
2.1 SystemOverview
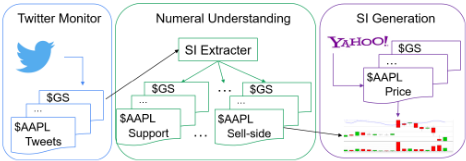
Figure 1 illustrates the architecture of our system. First, we monitor Twitter via tweepy to collect the tweets related to the component stocks of DJI with the cashtags (e.g., $GS stands for the stock of Goldman Sachs Group Inc.). Then, we extract the numerals related to the proposed five OIs, and order the extracted data. We explore several CNN-based and RNN-based architectures with character and word embeddings [Chen et al., 2018] to design the OI extractor and find that the word-based CNN architecture outperforms the other models. In the demo system, we adopt the word-based CNN architecture to construct our OI extracter with the pretrained financial social media token embeddings and the feature embeddings. The experimental results for each indicator are shown in our previous paper [Chen et al., 2019]. After converting the textual data into structured data, we visualize the informative numerals as indicators for the comparison with the real-time stock prices in the price chart. We use 5-day moving average to smooth the OIs. The stock prices are collected from Yahoo Finance with quantmod.
The proposed OIs assimilate the analysis results of the crowd investors from different aspects. Our system orders the textual information into price chart for traders to capture the opinions of the crowd investors at a glance.
2.2 Application Scenario
We had shown that the price targets of crowd investors are comparable and complementary to the price targets of institutional investors in our previous work [Chen et al., 2018]. In this paper, we focus on the details of the other four OIs, and verify the informativeness of these four OIs.
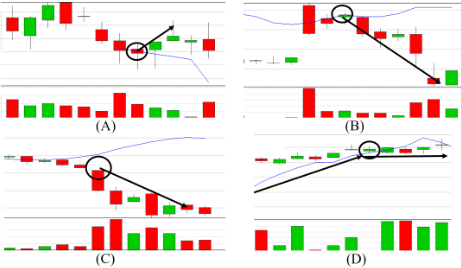
Figure 2 (A) and (B) show the expected support price of $PG and the predicted resistance price of $GE with the stock price, respectively. Both figures provide the evidences to support the postulation: the price will rebound (reverse) when it reaches the support (resistance) price level.
The information behind the cost of investors is more complex. If the stock price goes far away from the buy-side (sellside) cost, the long (short) investors may close their positions to stop loss. For those leverage with lending (borrowing), the long (short) investors may get the margin call (forced liquidation) that compels them to close their positions or make up their deposits. In this situation, the price may collapse (soar), due to the dump (heavy buying) of the investors. Figure 2 (C) shows the buy-side cost and the real-time price of $UNH. This is an example of the leading collapse signal provided by our buy-side cost indicator. Most of the time, stock market is in the correction, which means that the volatility of the price is small. During the correction, the stock price and the cost of the buy-side (sell-side) investors will converge. Figure 2 (D) is an instance for this phenomenon, where the sell-side cost of $AAPL converges to its stock price.
2.3 Empirical Study
We further test the informativeness of the OIs. When the distributions of the conditional returns are different from the distributions of the unconditional returns, the proposed OIs could provide extra information for trading. On the other hand, when both distributions are similar, OIs do not increase the information for the trading. The conditions for each OI are shown as follows:
- Support price level: rt-d,t < 0 and |gt| < α
- Resistance price level: rt-d,t > 0 and |gt| < α
- Buy-side cost: gt < -G
- Sell-side cost: gt > G
| α s | 3 | 5 | 10 |
|---|---|---|---|
| 0.005 | 66.67/ 19.23 | 60.00/ 29.17 | 40.00/ 21.74 |
| 0.010 | 44.44/ 35.09 | 29.17/ 30.19 | 30.00/ 24.49 |
| 0.015 | 14.64/ 18.18 | 18.92/ 22.34 | 18.75/ 20.00 |
| G s | 3 | 5 | 10 |
|---|---|---|---|
| 0.03 | 4.82/ 3.23 | 8.87/ 6.23 | 8.33/ 5.26 |
| 0.04 | 8.90/ 3.58 | 5.68/ 5.63 | 8.66/ 3.86 |
| 0.05 | 3.13/ 2.22 | 7.60/ 3.18 | 12.50/ 5.85 |
, where rt-d,t = (ct -ct-d)/ct-d is the return between t-d and t; ct stands for the close price of t; gt = ct - oit is the gap between close price and selected OI (oi) on t; d = 5; α and G are hyperparameters.
We test on all component stocks in DJI, and use the data from 2018/10/28 to 2019/02/05 with moving window analysis. The rt,t+s is calculated, after the conditions are fulfilled. Assume there are n conditional returns, we randomly select the same number of unconditional returns in the data for comparison. The Kolmogorov-Smirnov test (KS-test) is adopted for evaluation with 95% confidence level. Table 1 and Table 2 show the results of our experiments. The OIs related to the analysis results of crowd investors (support and resistance price level) provide the incremental information for short-term (3- and 5-day) trading, and the OIs constructed by the cost of crowd investors (buy-side and sell-side cost) furnish trader with additional long-term (10-day) information.
3 Summary
Due to the diminishing impact of the sentiment analysis in market movement prediction, more fine-grained analysis toward crowd opinions becomes an essential task. To this end, we demonstrate a real-time OI generation system for traders with five novel OIs, which are constructed by using the textual data crawled from Twitter. The application scenarios show that the proposed OIs are leading indicators for stock price movement prediction, and the empirical studies indicate that the fine-grained information from crowd investors contains the additional information for both short-term and long-term trading.
Many potential researches such as the impact toward the volatility and the financial derivatives like futures and options can be explored based on our OIs.
Acknowledgments
This research was partially supported by Ministry of Science and Technology, Taiwan, under grants MOST-106-2923E-002-012-MY3, MOST-107-2634-F-002-011-, MOST-1082634-F-002-008-, and MOST 107-2218-E-009-050-, and by Academia Sinica, Taiwan, under grant AS-TP-107-M05.
@inproceedings{ijcai2019p936,
  title     = {Crowd View: Converting Investors' Opinions into Indicators},
  author    = {Chen, Chung-Chi and Huang, Hen-Hsen and Chen, Hsin-Hsi},
  booktitle = {Proceedings of the Twenty-Eighth International Joint Conference on
               Artificial Intelligence, {IJCAI-19}},
  publisher = {International Joint Conferences on Artificial Intelligence Organization},
  editor    = {Sarit Kraus},
  pages     = {6500--6502},
  year      = {2019},
  month     = {8},
  note      = {Demos},
  doi       = {10.24963/ijcai.2019/936},
  url       = {https://doi.org/10.24963/ijcai.2019/936},
}
TY - CPAPER TI - Crowd View: Converting Investors' Opinions into Indicators AU - Chen, Chung-Chi AU - Huang, Hen-Hsen AU - Chen, Hsin-Hsi T2 - Proceedings of the Twenty-Eighth International Joint Conference on Artificial Intelligence, IJCAI-19 PB - International Joint Conferences on Artificial Intelligence Organization PY - 2019 SP - 6500 EP - 6502 DO - 10.24963/ijcai.2019/936 UR - https://doi.org/10.24963/ijcai.2019/936 ER -Copied
Machine-readable versions of this paper, for tools and AI agents:





