
Real-Time Pricing Optimization for Ride-Hailing Quality of Service
Proceedings of the Thirtieth International Joint Conference on Artificial Intelligence. Main Track. Pages 3742-3748.
https://doi.org/10.24963/ijcai.2021/515
Keywords
- Multidisciplinary Topics and Applications: Real-Time Systems
- Multidisciplinary Topics and Applications: Transportation
Abstract
When demand increases beyond the system capacity, riders in ride-hailing/ride-sharing systems often experience long waiting time, resulting in poor customer satisfaction. This paper proposes a spatio-temporal pricing framework (AP-RTRS) to alleviate this challenge and shows how it naturally complements state-of-the-art dispatching and routing algorithms. Specifically, the pricing optimization model regulates demand to ensure that every rider opting to use the system is served within reason-able time: it does so either by reducing demand to meet the capacity constraints or by prompting potential riders to postpone service to a later time. The pricing model is a model-predictive control algorithm that works at a coarser temporal and spatial granularity compared to the real-time dispatching and routing, and naturally integrates vehicle relocations. Simulation experiments indicate that the pricing optimization model achieves short waiting times without sacrificing revenues and geographical fairness.
- [Alonso-Mora et al., 2017] Javier Alonso-Mora, Samitha Samaranayake, Alex Wallar, Emilio Frazzoli, and Daniela Rus. On-demand high-capacity ride-sharing via dynamic trip-vehicle assignment. Proceedings of the National Academy of Sciences, 114(3):462-467, 2017.
- [Banerjee et al., 2015] Siddhartha Banerjee, Ramesh Johari, and Carlos Riquelme. Pricing in ride-sharing platforms: A queueing-theoretic approach. In Proceedings of the Six- teenth ACM Conference on Economics and Computation, EC '15, page 639, New York, NY, USA, 2015. Association for Computing Machinery.
- [Bimpikis et al., 2019] Kostas Bimpikis, Ozan Candogan, and Daniela Saban. Spatial pricing in ride-sharing net- works. Operations Research, 67(3):744-769, 2019.
- [Braverman et al., 2019] Anton Braverman, J. G. Dai, Xin Liu, and Lei Ying. Empty-car routing in ridesharing sys- tems. Operations Research, 67(5):1437-1452, 2019.
- [Cachon et al., 2017] Gérard P. Cachon, Kaitlin M. Daniels, and Ruben Lobel. The role of surge pricing on a service platform with self-scheduling capacity. Manufacturing & Service Operations Management, 19(3):368-384, 2017.
- [Castillo et al., 2017] Juan Camilo Castillo, Dan Knoepfle, and Glen Weyl. Surge pricing solves the wild goose chase. In Proceedings of the 2017 ACM Conference on Eco- nomics and Computation, EC '17, pages 241-242, New York, NY, USA, 2017. Association for Computing Ma- chinery.
- [Chen and Hu, 2020] Yiwei Chen and Ming Hu. Pricing and matching with forward-looking buyers and sellers. Manu- facturing & Service Operations Management, 22(4):717- 734, 2020.
- [Gurobi Optimization, 2020] LLC Gurobi Optimization. Gurobi optimizer reference manual, 2020.
- [Hall et al., 2015] Jonathan Hall, Cory Kendrick, and Chris Nosko. The effects of uber's surge pricing: A case study. http://www.nyc.gov/html/tlc/html/about/trip record data.shtml, 2015. Link
- [Iglesias et al., 2017] Ramón Iglesias, Federico Rossi, Kevin Wang, David Hallac, Jure Leskovec, and Marco Pavone. Data-driven model predictive control of autonomous mobility-on-demand systems. CoRR, abs/1709.07032, 2017.
- [Lei et al., 2019] C. Lei, Zhoutong Jiang, and Yanfeng Ouyang. Path-based dynamic pricing for vehicle alloca- tion in ridesharing systems with fully compliant drivers. Transportation research procedia, 38:77-97, 2019.
- [Ma et al., 2019a] Hongyao Ma, Fei Fang, and David C. Parkes. Spatio-temporal pricing for ridesharing platforms. In Proceedings of the 2019 ACM Conference on Eco- nomics and Computation, EC '19, page 583, New York, NY, USA, 2019. Association for Computing Machinery.
- [Ma et al., 2019b] Tai-Yu Ma, Saeid Rasulkhani, Joseph Y.J. Chow, and Sylvain Klein. A dynamic ridesharing dis- patch and idle vehicle repositioning strategy with inte- grated transit transfers. Transportation Research Part E: Logistics and Transportation Review, 128:417 -442, 2019.
- [NYC, 2019a] NYC. Nyc taxi & limousine commission - trip record data. https://www1.nyc.gov/site/tlc/passengers/ taxi-fare.page, 2019. Accessed: 2020-10-01. Link
- [NYC, 2019b] NYC. Nyc taxi & limousine commission - trip record data. https://www1.nyc.gov/site/tlc/passengers/ taxi-fare.page, 2019. Accessed: 2020-10-01. [OpenStreetMap, 2017] OpenStreetMap. Openstreetmap. https://www.openstreetmap.org, 2017. Accessed: 2020- 10-01. Link
- [Ozkan, 2020] Erhun Ozkan. Joint pricing and matching in ride-sharing systems. European Journal of Operational Research, 287, 05 2020.
- [Qiu et al., 2018] Han Qiu, R. Li, and J. Zhao. Dynamic pricing in shared mobility on demand service. arXiv: Op- timization and Control, 2018.
- [Riley et al., 2019] Connor Riley, Antoine Legrain, and Pas- cal Van Hentenryck. Column generation for real-time ride- sharing operations. In CPAIOR, 2019.
- [Riley et al., 2020] Connor Riley, Pascal van Hentenryck, and Enpeng Yuan. Real-time dispatching of large-scale ride-sharing systems: Integrating optimization, machine learning, and model predictive control. In Proceedings of the Twenty-Ninth International Joint Conference on Arti- ficial Intelligence, IJCAI-20, 7 2020. Special track on AI for CompSust and Human well-being. IJCAI
- [Sayarshad and Chow, 2017] Hamid R. Sayarshad and Joseph Y.J. Chow. Non-myopic relocation of idle mobility-on-demand vehicles as a dynamic location- allocation-queueing problem. Transportation Research Part E: Logistics and Transportation Review, 106:60 -77, 2017.
- [Zha et al., 2017] Liteng Zha, Yafeng Yin, and Zhengtian Xu. Geometric matching and spatial pricing in ride- sourcing markets. Transportation Research Part C Emerg- ing Technologies, 92:58-75, 01 2017.
References were extracted automatically from the PDF and may contain errors.
Full text extracted automatically from the PDF; figures, tables and equations may differ. The PDF is the version of record.
1 Introduction
Transportation Network Companies (TNCs) like Uber and Lyft have fundamentally transformed mobility in many cities, providing on-demand door-to-door transportation through mobile applications. While such ride-hailing/ride-sharing services provide new mobility options for a range of customers, they also face many operational challenges. This paper considers one of these critical challenges: how to address an imbalance between demand and supply due to a surge in the number of requests. When such an imbalance is present, riders often experience long waiting times. This hurts both the platform and riders: potential riders incur an opportunity cost by waiting and the platform receives poor customer reviews. Idle vehicle relocation (e.g., [Iglesias et al., 2017; Sayarshad and Chow, 2017; Braverman et al., 2019; Ma et al., 2019b; Riley et al., 2020]) is one way to alleviate this issue: empty vehicles are relocated preemptively to places where they will be most needed to reduce waiting times. Another way to tackle the imbalance is to build mobility systems that utilize ride-sharing systematically. A study by Alonso-Mora et al. [2017] showed that systematic ride-sharing may significantly reduce the number of vehicles needed to serve requests. Their results indicate that 98% of the historic demand for taxi services in NYC could be served with a much smaller taxi fleet, while maintaining short wait times. However, vehicle relocation and ride-sharing on their own are not always sufficient to address the imbalance. Consider a state-of-theart ride-sharing framework A-RTRS ([Riley et al., 2020]) when applied to a 90-minute Yellow Taxi instance in New York City [NYC, 2019a]. A-RTRS routes and dispatches vehicles every 30 seconds, and it uses a model-predictive control algorithm to perform vehicle relocation every 5 minutes. Table 1 reports the average waiting times when a 30-minute peak with 17%, 24%, 31%, and 38%more requests is inserted into the instance. The results show that average waiting times rise dramatically as the peak becomes stronger.
| Peak Demand Percentage | ||||
|---|---|---|---|---|
| 17% | 24% | 31% | 38% | |
| Average Waiting Time | 7.86 | 10.70 | 13.93 | 15.34 |
| Standard Deviation | 3.75 | 6.30 | 8.24 | 8.45 |
Pricing is also commonly used to address demand and supply imbalances: for instance, Uber's surge pricing and Lyft's Prime time pricing both raise prices to curtail excessive demand. While this may upset some customers, empirical evidence shows that it is effective at restoring demand-supply balance in the market [Hall et al., 2015]. It is not clear, however, how these pricing schemes affect average waiting times and whether they introduce unfairness in quality of service for various regions.
This paper is a first step in understanding the relationship between demand and supply imbalances, pricing, average waiting times, and geographical quality of service. It extends A-RTRS with a real-time spatio-temporal pricing mechanism to restore service quality during peak times. The goal of the framework, called AP-RTRS, is to decrease or postpone the demand to ensure that each rider is served within a reasonable amount of time and, ideally, that there are no significant regional differences in quality of service. More specifically, AP-RTRS features a novel optimization model for its Model Predictive Control (MPC) component that jointly optimizes pricing and relocation over time. The AP-RTRS framework makes three key contributions. First, while many existing works explore the effect of pricing in the long term (e.g., at market equilibrium), very few studies examines its realtime consequences when demand fluctuates both spatially and temporally. This paper thus provides a detailed analysis of the real-time effects of pricing when integrated into an endto-end ride-sharing framework. Second, while many papers study trip throughput rate, revenue, and buyer/seller surplus, to our knowledge, AP-RTRS is the first pricing framework that focuses on controlling waiting times and request completion rate. Third, AP-RTRS includes a novel dynamic pricing mechanism that also encourages riders to use the service at a later time through discounting. Discounting is appealing as it enables AP-RTRS to level small peaks off without pricing out customers. These benefits of AP-RTRS are demonstrated on large-scale NYC taxi instances.
This rest of the paper is organized as follows. Section 2 specifies the problem. Section 3 gives an overview of the existing literature. Section 4 introduces the overall architecture of AP-RTRS. Section 5 introduces the novel pricing and relocation model and Section 6 presents a simulation study using real data from New York City.
2 ProblemDefinition
Operating a real-time ride-sharing system requires the solving of large-scale dial-a-ride and pricing problems. Each request corresponds to a trip for a number of riders from an origin to a destination that must take place after a specified pickup time. In addition, riders are only willing to wait for a certain period of time after which they seek another mode of transportation. The goal of AP-RTRS is to regulate demand with pricing so that all riders choosing to use the service are picked up in a given time span. The platforms studied in this paper either use a fixed fleet of autonomous vehicles or their own pool of drivers who follow routing instructions exactly. The system can thus relocate the vehicles at will in order to anticipate demand. It is assumed that significant historical data is available and can be used to forecast demand.
3 Literature Review
The impact of spikes in demand in a ride-hailing market is highlighted in Hall et al. [2015] using Uber data. When surge pricing was disactivated during New Year's Eve, rider waiting time and driver enroute time increased significantly and trip completion rates dropped dramatically. This phenomenon was further studied by Castillo et al. [2017] who modeled the ride-sharing system as a steady-state queuing network. The authors demonstrated that, when demand exceeds supply capacity, drivers from distant areas are dispatched, resulting in long enroute time and low utilization rates (the so-called Wild Goose Chase phenomenon). The paper shows that dynamic pricing can prevent the market from entering to this inefficient state by balancing demand and supply.
Among the vast literature on dynamic pricing in ridehailing, many papers study optimality of different pricing policies and their impact on revenue and trip throughput rates.
However, most of the discussions are restricted to a simplified setting where demand is homogeneous over time (e.g., [Banerjee et al., 2015; Cachon et al., 2017; Zha et al., 2017; Bimpikis et al., 2019; Ozkan, 2020]). Others consider demand to be invariant over both time and space (e.g., [Castillo et al., 2017; Chen and Hu, 2020]). In comparison, relatively few papers focus on a real-time setting where demand fluctuates both spatially and temporally. Ma et al. [2019a] proposed a spatio-temporal pricing mechanism (STP) that induces the drivers to always follow the platform's dispatch decisions. Their model maximizes system benefits in a finite time horizon and determines both dispatching and pricing for drivers and riders, assuming complete knowledge about the future. Lei et al. [2019] modeled the interaction between the platform's dispatching and pricing decisions and traveler's choice as a Stackelberg leader-follower game. They formulated a multi-period mathematical program with equilibrium constraints (MPEC) to derive idle vehicle relocation and pathbased pricing decisions and solved it by approximate dynamic programming (ADP). Qiu et al. [2018] also employs dynamic programming approach to find optimal pricing policies with stochastic demand arrival. Their goal is to determine a price for each travel mode offered by the platform to maximize expected operating profit in a given time horizon. Although these works are developed in a real-time setting, there is no explicit control of the waiting times or the request completion rate. The MPC optimization proposed in this paper guarantees service quality, distinguishing it from prior work. The most related work to this paper is the A-RTRS framework of Riley et al. [2020] where a MPC model is developed to relocate idle vehicle in real-time. AP-RTRS replaces the MPC component of A-RTRS with a new optimization model that jointly decides idle vehicle relocation and pricing for each region over the MPC time horizon. Because of pricing, the demand becomes a variable in AP-RTRS. Moreover, the MPC model in AP-RTRS keeps track of waiting times to capture the behaviour of riders and discounting.
4 The Real-Time Ride-Sharing Framework
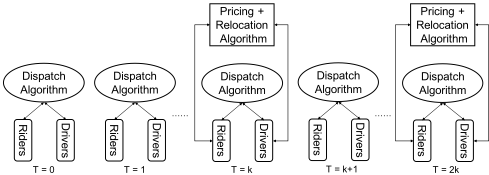
AP-RTRS, depicted in Figure 1, is composed of two main components: an optimization model for vehicle dispatching and routing and an MPC optimization for pricing and relocation. The vehicle dispatching and routing matches vehicles and riders, and chooses the vehicle routes. It operates at the request level and takes place in real time (e.g., every 30 seconds). Because of the tight time constraint, the routing and dispatching optimization is usually myopic, taking into account only current demand and supply information Pricing and idle vehicle relocation, on the other hand, are forward-looking and performed at a lower frequency (e.g., every 5 - 20 minutes). The two decisions are also interdependent: the relocation decisions depend on the demand, and the requests to admit depends on the vehicle availabilities. As a result the MPC jointly optimizes them.
5 Pricing and Relocation
The MPC for pricing and relocation operates over a rolling time horizon and optimizes the decisions over a fixed time window for every epoch. Specifically, time is discretized into epochs of equal length and, during each epoch, the MPC performs three tasks: (1) it predicts the demand and supply for the next T epochs; (2) it optimizes decisions over these epochs; and (3) it implements the decisions of the first epoch. Due to potentially large number of vehicles and riders in realtime, deriving pricing and relocation decisions on the individual level is computationally challenging. The MPC operates at a coarser temporal and spatial granularity: it partitions the geographical area into zones (not necessarily of equal size or shape) and considers pricing/relocation decisions on the zone-to-zone level. The resulting model is scale-invariant with respect to the number of individual riders and vehicles.
Terminology and Notations. The time when a rider connects to the platform and observes the price is called the emerging time. The time selected by a rider to use the service is called the realization time. It is either the emerging time or a later time selected by a rider due to discounting. The realization time is also when the platform schedules the request. The service time is the time when a rider is picked up. The difference between realization time and service time is the waiting time. A rider not served after s epochs from their realization time is called a dropout. The length of one epoch is denoted by l and the set of epochs in the MPC time horizon T = {1, ..., T}. The set of zones is denoted by Z.
Price Offers and Price/Demand Feedback. At each epoch t ∈ T , AP-RTRS determines the price offers (¯ pijtt, ¯ pijt(t+1), ..., ¯ pijtT ) of requests between zone i and zone j for all epochs in [t, T]. A rider emerging at epoch t (i.e., between [(t - 1)l, tl]) observes the price offer, and decides whether and when to use the service. If the rider decides not to use the service, she is assumed to exit the market and does not return. Otherwise, she reveals the realization time to the platform which commits to the price. For instance, a rider traveling from i to j, emerging at t, and deciding to use the service at τ will be charged ¯ pijtτ , even though the price for τ may change between epoch [t, τ]. Note that τ is the epoch when the rider starts to be scheduled and not necessarily the epoch in which she is picked up. Given a price offer ⃗ pijt = (¯ pijtt, ¯ pijt(t+1), ..., ¯ pijtT ), the platform can estimate the corresponding demand pattern, i.e., the expected demand ⃗ dijt = (dijtt, dijt(t+1), ..., dijtT ) between epoch [t, τ]. The focus of this paper is not on how to estimate the demand pattern from historical data; rather the paper describes how to select the optimal demand pattern in the MPC.
Service Constraints. In the MPC, vehicles only pick up riders in the same zone. Once a vehicle starts to serve riders or relocate, it must finish the trip before taking another assignment. These assumptions are chosen so that the MPC approximates how the underlying routing/dispatch algorithm works, but the dispatch algorithm does not necessarily obey these constraints.
5.1 The MPCModel Formulation
The overarching goal of the MPC model is to regulate demand such that all riders who choose to use the mobility system are served. One way to meet this goal is to constrain all such riders to be served in the MPC time horizon. However, this might be impossible since those arriving near the end would have little flexibility. For this reason, the MPC focuses on serving those riders emerging in the first T - s + 1 epochs: these riders have at least s epochs available to be served if not postponed. The goal of the MPC model is thus to choose a demand pattern for each zone and epoch to meet these service guarantees. When there are multiple (combination of) demand patterns to achieve this goal, the MPC model selects the combination serving the most people. This is the fundamental design philosophy behind the MPC model.
The optimization model is presented in Figure 2. In the model, i, j denote zones and t, τ, ρ epochs. The model inputs are as follows. Vit is the number of vehicles that will become idle in zone i during epoch t: those vehicles are busy now but will become available in t. {⃗ dkijt }Nij k=1 is the set of available demand patterns for O-D pair (i, j) at t. Wij is ride-sharing coefficient: it represents the average number of passengers traveling from i to j that a vehicle typically carries accounting for the fact that a request may have multiple passengers and that a vehicle may pick up multiple requests. ηij is the travel time from i to j in seconds, and λij is the same travel time but in epochs. Inputs ηij and λij depend on traffic condition and can be estimated in real-time. In addition, the optimization model uses qp (t, τ, ρ) to weight a customer served at ρ who emerges at t and decides to use the service at τ. This weight is chosen to drive the model to serve people as early as possible and qp should be decreasing in ρ. Riders who emerge and realize early should carry larger reward since uncertainty about the future grows over time. qr (t) is the per-second relocation penalty for epoch t and should be decreasing in t for the same reason.
Decision variable pkijt captures the pricing decision: it is a binary variable indicating whether demand pattern k, ⃗ dkijt , of O-D pair (i, j) and epoch t is selected. Decision variable xrijt captures the other important decision: it denotes the number of vehicles starting to relocate from i to j during epoch t (j ̸= i). Auxiliary variable xpijtτρ denotes the number of vehicles that start to serve riders from i to j in ρ who emerge at t and decide to use the service in τ. Auxiliary variable vijtτ denotes the number of vehicles needed to serve all expected passengers traveling from i to j who emerge in t and decide to use the service in τ. Auxiliary variable zit denotes number of vehicles in zone i that are assigned to remain in the zone from t - 1 to t. The model only implements the decisions of pij1 and xrij1 ; the other variables serve to provide an
Figure 2: The MPC Optimization with Pricing and Relocation.
approximation of the future.
It is important to mention that the variables are only defined for a subset of the subscripts given that riders drop out if not served in reasonable time. In particular, the valid subscripts for variables xpijtτρ must satisfy the constraint
Similar considerations apply to vijtτ . These conditions are implicit in the model for simplicity.
The model is a mixed integer linear program (MILP). Its objective maximizes the weighted sum of customers served and minimizes the relocation cost. Constraint (2a) ensures that the model selects exactly one price offer (and hence one demand pattern) for each O-D pair and epoch. Constraint (2b) derives the number of vehicles needed to serve the demand from i to j emerging at t and realized at τ as a function of the price selected (captured by variable pkijt ). Constraint (2c) enforces the service guarantees: it makes sure that passengers emerging in the first (T - s + 1) epochs are served in the time horizon, regardless of their realization time. Constraint (2d) makes sure that served demand does not exceed the true demand. Constraint (2e) and (2f) are the flow balance constraint for each zone and epoch: They make sure that, at every epoch t, the number of vehicles departing from zone i in t or staying idle in zone i is equal to the number of vehicles arriving in zone i plus the number of idle vehicles. Note that vehicles need to depart from zone j in t-λji to arrive at zone i in t. Constraints (2g) - (2i) specify range of the variables. Constraint (2a) is for all (i, j, t), (2b) - (2d) for all (i, j, t, τ), (2e) for all i and (2f) for all (i, t), where the subscripts are in the specified range. The model is always feasible when demand vijtτ can be reduced to 0.
Discussion. The formulation assumes that the platform can postpone customers to any epoch within the time horizon. If the horizon is long, the platform may choose to postpone only a few epochs by restricting the range of τ to [t, t + u] in the variables xpijtτρ and uijtτρ, where u is the maximum number of epochs a rider can be postponed. The case u = 0 corresponds to surge pricing which only assigns a price to the current epoch. Another important consideration is model complexity. In theory, longer time window and more demand patterns enable finer control and yield better results. However, they also increase size of the model which needs to be solved in real time.
6 Simulation Study
The performance of AP-RTRS is evaluated using Yellow Taxi trip data in Manhattan, New York City [NYC, 2019a]. The Manhattan area is partitioned into a grid of cells of 200 squared meter, and each cell represents a pickup/dropoff location. Travel time between the cells are queried from [OpenStreetMap, 2017]. The fleet is fixed to be 1500 vehicles with capacity 4, distributed randomly among the cells at the beginning of the simulation. The test data is generated based on Yellow Taxi trip data on 12/30/2015, 7.00am to 8.00am, scaled up proportionally to the number of requests between each Origin-Destination (O-D) cells to contain on average 1400 requests per 5 minutes. Peaks of various kinds are inserted into the instance as discussed later on, in order to test the AP-RTRS's ability to enforce the service guarantees and serve riders in reasonable time.
Simulation Environment. The end-to-end simulation to evaluate AP-RTRS is based on [Riley et al., 2020]. The vehicle routing and dispatching is run every 30 seconds. It is solved by a column generation approach that iterates between solving a restricted master problem (RMP), which assigns a route to each vehicle, and a subproblem, which generates feasible routes for the vehicles satisfying vehicle capacity and ride duration constraints [Riley et al., 2019]. The MPC module has two components: the pricing/relocation model and a vehicle assignment model. The pricing/relocation model (Figure 2) is run every 5 minutes and given 30 seconds of solving time (it needs to output relocation decisions before the next dispatch). The pricing decisions are implemented in terms of percentages instead of absolute magnitude. For example, if the model decides to postpone 20 expected customers out of 50, the simulation will randomly select 40% observed requests in the next epoch to be postponed. The reason is that the model works with predicted demand and there may not be 50 customers in the next epoch. The relocation decisions are implemented by the vehicle assignment optimization, which is run immediately after the pricing/relocation model. It determines which actual vehicles to relocate by minimizing total traveling distances. Each request in the simulation is given a maximum scheduling time of 5 minutes and a maximum waiting time of 15 minutes. A request for which one of these deadlines is not met are considered a dropout and removed from the simulation.
Configuration of The PricingModel. TheManhattan area is partitioned into |Z| = 73 zones and each cell is assigned to the closest zone. The travel times λij (in epochs) between the zones are computed by averaging travel times between all cell pairs in the two zones. Time is discretized into epochs of l = 5 minutes. The pricing model is run every 5 minutes and has a time horizon of T = 4 epochs. Demand predictions for each O-D pair in each epoch is generated by adding white noise to the true demand. The white noise is normally distributed with zero mean and a standard deviation equal to 2.5% of the true demand. The forecasting module is agnostic about the peak until the second period of the peak and about the end of the peak until the second period after the peak. This captures the fact that peaks cannot always be anticipated. The number of idle vehicles in each period is estimated by the simulator based on current route of each individual vehicle and the travel times. Ride-share ratio is set to be Wij = 1.4 for all i, j ∈ Z. Service weight and relocation penalty functions are as follows: qp (t, τ, ρ) = 0.5t 0.75τ-t 0.67ρ-τ , and qr (t) = 0.001 ∗ 0.5t . The model is solved (optimally or near optimally) by Gurobi 9.0 in 30 seconds with 32 CPU cores [Gurobi Optimization, 2020].
TestedModels. The experiments compare threeMPCmodels: RELOCATION, SURGE, and SURGE+POSPTPONE. RELOCATION is the baseline and has no pricing component: it implements the formulation in Figure 2 with demand fixed to the predicted demand and without requiring that the demand emerging in the first T - s + 1 periods be served. SURGE is the MPC optimization where price is only determined for one epoch. This is similar to the strategy adopted by TNCs in practice where the platform increases the price for the current epoch and customers either take the ride or leave it. Five demand patterns {d1ijt , 0.9d1ijt , 0.8d1ijt , 0.5d1ijt , 0} are available for each O-D pair (i, j) and epoch t, and d1ijt is the predicted demand between i and j in period t under the base price. The factors {1.0, 0.9, 0.8, 0.5, 0.0} are demand multipliers decided at the zone level, i.e., they act on the demand for O-D pairs with the same origin and emerging epoch. In other words, the demand multiplier is based on the trip origin only and does not discriminate against destinations. SURGE+POSPTPONE adds to these demand patterns the option of discounting prices in future epochs to postpone riders. The experiments assume that 20%/30%/40% of the riders can be postponed for 2 or 3 periods for each O-D pair (i, j) and epoch t. The demand pattern is also decided at the zone level.
6.1 Long Peaks
Consider the case where a 30-minute peak is inserted into a single zone to simulate a demand surge after a special event such as a sports game or a concert. The experiments consider instances with four different peaks that contain 17%/24%/31%/38% more requests respectively. Table 2 reports the dropout rate, the number of riders served, and the waiting times. RELOCATION sees increasing numbers of dropouts as the peaks become stronger, with 17% dropping out in the largest instance. SURGE and SURGE+POSPTPONE, on the other hand, exhibit a zero dropout rate, while serving approximately the same number of riders. The pricing models also achieve lower waiting time averages and standard deviations. They perform more relocations than RELOCATION, most likely because there are fewer requests waiting to be scheduled, giving more opportunities for vehicles to relocate. Table 3 shows that postponed riders are served quickly, meeting the quality of service goals of the platform. Overall, these results show that the pricing MPCs provide service quality guarantees.
It is important to compare the revenues of the MPCs, which are computed based on price elasticity of demand. The price p1ijt that corresponds to d1ijt is computed in a standard way using travel times [NYC, 2019b]. The prices for the other demand patterns are derived from the price elasticity of demand
ϵ = ∆d% ∆p% = (dkijt-d1ijt )/d1ijt (pkijt-p1ijt )/p1ijt . The model evaluation considers three elasticity levels: -0.5, -1.0, and -2.0 for SURGE. SURGE+POSPTPONE assumes an elasticity of -1.0 for its surge component and offers a x% discount in order to postpone x% of the demand, for x ∈ [20, 30, 40]. Table 4 presents the revenue results: The revenues are noticeably higher for SURGE than for RELOCATION when ϵ ∈ {-0.5 - 1.0} and about the same when ϵ = -2.0. The SURGE+POSPTPONE's revenues are about the same as RELOCATION and not as high as SURGE's revenues, since giving a discount to some is typically not as profitable as charging everyone a higher price, although this depends on the exact price-demand relationships. Overall, the results show that the pricing MPCs provide service guarantees without sacrificing revenues.
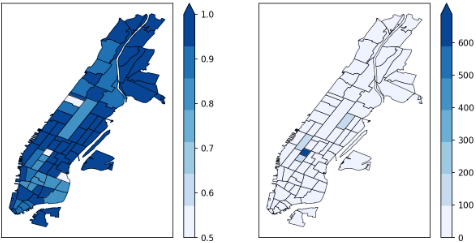
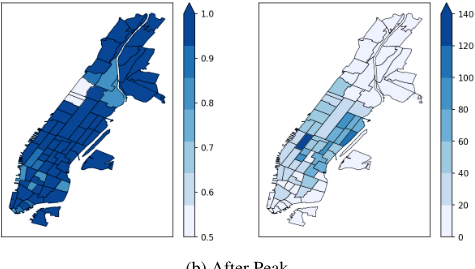
To understand which riders are priced out, Figure 3 displays the percentages of demand kept by SURGE (demand multipliers) and the original demand for two epochs: one during the peak and one after the peak. In both cases, the regions where people are priced out are spread out and are not solely concentrated in the low-demand or remote regions. This shows that the pricing decisions are not biased with regards to demand or geographical locations.
The above experiments were conducted without ridesharing but similar results were obtained when the platform used ridesharing. The main difference is an increase in the number of served riders and revenues. For SURGE, ridesharing increases the number of riders by 2%, 3%, 4%, and 3% and the revenues by 1%, 1%, 4%, and 4% for the peak instances.
6.2 Short Peaks
The benefits of SURGE+POSPTPONE did not materialize during long peaks, since the model had no ability to postpone customers for very long periods. Instead consider short peaks of 10-minutes with 17%/24%/31%/38% surges in demand and assume that the forecasting algorithm can predict the start and end of the peak. The demand forecast is obtained by adding white noise with a 2% standard deviation of the true demand. Table 5 reports the number of riders priced out by SURGE and SURGE+POSPTPONE with and without ridesharing. While both models achieve a zero dropout rate on all instances, SURGE+POSPTPONE prices out fewer riders, especially during small peaks in the ridesharing setting. A possible explanation is that, when the peak is not too intense, more vehicles are available in the future to serve postponed demand. When the peak is strong or ridesharing is not available, fewer vehicles can be used to serve the postponed demand. These observations imply that postponing is most helpful when surge is relatively small.
| Peak Demand Percentage | Passengers Served | Dropout Percentage | Wait Time Avg (mins) | Relocation | ||||||||
|---|---|---|---|---|---|---|---|---|---|---|---|---|
| Reloc | Surge | Post | Reloc | Surge | Post | Reloc | Surge | Post | Reloc | Surge | Post | |
| 0% | 25664 | 25153 | 25196 | 0.0 | 0.0 | 0.0 | 4.1 | 3.5 | 3.5 | 2510 | 2852 | 2863 |
| 17% | 25237 | 25484 | 25470 | 11.1 | 0.0 | 0.0 | 5.8 | 4.3 | 4.3 | 1670 | 2117 | 2152 |
| 24% | 25176 | 25297 | 25346 | 13.8 | 0.0 | 0.0 | 6.1 | 4.2 | 4.3 | 1638 | 2264 | 2158 |
| 31% | 25640 | 25078 | 25188 | 15.4 | 0.0 | 0.0 | 5.5 | 4.1 | 4.3 | 1860 | 2363 | 2270 |
| 38% | 26172 | 25094 | 25154 | 17.0 | 0.0 | 0.0 | 6.3 | 4.2 | 4.2 | 1800 | 2514 | 2513 |
| Statistics | Peak Demand Percentage | |||
|---|---|---|---|---|
| 17% | 24% | 31% | 38% | |
| Percentage Served (%) | 100 | 100 | 100 | 100 |
| Wait Time Avg | 5.4 | 5.3 | 5.1 | 5.2 |
| Wait Time Std | 1.3 | 1.1 | 1.4 | 1.2 |
| Peak Demand | Revenue | ||||
|---|---|---|---|---|---|
| Percentage | Reloc | Surge (-0.5) | Surge (-1.0) | Surge (-2.0) | Post |
| 0% | 74972 | 75808 | 74564 | 73942 | 73200 |
| 17% | 73994 | 83245 | 78807 | 76587 | 75648 |
| 24% | 74123 | 84890 | 79599 | 76953 | 76712 |
| 31% | 74875 | 83360 | 78306 | 75779 | 75057 |
| 38% | 76021 | 82039 | 77261 | 74871 | 74394 |
| Peak Demand Percentage | Model | |||
|---|---|---|---|---|
| Rideshare | No Rideshare | |||
| Surge | Post | Surge | Post | |
| 17% | 827 | 675 | 1423 | 1205 |
| 24% | 1161 | 839 | 1836 | 1761 |
| 31% | 1704 | 1721 | 2078 | 2101 |
| 38% | 1789 | 1835 | 2235 | 2200 |
7 Conclusion
This paper proposed AP-RTRS, a real-time framework for ride sharing that features dynamic pricing scheme. To our knowledge, AP-RTRS is the first framework that provides service guarantees and short waiting times for ride-sharing platforms during peak times. This is achieved by prompting people to use the service at a later time or admitting fewer customers. AP-RTRS combines a real-time dial-aride optimization to dispatch and route vehicles with a MPC component for pricing and relocation. Experimental results on the Yellow Taxi instances in New York City with peaks of increasing intensities demonstrate that AP-RTRS meets its performance guarantee targets and achieves short waiting
- (a) During Peak
(b) After Peak
Figure 3: Demand Multipliers and Demand.
times, while not sacrificing revenues or creating any major geographical fairness issues. The results also show that discounting is effective for short peaks where it improves the number of riders served significantly, especially when ridesharing is considered. Future work will focus on generalizing AP-RTRS with fairness guarantees and taking into account the supply side.
@inproceedings{ijcai2021p515,
  title     = {Real-Time Pricing Optimization for Ride-Hailing Quality of Service},
  author    = {Yuan, Enpeng and Van Hentenryck, Pascal},
  booktitle = {Proceedings of the Thirtieth International Joint Conference on
               Artificial Intelligence, {IJCAI-21}},
  publisher = {International Joint Conferences on Artificial Intelligence Organization},
  editor    = {Zhi-Hua Zhou},
  pages     = {3742--3748},
  year      = {2021},
  month     = {8},
  note      = {Main Track},
  doi       = {10.24963/ijcai.2021/515},
  url       = {https://doi.org/10.24963/ijcai.2021/515},
}
TY - CPAPER TI - Real-Time Pricing Optimization for Ride-Hailing Quality of Service AU - Yuan, Enpeng AU - Van Hentenryck, Pascal T2 - Proceedings of the Thirtieth International Joint Conference on Artificial Intelligence, IJCAI-21 PB - International Joint Conferences on Artificial Intelligence Organization PY - 2021 SP - 3742 EP - 3748 DO - 10.24963/ijcai.2021/515 UR - https://doi.org/10.24963/ijcai.2021/515 ER -Copied
Machine-readable versions of this paper, for tools and AI agents:





