
HIVE: Hierarchical Information Visualization for Explainability
Proceedings of the Thirtieth International Joint Conference on Artificial Intelligence. Demo Track. Pages 4988-4991.
https://doi.org/10.24963/ijcai.2021/709
Keywords
- Natural Language Processing: General
Abstract
In this demonstration, we develop an interactive tool, HIVE, to demonstrate the ability and versatility of an explainable risk ranking model with a special focus on financial use cases. HIVE is a web-based tool that provides users with automated highlighted financial statements, and HIVE is designed for making comparing statements rather more efficient. Moreover, with the proposed tool, users can find related reports at ease, and we believe that HIVE can benefit both academics and practitioners in finance as they can work around deep learning models with their newly gained insights.
- [Chalkidis et al., 2018] Ilias Chalkidis, Ion Androutsopou- los, and Achilleas Michos. Obligation and prohibi- tion extraction using hierarchical rnns. arXiv preprint arXiv:1805.03871, 2018.
- [Ding et al., 2015] Xiao Ding, Yue Zhang, Ting Liu, and Junwen Duan. Deep learning for event-driven stock pre- diction. In Proc. IJCAI, page 2327-2333, 2015. IJCAI
- [Hu et al., 2017] Ziniu Hu, Weiqing Liu, Jiang Bian, Xu- anzhe Liu, and Tie-Yan Liu. Listening to chaotic whispers: A deep learning framework for news-oriented stock trend prediction. In Proc. WSDM, pages 261-269, 12 2017.
- [John A. Tracy, 1980] Tage C. Tracy John A. Tracy. How to Read a Financial Report: Wringing Vital Signs Out of the Numbers. Wiley, 1980.
- [Li et al., 2018] Zheng Li, Ying Wei, Yu Zhang, and Qiang Yang. Hierarchical attention transfer network for cross- domain sentiment classification. In Proc. AAAI, pages 5852-5859, 2018.
- [Lin et al., 2020] Fei Lin, Cong Zhang, Shengqiang Liu, and Hong Ma. A hierarchical structured multi-head attention betwork for multi-turn response generation. IEEE Access, 8:46802-46810, 2020.
- [Loughran and McDonald, 2011] Tim Loughran and Bill McDonald. When is a liability not a liability? textual analysis, dictionaries, and 10-ks. The Journal of Finance, 66(1):35-65, 2011.
- [Luo et al., 2018] Ling Luo, Xiang Ao, Feiyang Pan, Jin Wang, Tong Zhao, Ningzi Yu, and Qing He. Beyond po- larity: Interpretable financial sentiment analysis with hi- erarchical query-driven attention. In Proc. IJCAI, pages 4244-4250, 07 2018. IJCAI
- [Miculicich et al., 2018] Lesly Miculicich, Dhananjay Ram, Nikolaos Pappas, and James Henderson. Document-level neural machine translation with hierarchical attention net- works. arXiv preprint arXiv:1809.01576, 2018.
- [Pratt, 2010] Jamie Pratt. Financial Accounting in an Eco- nomic Context. Wiley, 2010.
- [Thukaram, 2007] R.M.E. Thukaram. Management Ac- counting. New age. New Age International (P) Limited, 2007.
- [Tsai and Wang, 2017] Ming-Feng Tsai and Chuan-Ju Wang. On the risk prediction and analysis of soft informa- tion in finance reports. European Journal of Operational Research, 257(1):243-250, 2017.
- [Wiegreffe and Pinter, 2019] Sarah Wiegreffe and Yuval Pin- ter. Attention is not not explanation. arXiv preprint arXiv:1908.04626, 2019.
- [Yang et al., 2016] Zichao Yang, Diyi Yang, Chris Dyer, Xi- aodong He, Alex Smola, and Eduard Hovy. Hierarchical attention networks for document classification. In Proc. NAACL, pages 1480-1489, 2016.
References were extracted automatically from the PDF and may contain errors.
Full text extracted automatically from the PDF; figures, tables and equations may differ. The PDF is the version of record.
1 Introduction
The financial statement refers to formal and original statements that prepare to disclose a business's financial health in terms of profits, position, and prospects [Thukaram, 2007] allowing investors and creditors to understand the operating conditions of the company, therefore, to make more informed decisions [Tsai and Wang, 2017]. Although statements and the information conveyed are crucial to financial professionals and the decisions they make, the information gathering process is not necessarily easy. After carefully analyzing how financial professionals work with financial statements, in this work, we identify three pain points: 1) statements being not easy to comprehend; 2) the complicated work of flow for comparison involved; 3) the difficulty to relate the finance risk to textual information.
For the first pain point, although financial statements are usually structured and presented in specific orders, they are usually long and written in a more conservative fashion. It is thus very time consuming to read through every statement. Therefore, most professionals skim through statements while looking for keywords and charts; moreover, it is even harder for junior accounting students to determine what lines bear crucial information [John A. Tracy, 1980]. Secondly, the most typical use case is readings through a single statement; yet when conducting industry analysis, multiple statements are always involved. Professionals need to first locate related companies with their domain knowledge, and after gathering the statements needed, they need to read through all documents to understand the shared traits and differences among these companies, which is however a extremely tedious process [Pratt, 2010]. Finally, due to the noise within finance documents and the information gap between texts and financial numerical measures, it is usually difficult to precisely relate the finance quantities (e.g., stock return and volatility) to textual information in reports.
As a team of machine learning researchers who constantly work with financial texts, we always thrive to assist financial professionals with the latest AI technology. Among various NLP models, the class of hierarchical attention networks (HAN) has been proposed to better model the hierarchical structure of document; many variants have been presented to address different NLP tasks, e.g., sentiment analysis [Li et al., 2018] and document classification [Yang et al., 2016]. Although the heat map has been adopted to showcase the learned multi-level attention weights in some studies [Yang et al., 2016; Miculicich et al., 2018; Li et al., 2018; Chalkidis et al., 2018; Lin et al., 2020], to our best knowledge, there exists no live system leveraging HAN models in an interactive project targeted to the massive number of financial professionals who have long been troubled by the complicated nature of financial statements.
To this end, in this demonstration, 1 we build an interactive website for hierarchical information visualization for explainability (HIVE 2 ). HIVE is supported by a HAN-inspired ranking model trained on Form 10-K reports, the annual reports required by the SEC. 3 With this multilevel attention structure, we are able to gather word-level and sentence-level attention weights, which to some extent explain what contributes to the final predicted results, and to what degree it does so. Furthermore, we also deploy a separate algorithm that recommends similar financial reports, where the recommendations are generated based on the cosine similarity between learned embeddings of financial statements extracted from our models. Combining the two algorithms (i.e., the HAN-based ranking and the recommendation models), HIVE not only better visualize the outputs of the class of hierarchical attention networks, thereby helping readers to efficiently understand the context and analyze the correlations between the textual information in reports and the financial risks of companies, but also allows users to easily find other similar financial reports recommended by our system, thereby providing them a convenient system interface to quickly compare key financial information among those different reports. As a result, HIVE, the proposed demonstration, allows both academics and practitioners in finance to work better around the HAN-like models with their newly gained insights.
2 https://cfda.csie.org/HIVE/home
3 The U.S. Securities and Exchange Commission
2 SystemDescription
2.1 Model Overview
Our model is trained on a large collection of 10-K financial reports from 1996 to 2013 requested by the SEC. Such a large amount of data enables us to understand the correlations between the textual information in reports and the financial risks of companies measured by the post-event return volatilities, a commonly used proxy for financial risk in finance [Loughran and McDonald, 2011].
Multilevel Explanation Structure
In order to model the complex structures of financial texts, we build a multilevel explainable ranking structure with sequence encoders based on bidirectional gated recurrent units (GRUs) at both the word and sentence levels which is inspired by previous works working with hierarchical language networks [Yang et al., 2016; Hu et al., 2017; Ding et al., 2015] Moreover, we leverage the attention mechanism to introduce explainability to models by explicitly showcasing the weightings of each model components. Thus, to some extent, the attention mechanism is capable of identifying meaningful information for model prediction and in some ways alleviate the explainability problem [Wiegreffe and Pinter, 2019]. To provide fine-grained explainable results, our model involves two levels of attention, word and sentence level; these two attention layers can identify influential texts that contribute to the evaluation of financial risks, thus, making it possible for users to know what contributes to the predicted results and what lines should be paid more attention to. We leverage attention weights in HIVE by highlighting the weights and providing visualization of the importance of these textual information in financial statements.
On the other hand, unlike many previous hierarchical deep neural network architectures, which are mainly on classification tasks [Ding et al., 2015; Luo et al., 2018], we rank the financial reports according to their financial risk levels and locate top high-risk companies by proposing a pairwise ranking loss based on a siamese network with two parallel multilevel explainable structures. Given a pair of financial reports (dl, dj ),where the company associated with dl is riskier than that with dj according to their risk levels, the goal of the pairwise ranking model f(·) is to generate a higher score for dl so that it learns a score function f(·) that satisfies f(dl) > f(dj), ∀(dl, dj) ∈ Ψ where Ψ denotes as the set of all "positive" financial report pairs, each element in which is fed into two separate but identical hierarchical structures, and di denotes the document embedding of report di obtained from the last attention layer of our model.
2.2 Recommendation Algorithm
In order to realize a real-time recommendation system for financial reports, we locate the approximate nearest neighbors in the high-dimension feature space which are referred to as embeddings space for every query to optimize the process for a low-latency response. Specifically, to build up our recommendation system, we firstly convert each financial reports in our database into vectors by extracting the document embeddings from our model, and secondly we build a forests of k trees, where k is a tunable parameter that trades off between precision and efficiency so that we can organize financial reports into indexes and lets us do queries in O(log n). To search for any point in this binary tree, we can traverse it from the root until we reach the node. We then end up with several nearest neighborhoods and only output those with the top5 highest degree of cosine similarities with the query financial report. The system extracts document embedding from the model presented in Section 2.1, builds an approximate similarity matching index by constructing a binary tree with random projections, and serves the build index for real-time similar financial report search.
2.3 System Interfaces
Design for Informed Decision Making
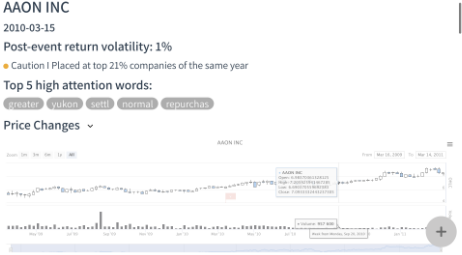
We reproduce the layout for financial statements and incorporate additional information that are critical to financial decisions in our system. First, the annual future post-event return volatility for the displayed company is placed on the top-left so readers can easily access the index that is used as the target for our financial risk prediction. Right underneath it is the risk level and the ranking of each report's corresponding percentile rank based on the post-event return volatilities of all companies in the same year. For example, APPLE INC. was one of the top 2% of risky companies in year 2005; our system, therefore, marked it with a red badge and warning (see Figure 1). Moreover, below the risk indicator, we include words with the highest attention-weights contributed to the system prediction results for each company, expecting that they can help financial professionals to make better sense of what might affect the future return volatility. The stock price trend and detailed candlestick chart are also shown on the upper panel and can be easily hidden with the accordion design.
Customizable Highlighter
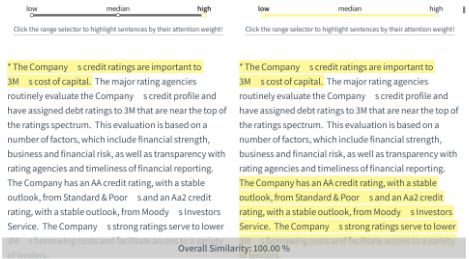
To assist financial professionals to browse through statements with much more efficiency, HIVE comes with a customizable highlighter function. With the highlighted lines and words automated by HIVE, users can now easily locate the lines that require more attention with much ease. Users can determine the threshold for the automated highlighting feature and can easily switch between three different levels of threshold available-low, medium and high, corresponding to Q1 (first quartile), medium, and Q3 (third quartile) of calculated based on all the sentence-level attention weights in each report, respectively. Note that the higher the threshold is selected the fewer the sentences are colored. (Figure 2).
Comparison Function and Statement Recommendation
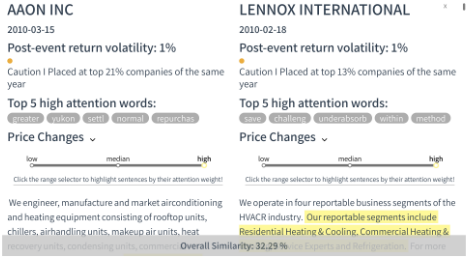
With our statement recommendation system and comparison feature, HIVE is designed to be the one-stop solution for financial professionals as they no longer need to struggle switching multiple windows and not finding the right statement due to their complicated workflows. Our interface supports split screens where users can compare two statements at the same time. Users can launch the comparison function by clicking on the button with a "+" mark on the bottom-right corner, for which they can either manually select statements they are interested in or choose from a list of carefully curated statements, sector-based reports or machine-recommended ones. Our curated lists are heavily inspired by the two important factors financial professionals take into account when referring to statements: "industry sector" and "the similarity/difference between companies." For example, for APPLE COMPUTER INC's 2005 report, based on our recommendation algorithm, our system suggests the report of WESTELL TECHNOLOGIES INC's in year 2008 as the most similar one; the reason for such a recommendation is that these two reports both talk about the remaining business strategy about increasing investment in research and development in the market where they compete.
3 Case Study
Here we first showcase HIVE's ability to highlight parts of financial reports that require extra attention (see the upper panel of Figure 2). In this case, several sentences that have the relatively highest attention weights filtered by our customizable highlighter from TESLA MOTORS INC's 2012 report are "During the year ended December 31, 2012, we recognized total revenues of $413.3 million, an increase of 102% over total revenues of $204.2 million for the year ended December 31, 2011. Automotive sales revenue of $385.7 million increased 160% from the year ended December 31, 2011, driven by commencement of Model S deliveries in North America, ... ...that we began to sell to Toyota for the Toyota RAV4 EV in 2012.". The highlighted lines detail the income, the company's newly launched product lines and the benefits they bring, as well as its main sales regions which all affect the overall evaluation of the company, thus justifying its high attention weights and suggesting its importance to the reader. AAON is another prime example to demonstrate how the proposed system can help financial professionals efficiently complete the competitor comparison work and bring additional insights. As shown in Figure 3, when AAON Inc's 2010 report is selected, our system recommends the report of Lennox International Inc from the same year. The fact that Lennox is one of their biggest competitors for AAON makes this recommendation extremely valuable. It is worth mentioning that by taking a closer look at their reports, both mentioned significant losses due to the harsh economic environment in 2008 which not only proves that our recommendation is reasonable but further explains the similarity between predicted post-event return volatility. For example, AAON's report mentioned "Sales decreased $34.4 million or 12.3% in 2009 from 2008 which was attributable to the decreased volume related to the current economic environment and lower sales from our Canadian operations."; there are also similar lines from Lennox that read "Net sales for 2009 were $2,847.5 million and were adversely impacted on a year over year basis primarily by lower volumes across all segments as a result of the difficult economic environment." Above, we not only showcase how HIVE's highlighter feature can make users' reading process much more efficient but also demonstrate how powerful the statement recommendation function can be. We believe that HIVE is the first prototype that successfully detangles the complicated workflows of financial professionals, thereby allowing them to only focus on what truly matters and make informed decisions.
@inproceedings{ijcai2021p709,
  title     = {HIVE: Hierarchical Information Visualization for Explainability},
  author    = {Juan, Yi-Ning and Chiang, Yi-Shyuan and Liu, Shang-Chuan and Tsai, Ming-Feng and Wang, Chuan-Ju},
  booktitle = {Proceedings of the Thirtieth International Joint Conference on
               Artificial Intelligence, {IJCAI-21}},
  publisher = {International Joint Conferences on Artificial Intelligence Organization},
  editor    = {Zhi-Hua Zhou},
  pages     = {4988--4991},
  year      = {2021},
  month     = {8},
  note      = {Demo Track},
  doi       = {10.24963/ijcai.2021/709},
  url       = {https://doi.org/10.24963/ijcai.2021/709},
}
TY - CPAPER TI - HIVE: Hierarchical Information Visualization for Explainability AU - Juan, Yi-Ning AU - Chiang, Yi-Shyuan AU - Liu, Shang-Chuan AU - Tsai, Ming-Feng AU - Wang, Chuan-Ju T2 - Proceedings of the Thirtieth International Joint Conference on Artificial Intelligence, IJCAI-21 PB - International Joint Conferences on Artificial Intelligence Organization PY - 2021 SP - 4988 EP - 4991 DO - 10.24963/ijcai.2021/709 UR - https://doi.org/10.24963/ijcai.2021/709 ER -Copied
Machine-readable versions of this paper, for tools and AI agents:





