
Towards the Quantitative Interpretability Analysis of Citizens Happiness Prediction
Proceedings of the Thirty-First International Joint Conference on Artificial Intelligence. AI for Good. Pages 5094-5100.
https://doi.org/10.24963/ijcai.2022/707
Keywords
- AI Ethics, Trust, Fairness: Societal Impact of AI
- Machine Learning: Explainable/Interpretable Machine Learning
- AI Ethics, Trust, Fairness: Explainability and Interpretability
- Humans and AI: Computational Sustainability and Human Well-Being
Abstract
Evaluating the high-effect factors of citizens' happiness is beneficial to a wide range of policy-making for economics and politics in most countries. Benefiting from the high-efficiency of regression models, previous efforts by sociology scholars have analyzed the effect of happiness factors with high interpretability. However, restricted to their research concerns, they are specifically interested in some subset of factors modeled as linear functions. Recently, deep learning shows promising prediction accuracy while addressing challenges in interpretability. To this end, we introduce Shapley value that is inherent in solid theory for factor contribution interpretability to work with deep learning models by taking into account interactions between multiple factors. The proposed solution computes the Shapley value of a factor, i.e., its average contribution to the prediction in different coalitions based on coalitional game theory. Aiming to evaluate the interpretability quality of our solution, experiments are conducted on a Chinese General Social Survey (CGSS) questionnaire dataset. Through systematic reviews, the experimental results of Shapley value are highly consistent with academic studies in social science, which implies our solution for citizens' happiness prediction has 2-fold implications, theoretically and practically.
- [Aas et al., 2021] Kjersti Aas, Martin Jullum, and Anders Løland. Explaining individual predictions when features are dependent: More accurate approximations to shapley values. Artif. Intell., 298:103502, 2021.
- [Baucells and Sarin, 2007] Manel Baucells and Rakesh K. Sarin. Satiation in discounted utility. Oper. Res., 55(1):170-181, 2007.
- [Binder and Broekel, 2012] Martin Binder and Broekel. Happiness no matter the cost? an examination on how efficiently individ- uals reach their happiness levels. Journal of Happiness Studies, 13(4):621-645, 2012.
- [Cheng et al., 2016] Heng-Tze Cheng, Levent Koc, and Jeremiah Harmsen et al. Wide & deep learning for recom- mender systems. In DLRS@RecSys, pages 7-10, 2016.
- [Cordero-Ferrera et al., 2017] José Manuel Cordero-Ferrera, Javier Salinas-Jiménez, and M. Mar Salinas-Jiménez. Exploring fac- tors affecting the level of happiness across countries: A condi- tional robust nonparametric frontier analysis. Eur. J. Oper. Res., 256(2):663-672, 2017.
- [Daswani and Leike, 2015] Mayank Daswani and Jan Leike. A def- inition of happiness for reinforcement learning agents. In Artifi- cial General Intelligence, volume 9205, pages 231-240, 2015.
- [Deng, 2019] Min Deng. Social relationships, mental health and well-being of the elderly: an empirical analysis based on cgss2015. population and development, 25(3):85-93, 2019.
- [Di, 2018] Feifei Di. A study on the relationship between chinese residents behavioral attitude, lifestyle well-being and environ- mental behavior-based on cgss2013. Journal of Arid Land re- sources and Environment, 032(003):7-11, 2018.
- [Durante et al., 2015] Durante, Daniele, and Paganin et al. Bayesian modeling of networks in complex business intelligence problems. J. R. Stat. Soc., C: Appl. Stat., 66:555-580, 2015.
- [Egilmez et al., 2019] Gokhan Egilmez, Nadiye Özlem Erdil, and Omid Mohammadi Arani et al. Application of artificial neural networks to assess student happiness. Int. J. Appl. Decis. Sci., 12(2):115-140, 2019.
- [Frey and Stutzer, 2012] Bruno S. Frey and Alois Stutzer. The use of happiness research for public policy. Soc. Choice Welf., 38(4):659-674, 2012.
- [Garaigordobil, 2015] Maite Garaigordobil. Predictor variables of happiness and its connection with risk and protective factors for health. Frontiers in Psychology, 6:1-10, 2015.
- [Guo et al., 2017] Huifeng Guo, Ruiming Tang, and Yunming Ye et al. Deepfm: A factorization-machine based neural network for CTR prediction. In IJCAI, pages 1725-1731, 2017. IJCAI
- [He and Chua, 2017] Xiangnan He and Tat-Seng Chua. Neural fac- torization machines for sparse predictive analytics. In SIGIR, pages 355-364, 2017.
- [Huang, 2017] Liqing Huang. Well-being of youth groups: An analysis based on cgss. China Youth Study, (12):53-59, 2017.
- [Islam and Goldwasser, 2020] Tunazzina Islam and Dan Gold- wasser. Does yoga make you happy? analyzing twitter user hap- piness using textual and temporal information. In IEEE BigData, pages 4241-4249, 2020.
- [Kotakorpi and Laamanen, 2010] Kaisa Kotakorpi and Jani-Petri Laamanen. Welfare state and life satisfaction: Evidence from public health care. Economica, 77(307):565-583, 2010.
- [Li and Wang, 2015] Jing Li and Yuejin Wang. An analysis of the relationship between health and subjective well-being of farmers -based on a survey of 1000 farmers in 5 provinces. Chinese Rural Economy, (10):80-88, 2015.
- [Lin et al., 2014] Huijie Lin, Jia Jia, and Quan Guo et al. User- level psychological stress detection from social media using deep neural network. In ACM Multimedia, pages 507-516, 2014.
- [O'Donnell and Oswald, 2015] Gus O'Donnell and Andrew J Os- wald. National well-being policy and a weighted approach to human feelings. Ecol. Econ., 120:59-70, 2015.
- [Oshio et al., 2011] Takashi Oshio, Kayo Nozaki, and Miki Kobayashi. Relative income and happiness in asia: Evidence from nationwide surveys in china, japan, and korea. Soc. Indic. Res., 104:351-367, 2011.
- [Peng et al., 2018] Xuefeng Peng, Li-Kai Chi, and Jiebo Luo. The effect of pets on happiness: A large-scale multi-factor analy- sis using social multimedia. ACM Trans. Intell. Syst. Technol., 9(5):61-75, 2018.
- [Pérez-Benito et al., 2019] Francisco Javier Pérez-Benito, Patricia Villacampa-Fernández, J. Alberto Conejero, Juan M. García- Gómez, and Esperanza Navarro-Pardo. A happiness degree pre- dictor using the conceptual data structure for deep learning archi- tectures. Comput. Methods Programs Biomed., 168:59-68, 2019.
- [Poria et al., 2015] Soujanya Poria, Erik Cambria, and Alexander F. Gelbukh. Deep convolutional neural network textual features and multiple kernel learning for utterance-level multimodal sentiment analysis. In EMNLP, pages 2539-2544, 2015.
- [Saputri and Lee, 2015] Theresia Ratih Dewi Saputri and Seok- Won Lee. A study of cross-national differences in happiness fac- tors using machine learning approach. Int. J. Softw. Eng. Knowl. Eng., 25(9-10):1699-1702, 2015.
- [Shin, 2018] Inyong Shin. Could pension system make us happier? Cogent economics & finance, 6(1):1452342-1452367, 2018.
- [Strumbelj and Kononenko, 2014] Erik Strumbelj and Igor Kononenko. Explaining prediction models and individual predictions with feature contributions. Knowl. Inf. Syst., 41(3):647-665, 2014.
- [Sweeney et al., 2021] Colm Sweeney, Edel Ennis, Raymond R. Bond, Maurice D. Mulvenna, and Siobhan O'Neill. Understand- ing a happiness dataset: How the machine learning classifica- tion accuracy changes with different demographic groups. In IEEE Symposium on Computers and Communications, pages 1- 4, 2021.
- [Tang et al., 2012] Jialin Tang, Zuoshan Li, and Xiaoyan Zhang. Relationship between university students' positive psychological capital and subjective well-being. Chinese Journal of Health Psy- chology, 020(007):1105-1108, 2012.
- [Tao et al., 2021] Xiaohui Tao, Oliver Chi, Patrick J. Delaney, Lin Li, and Jiajin Huang. Detecting depression using an ensem- ble classifier based on quality of life scales. Brain Informatics, 8(1):2, 2021.
- [Tella and MacCulloch, 2006] Rafael Di Tella and Robert MacCul- loch. Some uses of happiness data in economics. Journal of Economic Perspectives, 20(1):25-46, 2006.
- [Xin and Inkpen, 2019] Weizhao Xin and Diana Inkpen. Happi- ness ingredients detection using multi-task deep learning. In Af- fCon@AAAI, pages 164-170, 2019.
- [Xu and Chen, 2017] Shuyi Xu and Ping Chen. Income, social sta- tus and happiness: From the perspective of equity perception. Journal of Management Science, 20(12):99-116, 2017.
References were extracted automatically from the PDF and may contain errors.
Full text extracted automatically from the PDF; figures, tables and equations may differ. The PDF is the version of record.
1 Introduction
Happiness is defined as an abstract term that locates in an emotional state with positive valence by psychologists, and its definition varies individually [Daswani and Leike, 2015]. Globally identifying crucial factors is difficult since the factors impacting the feeling of happiness could be diverse among individuals. There are also other concerns raised from academics, economists [Binder and Broekel, 2012; CorderoFerrera et al., 2017] and politicians [Frey and Stutzer, 2012; Durante et al., 2015]. One particular example in economics is from Baucells, et al.[2007] who pointed out that happiness depends on the perception of one's income, which further manipulates the happiness and well-being. Referring to Aristotle's theory, health, beauty, and mental needs (e.g., education, friendship) all contribute to happiness. Nowadays, happiness studies have gained more attention as individuals' well-being has been used to reflect the macro-economic and micro-economic development of countries. According to reports by the Organization for Economic Cooperation and Development (OECD), more than 20 countries have begun making use of subjective well-being data as part of their process for policy-making. On the other hand, O'Donnell et al.[2015] also discussed the effective use of happiness and well-being besides traditional economic measures in government policymaking. Quantitatively identifying the influential factors contributing to citizens' happiness has become an urgent demand by policy-makers for social- and economic-good.
∗Corresponding Author
Numerous studies in sociology [Garaigordobil, 2015; Saputri and Lee, 2015] and computational science [P´erezBenito et al., 2019; Xin and Inkpen, 2019; Tao et al., 2021; Sweeney et al., 2021] have revealed that the crucial factors contributing to happiness remains various to this date. As shown in Table 1, sociology researchers analyzed the subset factors within their own research concerns. For example, health and sociability are analyzed by Garaigordobil, et al.[2015] using Multivariate Linear Regression (MLR) model. Saputri and Lee [2015] identified more than 90 features containing both physical and mental needs by machine learning. However, the conventional methodologies are based on modeling linear or simple nonlinear relationships, such as the commonly used MLR and Support Vector Machine (SVM), which suffers from the lack of representative capacity for the nested variable interactions among multiple factors.
The development of deep learning shows a promising mechanism for modeling complex relationships. Table 1 presents some recently studies that analyzed various factors. Interesting findings include psychological factors (social support, personality, emotional distress, and stress coping strategies) discovered by D-SDNN [P´erez-Benito et al., 2019], pets [Peng et al., 2018], graduate students' happiness factors (education, school facilities, health, social activities, family) [Egilmez et al., 2019], and yoga by neural networks with Attention mechanism [Islam and Goldwasser, 2020]. Although neural network-based deep learning shows excellent prediction performance, the challenge is that its interpretability is limited and has become a great challenge to the research community. Without high and reliable interpretability, sociological scholars and practitioners who pursue precise policymaking on economics and politics will not trust the advanced deep learning technology. Both prediction accuracy and interpretability share the same importance in social science.
| Field | Model | Key Factors |
|---|---|---|
| Social Science | MLR [Garaigordobil, 2015] | health; sociability |
| SVM [Saputri and Lee, 2015] | education;stress;depression;human development index | |
| Computational Science | CNN+MTL+GloVe [Xin and Inkpen, 2019] | age; gender; location; marital status, parental status |
| D-SDNN [P´erez-Benito et al., 2019] | social support; coping strategies; personality | |
| BiLSTMAttEmo [Islam and Goldwasser, 2020] | yoga related text word |
In this work, we propose a new solution adopting the Shapley value [Strumbelj and Kononenko, 2014] with DNN (Deep Neural Networks), towards quantitative interpretability analysis of happiness prediction. The DNN is exploited to extract the key factors of happiness. Then, the Shapley value is computed through Shapley sampling, which has been proved to be a fair contribution assessment method to explain prediction results via theoretical feasibility. The Shapley value of factor j is evaluated based on the local value of the factor j contributed to the prediction of this particular instance, and its global value obtained by comparing the average prediction result across the overall dataset, which is rooted in coalitional game theory.
The main contributions of this paper can be summarized as follows: 1) a new paradigm is opened to the research community for quantitative analysis for the interpretability of happiness key factors by Shapley value; 2) our solution extends the superiority of deep learning, evidenced by the high congruence of the calculated interpretability with the conclusions from the sociological literature.
2 RelatedWork
Social Science. Happiness prediction is focused by Sociologists first. Garaigordobil, et al.[2015] conducted a study on a sample consisting of adolescents aged 14-16 years and predicted the factors of happiness such as health and sociability of an individual by regression analysis. The study was further extended by Saputri and Lee [2015], who analyzed data from 187 countries to predict crucial factors contributing to happiness such as education and human development index by SVM. However, these studies suffer from the problem of lacking a sufficient quantity of observable data, which has been commonly realized a bottleneck to related studies nowadays. In addition, a more recent study [P´erez-Benito et al., 2019] argued that most conventional methodologies adopted by sociological studies, including commonly used MLR analysis, do not possess the capacity to truly represent the complexity of factor interactions.
Computational Science. Many studies in computational science [Tao et al., 2021; Sweeney et al., 2021] utilized DNN which is capable of estimating non-linear relationships, thanks to the automatic feature extraction and selection of complex relationship between multi-factors. Such a mechanism is considered better than traditional methodologies and have became increasingly influential in psychological research on happiness and depression. Recent studies [Lin et al., 2014; Poria et al., 2015] suggested that happiness factors can be monitored through convolutional neural network, which provides better performance for feature extraction and selection based on social networks, image/video and text datasets. The conceptual interrelationships of the factors affecting happiness have also been studied individually to a great extent in the past. P´erez-Benito, et al.[2019] proposed D-SDNN approach to show that the emergence or maintenance of happiness depends on other psychological factors which are unlimited to just socio-demographic characteristics. Xin and Inkpen [2019] proposed a novel deep multi-task learning model for the task of detecting happiness ingredients ("agency" and "social"). Peng, et al.[2018] leveraged deep learning technologies to analyze the effect of pets on happiness in terms of multiple factors of user demographics. Omid, et al.[2019] developed an analytical assessment approach to identify the main factors (e.g., education, school facilities, health, social activities, and family) that affect graduate students' happiness level. Islam and Goldwasser [2020] designed a fusion model of neural networks with Attention to study Twitter users' happiness, and demonstrated that a large quantity of users in this study were "yoga Granger-causes happiness". However, the above approaches are a "black box" such that the model results are difficult to explain. This gradually becomes the main bottleneck for the application of DNN models to economic and political problems.
3 Methodology
In this section, we propose a novel method to use Shapley value with DNN together to account for interactions between multiple factors. Firstly, we introduce the preliminary theory of Shapley value which is built based on concepts from cooperative game theory. It has more universality for the modelagnostic (general) explanation. Then, the computational formula will be explained and used for explaining happiness factors prediction by simple and interpretable theoretical calculation. Finally, a sampling method is designed to use Shapley value with DNN to clarify how individual factors contribution to happiness prediction.
3.1 Shapley Value of Happiness Factors
In happiness prediction, the explainable methods to clarify the contribution of happiness factors may be further divided into two categories: model-specific and model-agnostic (general) methods [Aas et al., 2021]. As studied by Strumbelj and Kononenko [2014], the Shapley value has a series of desirable theoretical properties like efficiency, symmetry, dummy, and additivity. Therefore it's a "fair" distribution and can be employed to explain the results of general DNN models.
In our task, the 5-level degree needs to be predicted by analyzing the factors first. Moreover, the Attention and Shapley value are employed to explain the contribution of each factor. Considering the cooperative task of predicting happiness with coalition M factors and aiming at maximizing a prediction performance, we let S ⊆ {x1, · · · , xM} \ {xj} be a subset excluding the factor j and consisting of |S| factors. Assuming that the DNN model is a contribution function v(S) that maps subsets of factors to the outputs (i.e. the worth or contribution of coalition S). It describes the prediction performance of subset S by cooperation. The Shapley value is one way to distribute the total gains of the factors, assuming that they all collaborate. Therefore, the contribution of factor j is
where |S|!(M-|S|-1)! M! is the weight of a random permutation (i.e., the probability of subset S), and v(S∪{xj})-v(S) means the marginal contribution of factor j. In fact, the gain is a weighted average over contribution function difference in all subsets S, excluding the factor j.
However, it is obvious that there is a major drawback below need to solve:
Approximation for Shapley Values. A clever computationally tractable approximation to compute the Shapley values of Equation (1). In this work, we approximate calculate it by Shapley sampling.
3.2 Shapley SamplingWith DNN
The computation of Shapley value has an exponential time complexity and the happiness factors are various from different perspectives, which makes the method infeasible for happiness prediction in practice. Tackling this problem, an approximation based on Monte-Carlo Method is adopted to reduce the complexity [Strumbelj and Kononenko, 2014]. The equivalent formulation is introduced as Equation (2):
where ˆ f(·) is the worth or contribution of subset factors (i.e., the output of model). The dm+j and dm-j is the subset of with and without factor j in subset m, respectively.
The approximation algorithm is presented in Algorithm 1, in which Step 2-5 obtains sampled data; and Step 6-8 construct new data with or without consideration of a factor j. After that, Step 9 outputs the marginal contribution of this factor. Finally, Step 2-9 is run in a loop to deal with factors one by one. The Shapley value is acquired by averaging the results of multiple runs.
Algorithm 1: Contribution's approximation of the happiness factor j
Input: total number of factors M, happiness sample deep learning model f
4 Experiment
To verify the congruence with social science theory, we applied Shapley value to a series of DNN-based networks to demonstrate the theoretical and broad applicability of our solution. We compute each factor's contribution by Shapley value and show its interpretability of personal information, economics, and life-style. What's more, we evaluate our interpretability results through a systematic review of social science literature. The experiment data is available at Github 1 .
4.1 Dataset
The experiment is conducted on the Chinese General Social Survey (CGSS) 2015 dataset (full edition) -a large-scale social investigation dataset and widely used in sociological studies [Huang, 2017; Deng, 2019]. It contains 8000 samples, and each one has 140 factors that is divided into many categories. For example, personal information (gender, job, health), economics (family status, insur) and life-style (media, socialize, public services), etc.
As shown in Table 2, the attributes of each sample include Categories, Variable, Description, and Data Type. It should be noted that Description usually explains its value range or meaning of factors.
For the evaluation, the Macro-F1 and Micro-F1 are used for multi-classification model through k-fold cross-validation (k=5). The happiness is scaled in 5 levels (1-5), where higherlevel indicates more happiness.
We implemented the Attention and Shapley value in Python with TensorFlow and conducted experiments on a laptop equipped with an Intel Core i5 CPU and 16GB memory. For all baselines, we train the model by using Adam and set the epoch as 20. For other hyper-parameters, the batch size is set as 16, and hidden units as (256, 128, 64).
1 https://github.com/WUT-IDEA/Shapley value
| Categories | Factors | Description | Data Type |
|---|---|---|---|
| - | happiness | happiness scale of 1-5 | Ordinal |
| Personal information | health nationality | physical and Mental state nationality of citizen | Interval Nominal |
| Economics | family status insur | family economic stapeus belong to the which level social security program, including medical and pension | Nominal Binary |
| Life-style | media socialize equity | media usage frequency from 1-5 socializing frequency social equity | Ordinal Nominal Ordinal |
align with academic studies from social science through systematic reviews. Accordingly, we aim to address the following three research questions:
- RQ1. Whether there are multiple levels of nonlinear interaction among the happiness factors?
- RQ2. What are the differences between Attention mechanism and Shapley value in interpretability by quantitative analysis?
RQ3. Which method has the high quality of interpretability through the systematic review analysis in social science?
Accuracy Based Evaluation (RQ1)
Factors are the key to predicting happiness degree in machine learning models. Nevertheless, whether the factors are independent and how the interactions within multi-factors affect the prediction accuracy still needs to be investigated. In the experiment, the linear (e.g., LR and SVM) and deep learning models (e.g., Wide&Deep, DeepFM, and NFM) are employed for the investigation.
| Field | Model | Macro-F1 | Micro-F1 |
|---|---|---|---|
| social sciences | LR | 0.4051 | 0.4637 |
| SVM | 0.3630 | 0.4788 | |
| computational science | Wide&Deep | 0.4150 | 0.4832 |
| DeepFM | 0.4172 | 0.4825 | |
| NFM | 0.4168 | 0.4841 |
As shown in Table 3, the linear model performs poorly regardless of Macro-F1 and Micro-F1. Moreover, it appears that the Wide&Deep, DeepFM and NFM outperform the linear models with up to 5.42% (Macro-F1) and 2.04% (MicroF1) performance gain, and the NFM is the best in all experiments. Further studies reveal that NFM-based features' bi-interaction can achieve more factors permutation information than Wide&Deep and DeepFM. In addition, while the Wide&Deep and DeepFM rely more on the neural network to learn the combination of factors, their learning optimization method has higher complexity compared to NFM. Most importantly, the NFM-based factors' bi-interaction has comparable performance. It can also capture some second-order factors' combinations and the interaction among multi-factors. Hence, it is reasonable to conclude that multiple factors' interactions are crucial in happiness degree prediction and there are nonlinearity relations among factors.
4.2 Baselines
The baseline models are selected with consideration of both prediction accuracy and model interpretability. For prediction accuracy, we choose several general machine learning models (e.g., LR and SVM) and DNN-based models like Wide&Deep, which are widely used in social science and computational science respectively. Then, for model interpretability, Attention mechanism is employed as the baseline in our experiment. They are elaborated as follows:
Happiness Prediction Methods
- LR. Logistic Regression is widely used in sociology and economics because of its simplicity and explainability [Garaigordobil, 2015].
SVM. Support vector machine is a remarkable technique and has an outstanding ability to perform a classification task with high interpretability [Saputri and Lee, 2015].
Wide&Deep. Linear model is widely used in regression and classification problems and has the advantages of simplicity, rapidity, and explainability. However, its modeling ability is limited once facing complex problems. To this end, a fusion model, called Wide&Deep [Cheng et al., 2016], is to sum the results of each basic model linearly to improve the ranking accuracy.
DeepFM. A Factorization Machine model (FM) based Deep Neural Network which includes FM component and Deep component [Guo et al., 2017].
NFM. Neural Factorization Machine combines the linearity of FM in modeling second-order features interaction and the non-linearity of neural network in modeling higher-order feature interactions [He and Chua, 2017].
Interpretability Method
Attention. Attention mechanism is one of the solutions to remedy the lack of interpretability and has been frequently employed for explaining the deep model. It provides insights into how a model is operating. Attention is widely utilized for the explanation of model predictions in areas like NLP and computer vision.
4.3 Quantitative Analysis of Results
To evaluate the interpretability quality of our solution for citizen happiness prediction, we conduct experiments to clarify the factors that contribute to happiness and well-being. What's more, we will show how our experimental results
Interpretability Results (RQ2)
Attention provides an important way to explain the outputs of neural models, at least for tasks with an alignment modeled between inputs and outputs, like machine translation or summarization in NLP. Other studies in the computer vision field detect image areas that have a significant impact (i.e., highly focused weights) on text-generated image caption tasks by visualizing the attention.
In this section, the Attention and Shapley value are employed to explain the happiness prediction of Wide&Deep, DeepFM and NFM by the weight, respectively. We visualize the results of the top-5 key happiness factors computed by Attention and Shapley value.
As shown in Table 4, the top-5 key factors of Attention include equity, depression, family status, class and health, while the Shapley value includes equity, family status, class, depression, health for level-1 and equity, depression, health, class, family status for level-5. The difference could be from the mechanisms of their computing method. The Attention mechanism inspired by visual perception is widely used in the interpretability of DNN-based models. Benefiting from the solid theory and a series of desirable theoretical properties like efficiency, symmetry, dummy, and additivity, Shapley value is also employed in the explanation of model-agnostic (general). However, how to judge the interpretability quality of models is still a challenge.
| Attention Shapley | value | ||
|---|---|---|---|
| level-1 & level-5 | level-1 | level-5 | |
| 1 | equity | equity | equity |
| 2 | depression | family status | depression |
| 3 | family status | class | health |
| 4 | class | depression | class |
| 5 | health | health | family status |
Systematic Review Analysis (RQ3)
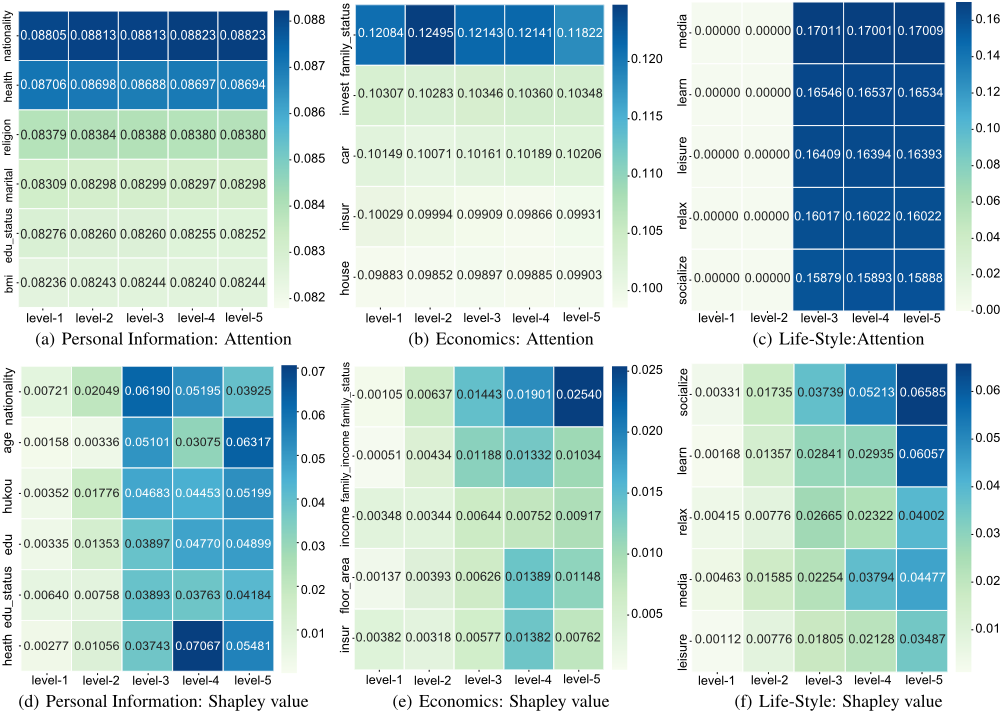
In this section, we will analyze the mapping study with sociological literature to judge which explainable method is more credible. To this end, we visualize the Attention weight and Shapley value of each factor under several factor types, such as personal information, economics and life-style.
Personal Information. From the happiness studies in social science, researchers argued that marital status, education, religious, health and et al. affect citizens' happiness.
As shown in Figure 1 (a), the most important factor is nationality in Attention. That's probably on account of the political and economic policies of different countries. However, Shapley value displays the most important one is health (Figure 1 (d)), which completely agrees with sociological studies [Li and Wang, 2015; Huang, 2017; Deng, 2019]. Especially, psychological health is the main contribution to happiness, and it is revealed that citizens of poverty generally have poorer health, which results in less happiness by National Health Survey. On the one hand, the deterioration of health will directly affect employment situation and reduce happiness; on the other hand, ill worker will affect work status and result in impeding happiness. Overall, there is more sociology literature to support the result of Shapley value (health), yet little to the Attention method (nationality). Therefore, the interpretability of Shapley value is more credible.
Economics. Economics factors like income, job and fixed assets are important in enhancing individual happiness. From the experimental results, it's obvious that family status, invest and car are the top-3 factors to happiness in Figure 1 (b).
On the contrary, the family status, floor area and insur are more crucial to happiness by Shapley value as shown in Figure 1 (e). The family status, meaning family's economic level, has the largest contribution to happiness. Specifically, Tella [2006] observed that happiness responses are positively correlated with individual income at any point in time: the rich report greater happiness than the poor. Furthermore, individual happiness is a positive correlation with real GDP and household income per capita. In terms of the findings of [Oshio et al., 2011], in Japan and Korea, citizens usually gains more happiness through more family relative income. Moreover, most studies of medical insurance [Kotakorpi and Laamanen, 2010] and pension system as a risk-hedging device can increase objective well-being by providing certainty in the imperfect market [Shin, 2018]. The biggest contributing factor of Attention is same as Shapley value (i.e., family status) though there is little difference in other factors.
Life-Style. As shown in Figure 1 (c), the biggest contribution's factor of Attention is media, and socialize is the last one. On the contrary, socialization and media in the result sequence of Shapley value are the first and fourth respectively.
From the social science studies, the happiness degree of citizens is impacted by lifestyle and reflects the living standard of all age groups. The richer and more diversified lifestyle, the more positive and optimistic attitude, and the more happiness of residents [Di, 2018]. Many researchers [Tang et al., 2012] found that socializing is a crucial factor in lifestyle (as clear shown in Figure 1 (f) by Shapley value) rather than media and learning. Social media has an inevitable impact on users' social psychology, thus it will affect their happiness. Social media expresses the inner feelings of users to others through interaction, sharing sense of existence and obtaining self-affirmation to increase users' positive emotions and improve life satisfaction. Meanwhile, content creation, acquisition and sharing are realized through social media. Once the generated content is adopted, users will have a pleasant feeling of satisfaction. It can also help users achieve a higher level of accomplishment and more positive well-being that the information and knowledge acquired from the generated content. Hence, the contributions computed by Shapley value have more accurate support than Attention in terms of the congruence with social science theories.
All Factors. In terms of all happiness factors, the top-5 important factors are shown in Table 4. In detail, the equity, depression, family status in Attention, and equity, depression, health in Shapley value are the crucial factors in individual happiness, respectively. The top-2 key factors in Attention is same as Shapley value probably because of the great influence of public service in citizens. Based on the Chinese national conditions, the main factors of happiness gradually changed from low income to the widening income gap in economics.
Subsequently, the equality of opportunity upward, such as promotion and education, is the prerequisite for maintaining individual happiness. Sociologists studied social equity and argued that it is a critical condition and has great influence on the improvement of individual happiness. Furthermore, social inequality greatly destroys citizens' happiness through a series of theoretical and solid evidence [Xu and Chen, 2017].
What's more, due to their computing mechanisms, the result of Shapley value is distinct for diverse happiness degrees. However, the Attention weights are same at level-1 and level5, which is not practical in real-world applications.
5 Conclusions and FutureWork
Happiness prediction is an effective and indispensable means for decision-making support in social science, especially in economics and politics, yet interpretability is crucial in practice. This work explores the contribution of factors (e.g., personal information, economics, and life-style) in happiness prediction for citizens, and answers the three research questions. We compared the performance of Attention and Shapley value in terms of interpretability with a systematic review analysis to clarify which factor is more crucial for decision-making support in social science. The evaluation results demonstrate that the Shapley value is promising in solid theory for factor contribution interpretability.
Notwithstanding the challenging task and hopeful results, several future directions are outlined in our work. The main disadvantage of Shapley value is that the computational complexity grows exponentially and becomes intractable for more features. Therefore, in future work, we will focus on the optimizing sampling method that requires less computational power to obtain a similar approximation accuracy.
Acknowledgments
This paper is partially supported by Grant 2021BAA030 from Department of Science and Technology of Hubei province, Grant 62106070 and 61876062 from National Science Foundation of China, Grant DP220101360 from the Australian Research Council, and Grant 21A0319 from Hunan Provincial Education Department.
@inproceedings{ijcai2022p707,
  title     = {Towards the Quantitative Interpretability Analysis of Citizens Happiness Prediction},
  author    = {Li, Lin and Wu, Xiaohua and Kong, Miao and Zhou, Dong and Tao, Xiaohui},
  booktitle = {Proceedings of the Thirty-First International Joint Conference on
               Artificial Intelligence, {IJCAI-22}},
  publisher = {International Joint Conferences on Artificial Intelligence Organization},
  editor    = {Luc De Raedt},
  pages     = {5094--5100},
  year      = {2022},
  month     = {7},
  note      = {AI for Good},
  doi       = {10.24963/ijcai.2022/707},
  url       = {https://doi.org/10.24963/ijcai.2022/707},
}
TY - CPAPER TI - Towards the Quantitative Interpretability Analysis of Citizens Happiness Prediction AU - Li, Lin AU - Wu, Xiaohua AU - Kong, Miao AU - Zhou, Dong AU - Tao, Xiaohui T2 - Proceedings of the Thirty-First International Joint Conference on Artificial Intelligence, IJCAI-22 PB - International Joint Conferences on Artificial Intelligence Organization PY - 2022 SP - 5094 EP - 5100 DO - 10.24963/ijcai.2022/707 UR - https://doi.org/10.24963/ijcai.2022/707 ER -Copied
Machine-readable versions of this paper, for tools and AI agents:





