
Learning in CubeRes Model Space for Anomaly Detection in 3D GPR Data
Proceedings of the Thirty-Third International Joint Conference on Artificial Intelligence. Main Track. Pages 5662-5670.
https://doi.org/10.24963/ijcai.2024/626
Keywords
- Machine Learning: ML: Applications
- Machine Learning: ML: Recurrent networks
- Machine Learning: ML: Classification
Abstract
Three-dimensional Ground Penetrating Radar (3D GPR) data offer comprehensive views of the subsurface, yet identifying and classifying underground anomalies from this data is challenging due to limitations like scarce training data and variable underground environments. In response, we introduce learning in the Cube Reservoir Network (CubeRes) model space for efficient and accurate subsurface anomaly detection. CubeRes, incorporating three reservoirs, captures the dynamics in both horizontal and vertical directions inherent in the 3D GPR data. Fitting the data with CubeRes, representing the data with the compact fitted model, and measuring the difference between models by a proposed parameterized model metric, the original data is transformed from the data space to the CubeRes model space. Subsequently, we introduce an optimization strategy in this model space, aimed at bolstering fitting accuracy and improving category discrimination. This enhancement facilitates a more nuanced differentiation of dynamics across various GPR data categories, thereby enabling effective classification on the models rather than the original data. Experiments on real-world data validate our method's effectiveness and superiority, particularly in data-limited scenarios.
- [Bai et al., 2023] Xu Bai, Yu Yang, Zhitao Wen, Shouming Wei, Jiayan Zhang, Jinlong Liu, Hongrui Li, Haoxiang Tian, and Guanting Liu. 3d-gpr-rm: A method for under- ground pipeline recognition using 3-dimensional gpr im- ages. Applied Sciences, 13(13), 2023.
- [Bianchi et al., 2020] Filippo Maria Bianchi, Simone Scar- dapane, Sigurd Løkse, and Robert Jenssen. Reservoir computing approaches for representation and classification of multivariate time series. IEEE transactions on neural networks and learning systems, 32(5):2169-2179, 2020.
- [Chen and Cohn, 2011] Huanhuan Chen and Anthony G Cohn. Buried utility pipeline mapping based on multi- ple spatial data sources: a bayesian data fusion approach. In Proceedings of the Twenty-Second International Joint Conference on Artificial Intelligence, volume 11, pages 2411-2417, 2011. IJCAI
- [Chen et al., 2013] Huanhuan Chen, Peter Tiňo, Ali Rodan, and Xin Yao. Learning in the model space for cognitive fault diagnosis. IEEE transactions on neural networks and learning systems, 25(1):124-136, 2013.
- [Chen et al., 2014] Huanhuan Chen, Peter Tiňo, and Xin Yao. Cognitive fault diagnosis in tennessee eastman pro- cess using learning in the model space. Computers & chemical engineering, 67:33-42, 2014.
- [Chen et al., 2015] Huanhuan Chen, Fengzhen Tang, Peter Tino, Anthony G Cohn, and Xin Yao. Model metric co- learning for time series classification. In Proceedings of the twenty-fourth international joint conference on artifi- cial intelligence, pages 3387-3394. AAAI Press, 2015.
- [Chen et al., 2023] Ao Chen, Xiren Zhou, Yizhan Fan, and Huanhuan Chen. Underground diagnosis based on gpr and learning in the model space. IEEE Transactions on Pattern Analysis and Machine Intelligence, pages 1-14, 2023.
- [Chiu and Minku, 2022] Chun Wai Chiu and Leandro L. Minku. A diversity framework for dealing with multiple types of concept drift based on clustering in the model space. IEEE Transactions on Neural Networks and Learn- ing Systems, 33(3):1299-1309, 2022.
- [Dai et al., 2023] Qiqi Dai, Yee Hui Lee, Hai-Han Sun, Genevieve Ow, Mohamed Lokman Mohd Yusof, and Ab- dulkadir C. Yucel. 3dinvnet: A deep learning-based 3d ground-penetrating radar data inversion. IEEE Transac- tions on Geoscience and Remote Sensing, 61:1-16, 2023. Gong et al., 2018] Zhichen Gong, Huanhuan Chen, Bo Yuan, and Xin Yao. Multiobjective learning in the model space for time series classification. IEEE transactions on cybernetics, 49(3):918-932, 2018.
- [Goodman et al., 2013] Dean Goodman, Salvatore Piro, Dean Goodman, and Salvatore Piro. Multi-channel gpr. GPR Remote Sensing in Archaeology, pages 175-185, 2013.
- [He et al., 2016] Kaiming He, Xiangyu Zhang, Shaoqing Ren, and Jian Sun. Deep residual learning for image recog- nition. In Proceedings of the IEEE conference on computer vision and pattern recognition, pages 770-778, 2016.
- [Jaeger, 2001] Herbert Jaeger. The "echo state" approach to analysing and training recurrent neural networks-with an erratum note. Bonn, Germany: German National Re- search Center for Information Technology GMD Technical Report, 148(34):13, 2001.
- [Kang et al., 2019a] Man-Sung Kang, Namgyu Kim, Seok Been Im, Jong-Jae Lee, and Yun-Kyu An. 3d gpr image-based ucnet for enhancing underground cavity detectability. Remote Sensing, 11(21), 2019.
- [Kang et al., 2019b] Man-Sung Kang, Namgyu Kim, Seok Been Im, Jong-Jae Lee, and Yun-Kyu An. 3D GPR image-based UcNet for enhancing underground cavity detectability. Remote Sensing, 11(21):2545, 2019.
- [Liang et al., 2022a] Xingmin Liang, Xin Yu, Chen Chen, Yong Jin, and Jiandong Huang. Automatic classification of pavement distress using 3d ground-penetrating radar and deep convolutional neural network. IEEE Transactions on Intelligent Transportation Systems, 23(11):22269-22277, 2022.
- [Liang et al., 2022b] Xingmin Liang, Xin Yu, Chen Chen, Yong Jin, and Jiandong Huang. Automatic classification of pavement distress using 3d ground-penetrating radar and deep convolutional neural network. IEEE Transactions on Intelligent Transportation Systems, 23(11):22269-22277, 2022.
- [Liu et al., 2021] Zhen Liu, Wenxiu Wu, Xingyu Gu, Shuwei Li, Lutai Wang, and Tianjie Zhang. Application of com- bining yolo models and 3d gpr images in road detection and maintenance. Remote Sensing, 13(6):1081, 2021.
- [Liu et al., 2022] Li Liu, Hang Yu, Hang Xu, Bingjie Wang, and Jingxia Li. Underground object classification using deep 3-d convolutional networks and multiple mirror en- coding for gpr data. IEEE Geoscience and Remote Sensing Letters, 19:1-5, 2022.
- [Ma et al., 2020] Qianli Ma, Sen Li, Wanqing Zhuang, Ji- abing Wang, and Delu Zeng. Self-supervised time series clustering with model-based dynamics. IEEE Transactions on Neural Networks and Learning Systems, 32(9):3942- 3955, 2020.
- [Quevedo et al., 2014] Joseba Quevedo, Huanhuan Chen, Miquel À Cugueró, Peter Tino, Vicenc ¸Puig, Diego Garciá, Ramon Sarrate, and Xin Yao. Combining learning in model space fault diagnosis with data validation/recon- struction: Application to the barcelona water network. En- gineering Applications of Artificial Intelligence, 30:18-29, 2014.
- [Simonyan and Zisserman, 2014] Karen Simonyan and An- drew Zisserman. Very deep convolutional networks for large-scale image recognition. arXiv preprint arXiv:1409.1556, 2014.
- [Tran et al., 2015] Du Tran, Lubomir Bourdev, Rob Fergus, Lorenzo Torresani, and Manohar Paluri. Learning spa- tiotemporal features with 3d convolutional networks. In Proceedings of the IEEE international conference on com- puter vision, pages 4489-4497, 2015.
- [Van der Maaten and Hinton, 2008] Laurens Van der Maaten and Geoffrey Hinton. Visualizing data using t-sne. Journal of machine learning research, 9(11), 2008.
- [Wu et al., 2022] Jiamin Wu, Xiren Zhou, and Qiuju Chen. A characteristic of speaker's audio in the model space based on adaptive frequency scaling. In 2022 8th Interna- tional Conference on Big Data and Information Analytics (BigDIA), pages 99-103. IEEE, 2022.
- [Zhou et al., 2018] Xiren Zhou, Huanhuan Chen, and Jin- long Li. An automatic GPR b-scan image interpreting model. IEEE Transactions on Geoscience and Remote Sensing, 56(6):3398-3412, 2018.
- [Zhou et al., 2023] Xiren Zhou, Shikang Liu, Ao Chen, Qi- uju Chen, Fang Xiong, Yumin Wang, and Huanhuan Chen. Underground anomaly detection in GPR data by learning in the c3 model space. IEEE Transactions on Geoscience and Remote Sensing, pages 1-11, 2023.
References were extracted automatically from the PDF and may contain errors.
Full text extracted automatically from the PDF; figures, tables and equations may differ. The PDF is the version of record.
1 Introduction
Ground Penetrating Radar (GPR), utilizing Electromagnetic (EM) waves, serves as a pivotal tool for identifying subsurface facilities or anomalies beneath urban roads [Chen and Cohn, 2011]. It functions by emitting high-frequency waves, with the reflected signals providing insights into the varying compositions and characteristics beneath the surface [Zhou et al., 2018]. Integrating multi-channel technology within GPR systems enables the simultaneous acquisition of EM waves through multiple antennas, obtaining the 3D GPR data for analyzing subsurface conditions [Goodman et al., 2013].
Underground anomaly detection in the real world involves segmenting GPR data to identify and confirm segments containing subterranean diseases [Zhou et al., 2023]. The further process involves locating and repairing these areas. However, manually processing 3D GPR data to detect and extract segments with underground anomalies is highly laborious and time-consuming. While image or signal feature extraction and classification algorithms assist in segmenting and categorizing GPR data, they struggle with the varying characteristics of subsurface media or anomalies, influenced by their composition, size, and environment. Recent developments have seen an increased focus on Deep Learning (DL) methods, particularly Convolutional Neural Networks (CNNs), in object and anomaly detection within 3D GPR data [Liu et al., 2021; Liang et al., 2022a]. However, DL approaches face notable challenges in this task. 1) Primarily, the scarcity of available GPR data, which involves various underground conditions, makes obtaining ample training data challenging. 2) Additionally, the varying underground environments complicate the generalization capacity of DL models, hindering their ability to adapt across different or novel subsurface scenarios. 3) Furthermore, the inherent complexity and extensive parameterization of DL models, especially the 3D-CNN-based ones, necessitate heightened computational resources.
∗Corresponding author: Huanhuan Chen.
In light of the challenges in analyzing 3D GPR data, the Model-Space Learning (MSL) framework presents a promising alternative [Chen et al., 2013]. MSL transforms the data from the data space to the model space by fitting the data with proper models that capture and describe the dynamics (i.e., changing information) within the data. Thus the fitted models could be used as more stable and parsimonious representations of the data, enabling learning algorithms to be effectively implemented on the models rather than the original data. Applied successfully in [Chen et al., 2015] using the Echo-State-Network-based (ESN-based) methods to fit and represent temporal signals, MSL has demonstrated its efficacy in various applications, including the diagnosis of the Barcelona water network [Quevedo et al., 2014] and the Tennessee Eastman Process [Chen et al., 2014], along with diverse time-series classification tasks [Gong et al., 2018; Wu et al., 2022]. Notably, MSL emphasizes data's intrinsic dynamics, requiring less training data and fewer computational resources than many DL techniques, especially when coupled with suitable model configurations [Ma et al., 2020].
For 3D GPR data processing, the MSL framework, while potent, encounters specific challenges. 1) MSL traditionally fits data uni-directionally to capture internal dynamics, predominantly for sequential data with strong contextual correlations. However, 3D GPR data exhibits both vertical continuity along EM waves and horizontal correlations due to the subsurface medium consistency. Effectively capturing these multi-directional dynamics is crucial for accurate fitting and representation of 3D GPR data. 2) Employing networks with fixed parameters for data fitting and dynamic capture, along with using non-adjustable model metrics to measure the difference between models fitted from diverse GPR data, prove inadequate for varying data-collecting scenarios. Such limitations pose significant challenges in both achieving accurate data fitting and representation, as well as in constructing a "category-discriminative" model distribution.
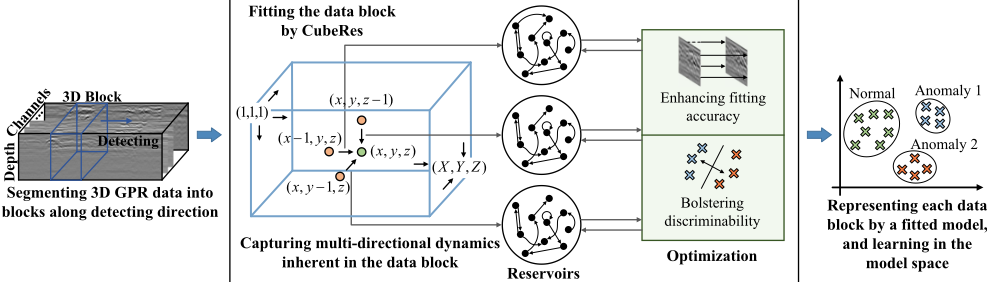
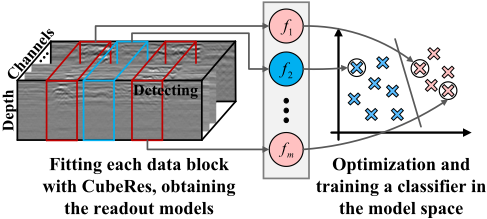
In this paper, we propose learning in the Cube Reservoir Network (CubeRes) model space for subsurface anomaly detection in 3D GPR data, as illustrated in Figure 1. We segment the 3D GPR data into blocks, with data segments in each block, referred to as GPR data blocks, being fitted by CubeRes. In 3D GPR data, each point is correlated with surrounding points in multiple directions. Different underground structures show different changing information in the GPR data. The proposed CubeRes integrates three reservoirs to comprehensively capture the multi-directional dynamics in horizontal and vertical directions. By constructing the connections between the points within the data in multiple directions, fitting the data block with CubeRes effectively captures the dynamics inherent in the data, obtaining a compact fitted readout model. A parameterized model metric is further introduced. Representing each original data block with a fitted model, coupled with the proposed distance metric between models, forms the CubeRes model space 1 .
We further implement an optimization algorithm in this model space, adjusting the parameters of both the CubeRes used to fit the data and the model metric, enhancing the fitting accuracy and bolstering the category discriminability of models, thus aiding in the distinction of models derived from different types of GPR data. Through the above, GPR data blocks formed by similar underground structures would be transformed into similar CubeRes readout models, while models fitted from GPR data blocks generated by different underground structures would have large differences due to the different dynamics captured. Finally, classification is conducted within this model space to categorize each readout model, thereby identifying corresponding GPR data blocks containing subsurface anomalies.
1 In this paper, "CubeRes" refers to the network for 3D GPR data fitting, yielding the fitted "CubeRes readout model" for data representation, also short-termed as "CubeRes model".
The main contributions of this paper are as follows:
- We introduce the Cube Reservoir Network (CubeRes), a novel network that adequately captures both horizontal and vertical dynamics inherent in the 3D GPR data into a compact fitted readout model. Representing the original 3D GPR data with the fitted model allows for further processing on the models rather than the original data.
- Our approach departs from fixed model metrics, employing an adaptive parameterized metric within the model space. We further complement the optimization of this metric and CubeRes parameters according to different underground scenarios, enhancing its ability for more accurate fitting and dynamic capture, also resulting in a more category-discriminative model space.
- The effectiveness of the proposed approach is demonstrated through experiments on real-world GPR datasets, which significantly outperforms the compared methods, particularly in scenarios with limited data availability.
2 RelatedWork
2.1 3DGPRData Analyzing
Multi-channel 3D GPR data represents an advanced approach in subsurface imaging. Unlike single-channel GPR systems obtaining the 2D GPR data, multi-channel GPR utilizes an array of antennas, transmitting and receiving EMwaves simultaneously across multiple channels, as illustrated in Figure 2.
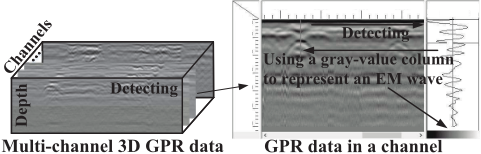
In 3D GPR data, valuable changing information presents not only in the vertical direction (the direction of EM waves) and along the detection path, but also across different channels.
Recent DL methods primarily adopt two strategies for analyzing 3D GPR data. 1) The first involves the direct analysis of 3D data. For instance, Liu et al. [2022] employ multiple mirror encoding (MME) for data augmentation across diverse 3D GPR data sizes, integrating the C3D network [Tran et al., 2015] for spatio-temporal feature learning. 3DInvNet [Dai et al., 2023] utilizes a prior 3D CNN and a feature attention mechanism to suppress noise, followed by a 3D U-shaped encoder-decoder network with multiscale feature aggregation modules, mapping underground 3D permittivity maps. 2) The second extracts single-channel or cross-sectional profiles from 3D GPR data, further merging and analyzing the obtained results. For instance, UcNet [Kang et al., 2019a] integrates CNN with phase analysis for super-resolution (SR) GPR data. Similarly, Liang et al. [2022b] involve the comparison of VGG and ResNet for classifying GPR data containing underground anomalies. For 3D GPR data analysis, DL approaches face critical challenges: DL models tend to be complex and parameter-heavy, especially the 3D CNNs, while handling channels individually risks overlooking interchannel dynamics in 3D GPR data.
2.2 Model-Space Learning
The MSL framework was first proposed in [Chen et al., 2013] and applied to fault diagnosis in sequential data. Existing MSL-based methods employ ESN to fit individual data instances. Each instance is represented by a fitted model, and mapped into a model space with a defined model metric. Effective classification is then conducted within this space, leveraging the dynamics captured from the data. The versatility of MSL has extended to applications like time series classification, disease diagnosis [Bianchi et al., 2020], and tackling concept drift [Chiu and Minku, 2022].
Turning to the application of MSL in GPR data, existing studies [Zhou et al., 2023; Chen et al., 2023] proposed to detect anomalies in 2D GPR data, employing ESN-based network to fit data, capturing dynamics within the data both horizontally and vertically, and further classifying the fitted models. Though it has been explored to extend this to 3D GPR
data by processing each channel separately, some limitations remain: 1) 3D GPR data, offering extensive changing information beyond the aggregation from single-channel data, is not fully utilized in this way as it fails to capture the dynamics between channels, particularly in the horizontal dimension. 2) Existing studies utilize fixed metric and network parameters, and do not include adaptive adjustment, which could be vital for adapting to diverse subsurface environments. 3) The usage of ESNs combined with the multi-channel fitting strategy leads to extremely high-dimensional fitted models, significantly impeding computational efficiency.
2.3 Brief Introduction of Echo State Network
Echo State Networks (ESNs) represent a unique subclass of Recurrent Neural Networks, famed for the simplicity and efficacy in sequential data processing. The structure of an ESN includes an input layer, a hidden layer known as the reservoir, and an output layer. Figure 3 illustrates the ESN structure.
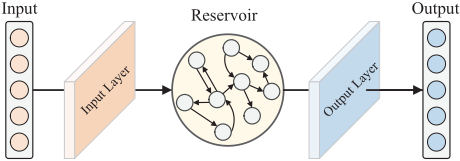
A notable aspect of ESNs is the randomized and fixed input weights and reservoir weights. It is also essential for ESNs to maintain the Echo State Property (ESP), ensuring stability and proper functioning. For sequential data fitting, after the computation of the hidden state for each point, the output layer maps these states onto the target sequence, with the output weights determined through ridge regression. Despite the efficacy of ESN in fitting sequential data, it exclusively captures the dynamics along the iterated direction, while overlooking the nuances in others, and fails to comprehensively capture the dynamics in multi-dimensional data.
3 Methodology
The entire process of our approach is divided into the following three stages:
- Fitting GPR data with CubeRes. Fitting each segmented GPR data block using CubeRes. The fitted readout model that captures the multi-directional dynamics inherent in the data block is then used to represent the original data block.
- Optimizing the CubeRes model space. A parameterized metric is defined on the fitted models to measure their pairwise difference. The CubeRes and the metric are optimized to enhance fitting accuracy and bolster the category-discriminability between the fitted models.
- Anomaly detection in the model space. Classifying the models derived from the data blocks within the model space, thus identifying the corresponding GPR data blocks containing subsurface anomalies.
The content of these stages are detailed in the Subsections 3.1, 3.2, and 3.3, respectively.
3.1 Fitting Data by Cube Reservoir Network
Similar to ESN, CubeRes comprises an input layer, a hidden layer, and an output layer. However, to adequately capture the multi-directional dynamics inherent in GPR data, it integrates three reservoirs in the hidden layer (Figure 1) to establish correlations among adjacent points in multiple directions.
Denoting a 3D GPR data block as U ∈ RX×Y ×Z , wherein a point within this block is located by (x, y, z), and the corresponding value at that point is u(x, y, z). As in Figure 4, the iteration of CubeRes begins at the point (1, 1, 1) and ends at (X, Y,Z). Sequentially, each point is sent into the hidden layer, with their hidden states h calculated as:
where g is the activation function tanh; Wx , Wy , andWz represent the reservoir weights 2 in the three respective directions; andWin denotes the input weights. These parameters within CubeRes, namely Θ = (Win ,Wx ,Wy ,Wz ), are randomly initialized and will be further optimized (detailed in Subsection 3.2).
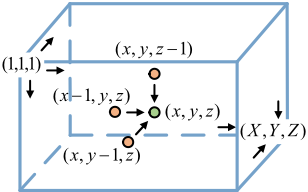
During the iteration process as Equation (1), the hidden state at a point is determined by the value of the current data point as well as the preceding hidden states, establishing correlations among adjacent hidden states in different directions. As the iteration continues, these correlations persist, forming a network of connections. This links each point in the data to previously processed points across multiple directions, effectively retaining multi-directional dynamics within the data.
After the hidden states of all the points within the data block are calculated, the output layer computes the output value v for each point using the preceding hidden states:
2 The reservoir weights are required to satisfy the Echo State Property (ESP) [Jaeger, 2001].
In this paper, the fitting task is accomplished by the "next point prediction task" [Chen et al., 2013], that is to predict the value of the next data point using the processed points by associating hidden states with the input data points. Specifically, it requires that the output values (i.e., v) calculated from the preceding hidden states closely approximate the input values (i.e., u). In this case, the output weights Wout can be solved using ridge regression:
where H is a matrix formed by horizontally stacking hpre (x, y, z) at each point, that is, each column is a hpre at a specific point (x, y, z); u is a row vector comprising u(x, y, z), arranged in a sequential order that aligns with the column order in H; α is a regularization parameter; and I is identity matrix.
Through the whole fitting process, the correlation between adjacent points in the data block is effectively modeled by CubeRes's unique iterative approach. The multi-directional dynamic information within the data block is captured and encapsulated into a compact CubeRes readout model:
Following this, the readout model serves as a compact representation of the original data block. When a specific type of anomaly occurs in the data block, unusual dynamic information emerges, resulting in a fitted model that behaves distinctly versus those derived from normal data blocks. Consequently, further classification could be more effectively applied to these models, rather than the original data blocks.
3.2 Optimizing the CubeRes Model Space
We seek to construct a model space where the distribution of models is category-discriminative. This requires the CubeRes to accurately capture the dynamics inherent in the fitted data, and the metric between models effectively differentiates the dynamics captured from different types of data.
We first define a parameterized model metric, thus constructing a model space consisting of CubeRes readout models and the metric between models. After that, we conduct optimization within this space, employing two penalty terms to achieve the following two objectives. 1) Enhance the fitting accuracy to make the fitted models more accurately capture the inherent dynamics, thus more representative of the data blocks. 2) Bolster the category-discriminability in the model space by optimizing the parameters of CubeRes and training an appropriate model metric.
Metric between CubeRes Models
A model metric is defined to measure the differences between various CubeRes readout models. Formally, for any two data blocks Um and Un, their derived CubeRes readout models are denoted as fm and fn respectively (in the form of Equation (4)), and our model metric is defined as:
where ∥ · ∥2F is the square of Frobenius norm, defined as the sum of the absolute squares of the matrix elements. Unlike most MSL-based methods that employ a fixed model metric, in Equation (5), we introduce a parameterized matrix G, enabling adaptive weighting for elements in Wout . This innovation renders our metric flexible and trainable, with enhanced potential to differentiate models capturing distinct dynamics inherent in different types of data.
Enhancing Fitting Accuracy
To enhance the fitting accuracy of CubeRes, the Mean Square Error (MSE) between the output value v(x, y, z) and the approximate target u(x, y, z) should be minimized. Assume a training set composed of N data blocks, denoted as U = {U1, . . .UN}. We introduce the first penalty term to quantify the fitting error:
where M is the number of data blocks, and the subscript m indicates the index; the form of Hm and um is the same as in Equation (3); and β is a regularization parameter.
Bolstering Category-Discriminability
We optimize the parameters of CubeRes (i.e., Θ) and those of the model metric (i.e., G), aiming to maximally bolster the models' category-discriminability in the model space. Ideally, we desire models derived from the same type of data blocks to be closer, and those from different types of data blocks to be distant. This leads to the second penalty:
where tm indicates the type of the data block Um, and δ(fm, fn) is the model metric defined in Equation (5).
Overall Optimization Objective
By combining Equations (6) and (7), our overall optimization objective is as follows:
where η is the trade-off between Q1 and Q2. In practice, this optimization is implemented through gradient descent.
3.3 Anomaly Detection inModel Space
Real-word detection involves identifying the location and type of the subsurface anomaly in the collected 3D GPR data. Our approach involves the training and detecting phases.
Training Phase
Given 3D GPR data that is collected and manually labeled (normal or containing a specific anomaly), we employ a fixedsized 3D block to swipe and segment the data along the detection direction, obtaining a set of data blocks with label information. As shown in Figure 5, we fit these blocks and obtain a set of CubeRes readout models. Through the approach illustrated in Subsection 3.2, the CubeRes is optimized, and an appropriate model metric is also determined, forming a category-discriminative model space. After that, a classifier, such as KNN or SVM, is trained within this space given the labeled models and the determined model metric.
Detecting Phase
For GPR data subsequently collected in similar underground environments, the same-size block is swiped, obtaining a series of data blocks. These data blocks are fitted by the above-optimized CubeRes, obtaining the corresponding readout models that are further classified through the trained classifier in the model space, thus the corresponding data blocks are also identified to be normal or containing a specific type of anomaly. Therefore, the subsurface anomaly is detected by extracting and locating the classified data block. When a series of consecutive data blocks are detected with the same type of anomaly, the combined range of them is identified as the final area range of that anomaly.
4 Experimental Study
Experiments on real-world 3D GPR datasets are conducted. The results demonstrate the effectiveness of our approach, particularly under limited training data.
4.1 The Utilized 3D-GPR data
The data is collected along cement and asphalt roads, both the most common and widely used road types. A MALA 3D GPR system is adopted, equipped with an antenna of 16 parallel channels, and the interval of adjacent channels is approximately 0.15 meters. We segment the collected data using a 3D block with a size of 16×200×200. This corresponds to a physical area of 2.4m (width) × 2m (detecting direction) × 2m (depth). The amount of GPR data blocks for each category is detailed in Table 1.
| Normal | Cavity | Looseness | Water-rich | Crack | Pipeline | Manhole |
|---|---|---|---|---|---|---|
| 500 | 218 | 231 | 228 | 220 | 216 | 203 |
| Training/Test | 90%/10% | 70%/30% | 50%/50% | ||||||
|---|---|---|---|---|---|---|---|---|---|
| Pre | Rec | F1 | Pre | Rec | F1 | Pre | Rec | F1 | |
| VGG | 85.36% | 87.52% | 86.43% | 72.31% | 79.05% | 75.53% | 73.05% | 75.01% | 74.02% |
| ResNet | 88.23% | 89.21% | 88.72% | 80.14% | 81.29% | 80.71% | 73.27% | 74.09% | 73.68% |
| DS-3D-AlexNet | 85.63% | 89.57% | 87.56% | 78.25% | 77.21% | 77.73% | 72.14% | 75.82% | 73.93% |
| UcNet | 89.12% | 92.02% | 90.55% | 82.47% | 87.15% | 84.75% | 77.74% | 76.51% | 77.12% |
| 3D-VGG | 90.42% | 90.13% | 90.27% | 84.32% | 83.02% | 83.66% | 75.82% | 75.50% | 75.66% |
| 3D-ResNet | 90.25% | 92.02% | 91.13% | 86.24% | 86.61% | 86.42% | 77.29% | 78.71% | 77.99% |
| M-C3D | 89.28% | 90.28% | 89.78% | 87.21% | 85.31% | 86.25% | 76.55% | 79.55% | 78.02% |
| Proposed Approach | 93.76% | 94.46% | 94.11% | 91.00% | 90.01% | 90.50% | 90.54% | 90.14% | 90.34% |
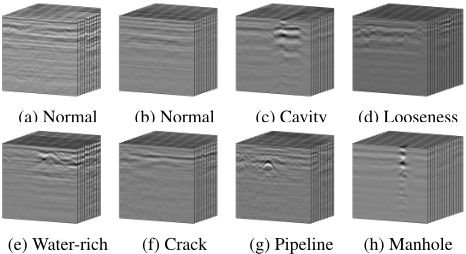
Four major types of subsurface diseases appear in our experiments: cavity, looseness, water-rich, and crack. Besides, the collected GPR data includes data formed by pipelines and manhole covers (denoted as manhole) also should be identified. Figure 7 gives some examples of the GPR data blocks.
4.2 The Baseline Methods
We benchmark our approach against multiple baseline methods, broadly categorized into two types. 1) The first type encompasses methods that process 3D data either as images or by converting them into image-like structures for analysis. This includes renowned and effective network architectures, that is, VGG16 [Simonyan and Zisserman, 2014] and ResNet18 [He et al., 2016], widely recognized for their robust performance across various image processing tasks. Additionally, a novel UcNet [Kang et al., 2019b] is employed, which transforms 3D data into 2D grid figures before feeding it into networks. 2) The second type deals directly with 3D data. This includes 3D adaptations of traditional architectures, namely 3D-VGG and 3D-ResNet. Moreover, we explore M-C3D [Liu et al., 2022], which interprets 3D data as a sequence of images akin to a video stream, thus leveraging the temporal or sequential aspect of 3D information for enhanced contextual understanding. Lastly, we incorporate DS-3D-AlexNet [Bai et al., 2023], using depth-wise separable convolutions to reduce the parameter count and increase training efficiency.
We did not experiment with the traditional MSL method that employs ESN to fit GPR data blocks and classify the ESN readout model due to the impractical size of the ESN readout model. Fitting the data block along the detecting direction, the size of the ESN readout model is 200×16×reservoir size, fails to be directly classified. As for the CubeRes, along with a comprehensive capture of multi-directional dynamics, a more compact readout model size 3×reservoir size is obtained, facilitating efficient learning on the fitted models.
4.3 Experimental Results and Discussion
We varied the training and testing data splits at 90%, 70%, and 50% for training, with the remaining portions for testing, as detailed in Table 2. In our approach, the reservoir size of CubeRes is set to 50, and the default classifier in the readout model space is KNN 3 . The results demonstrate that 2D-based methods for 3D GPR data analysis underperform compared to direct 3D data processing. As the proportion of training data decreases, there is a uniform reduction in accuracy, recall, and F1-Score across all methods. However, our proposed method exhibits superior stability and performance, maintaining higher metrics across all data splits.
| Training/Test | w/o Opt. | Optimized | ||||
|---|---|---|---|---|---|---|
| Pre | Rec | F1 | Pre | Rec | F1 | |
| 90%/10% | 86.67% | 87.26% | 86.39% | 93.76% | 94.46% | 94.00% |
| 80%/20% | 87.59% | 87.59% | 86.97% | 91.97% | 91.66% | 91.34% |
| 70%/30% | 86.04% | 85.45% | 85.71% | 91.00% | 90.01% | 90.35% |
| 60%/40% | 84.16% | 84.54% | 83.98% | 90.78% | 90.19% | 90.38% |
| 50%/50% | 86.89% | 85.71% | 86.08% | 90.54% | 90.14% | 90.20% |
| 40%/60% | 82.36% | 81.47% | 81.68% | 88.04% | 86.67% | 87.23% |
| 30%/70% | 81.55% | 81.33% | 80.85% | 86.25% | 86.00% | 86.01% |
Discussion with Limited Training Data
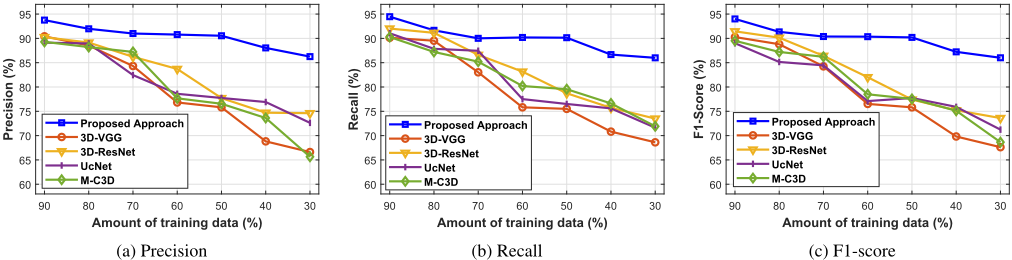
Figure 6 illustrates the performance of several methods with better performance in Table 2 under decreasing training data (gradually reduced from 90% to 30%). DL methods depend heavily on extensive training to enhance feature extraction, necessitating ample training data to capture the discriminative information among different categories. Instead of training a deep network and using it as a classifier, our method focuses on the inherent changing information (i.e., the dynamics) within the data, represents the original data blocks with fitted dynamic-captured models, and accomplishes classification on these models rather than the original data.
CubeRes' comprehensive capture of multi-directional dynamics within the data and efficient optimization given specific data enable effectiveness even with limited training data. Taking the F1-score as an example, even when the amount of training samples dwindles to a mere 30%, that is about 60 data blocks for each type, our method achieves a best F1score over 85%. In such a case, as there is not enough data to improve its feature extraction and recognition capabilities, the effect of the DL method has dropped significantly.
The Effectiveness of Optimization
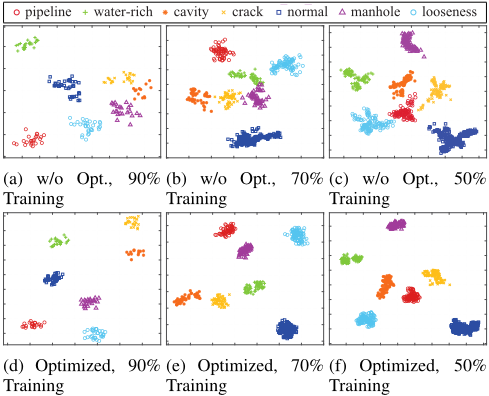
In examining the optimization's impact in our approach, Table 3 reveals that optimization enhances the F1-Score by over 5%. More intuitively, we map the CubeRes readout models to a 2D visualization using t-SNE [Van der Maaten and Hinton, 2008]. As Figure 8, each point represents a readout model, corresponding to a fitted GPR data block. Without optimization (w/o Opt.), while it is possible to differentiate models derived from normal and abnormal data, the distance between different types of anomalies is relatively close, with a lack of distinct clustering within each category. After optimization (Optimized), it is evident that the implemented optimization successfully reduces distances among models of the same category and amplifies differences between disparate ones, resulting in a more "category-discriminative" model distribution, thus allowing for more accurate model classification.
3 The impacts of using other classifiers like SVM and Random Forest are discussed next.
| Classifier | SVM | Random Forest | ||||
|---|---|---|---|---|---|---|
| Pre | Rec | F1 | Pre | Rec | F1 | |
| 90%/10% | 92.53% | 90.78% | 91.35% | 91.43% | 91.75% | 91.56% |
| 70%/30% | 87.52% | 85.95% | 86.46% | 91.18% | 90.55% | 90.82% |
| 50%/50% | 85.24% | 84.26% | 84.37% | 87.62% | 86.62% | 86.96% |
Performance Comparison of Different Classifiers
The performance of SVM and Random Forest (RF) within the CubeRes model space is given in Table 4. In conjunction with Table 2, it is evident that the KNN yields the best results, with RF performing better than SVM. As illustrated in Figure 8, models fitted from the same type of data are highly clustered, resulting in a category-discriminative model distribution, thus the above three methods have achieved considerable results, generally surpassing the other baselines.
5 Conclusion
This paper proposes learning in the Cube Reservoir Network (CubeRes) model space for anomaly detection in 3D GPR data. 1) We introduce a novel CubeRes, with three reservoirs, to comprehensively capture the GPR data's multi-directional dynamics into a compact fitted readout model for data representation; 2) The integration of a parameterized metric between models and the optimization of CubeRes significantly improved the fitting accuracy and category discrimination in the readout mode space, allowing for efficient classification on the models. Owing to the comprehensive capture of the data-inherent dynamics and the efficient optimization, our approach demonstrated notable effectiveness in the real-world GPR dataset, particularly in data-limited scenarios.
Acknowledgments
This work was supported in part by the National Key R&D Program of China (No. 2021ZD0111700), in part by the National Nature Science Foundation of China (No. 62206261, 62137002, 62176245), in part by the Key Science and Technology Special Project of Anhui Province (No. 202103a07020002), and the Special Foundation for Science and Technology Innovation and Entrepreneurship of CCTEG (No. 2020-2-TD-CXY006).
@inproceedings{ijcai2024p626,
  title     = {Learning in CubeRes Model Space for Anomaly Detection in 3D GPR Data},
  author    = {Zhou, Xiren and Liu, Shikang and Chen, Ao and Chen, Huanhuan},
  booktitle = {Proceedings of the Thirty-Third International Joint Conference on
               Artificial Intelligence, {IJCAI-24}},
  publisher = {International Joint Conferences on Artificial Intelligence Organization},
  editor    = {Kate Larson},
  pages     = {5662--5670},
  year      = {2024},
  month     = {8},
  note      = {Main Track},
  doi       = {10.24963/ijcai.2024/626},
  url       = {https://doi.org/10.24963/ijcai.2024/626},
}
TY - CPAPER TI - Learning in CubeRes Model Space for Anomaly Detection in 3D GPR Data AU - Zhou, Xiren AU - Liu, Shikang AU - Chen, Ao AU - Chen, Huanhuan T2 - Proceedings of the Thirty-Third International Joint Conference on Artificial Intelligence, IJCAI-24 PB - International Joint Conferences on Artificial Intelligence Organization PY - 2024 SP - 5662 EP - 5670 DO - 10.24963/ijcai.2024/626 UR - https://doi.org/10.24963/ijcai.2024/626 ER -Copied
Machine-readable versions of this paper, for tools and AI agents:





