
RisQNet: Rescuing SMEs from Financial Shocks with a Novel Networked-Loan Risk Assessment
Proceedings of the Thirty-Third International Joint Conference on Artificial Intelligence. AI for Good. Pages 7385-7393.
https://doi.org/10.24963/ijcai.2024/817
Keywords
- Multidisciplinary Topics and Applications: General
- Data Mining: General
Abstract
In the face of economic downturns, Small and Medium-sized Enterprises (SMEs) within interconnected networked-loans are vulnerable to cascading debt crises, exacerbated by factors like social media-induced financial shocks. Traditional risk assessment models, which mainly rely on financial data, inadequately predict such crises, as evidenced by the collapse of Silicon Valley Bank in 2023. To address this issue, we developed RisQNet, a model that uses temporal graph networks to incorporate diverse risks, including real-time media influences. This approach not only advances risk prediction through news feature extraction and large language models but also enhances risk management strategies with intuitive visualization tools. Validated on a dataset with a total loan volume of USD 3 trillion, RisQNet outperforms the state-of-the-art baseline and achieves 87.1% of AUC. Our collaborative effort with financial regulators and the SME community underpins the model's development, aligning with the UN SDG 8. RisQNet represents a significant step forward in leveraging AI for financial stability, offering a promising approach to combat the propagation of debt crises in financial networks.
- [Achakzai and Juan, 2022] Muhammad Atif Khan Achakzai and Peng Juan. Using machine learning meta-classifiers to detect financial frauds. Finance Research Letters, 48:102915, 2022.
- [Alon and Yahav, 2020] Uri Alon and Eran Yahav. On the bottleneck of graph neural networks and its practical im- plications. arXiv preprint arXiv:2006.05205, 2020.
- [Baesens et al., 2003] Bart Baesens, Tony Van Gestel, Stijn Viaene, Maria Stepanova, Johan Suykens, and Jan Van- thienen. Benchmarking state-of-the-art classification al- gorithms for credit scoring. Journal of the operational re- search society, 54:627-635, 2003.
- [Balashankar et al., 2023] Ananth Balashankar, Lakshmi- narayanan Subramanian, and Samuel P Fraiberger. Pre- dicting food crises using news streams. Science Advances, 9(9):eabm3449, 2023.
- [Bougheas and Kirman, 2015] Spiros Bougheas and Alan Kirman. Complex financial networks and systemic risk: A review. Springer, 2015.
- [Bruna et al., 2014] Joan Bruna, Wojciech Zaremba, Arthur Szlam, and Yann LeCun. Spectral networks and locally connected networks on graphs. In 2nd International Con- ference on Learning Representations, 2014.
- [Chen and Guestrin, 2016] Tianqi Chen and Carlos Guestrin. Xgboost: A scalable tree boosting system. In Proceedings of the 22nd acm sigkdd international conference on knowl- edge discovery and data mining, pages 785-794, 2016.
- [Cheng et al., 2019] Dawei Cheng, Yi Tu, Zhen-Wei Ma, Zhibin Niu, and Liqing Zhang. Risk assessment for networked-guarantee loans using high-order graph atten- tion representation. In IJCAI, pages 5822-5828, 2019. IJCAI
- [Cheng et al., 2020] Dawei Cheng, Zhibin Niu, and Yiyi Zhang. Contagious chain risk rating for networked- guarantee loans. In Proceedings of the 26th ACM SIGKDD International Conference on Knowledge Discovery & Data Mining, pages 2715-2723, 2020.
- [Cheng et al., 2023] Dawei Cheng, Zhibin Niu, Jianfu Zhang, Yiyi Zhang, and Changjun Jiang. Critical firms prediction for stemming contagion risk in networked-loans through graph-based deep reinforcement learning. In Pro- ceedings of the AAAI Conference on Artificial Intelligence, volume 37, pages 14205-14213, 2023.
- [Columba et al., 2010] Francesco Columba, Leonardo Gam- bacorta, and Paolo Emilio Mistrulli. Mutual guarantee in- stitutions and small business finance. Journal of Financial stability, 6(1):45-54, 2010.
- [Elliott et al., 2014] Matthew Elliott, Benjamin Golub, and Matthew O Jackson. Financial networks and contagion. American Economic Review, 104(10):3115-3153, 2014.
- [Grover and Leskovec, 2016] Aditya Grover and Jure Leskovec. node2vec: Scalable feature learning for networks. In Proceedings of the 22nd ACM SIGKDD international conference on Knowledge discovery and data mining, pages 855-864, 2016.
- [Hamilton et al., 2017] Will Hamilton, Zhitao Ying, and Jure Leskovec. Inductive representation learning on large graphs. Advances in neural information processing sys- tems, 30, 2017.
- [Haron et al., 2013] Hasnah Haron, Saniza Binti Said, K Ja- yaraman, and Ishak Ismail. Factors influencing small medium enterprises (smes) in obtaining loan. Interna- tional Journal of Business and Social Science, 4(15), 2013.
- [Jian and Xu, 2012] Ming Jian and Ming Xu. Determinants of the guarantee circles: The case of chinese listed firms. Pacific-Basin Finance Journal, 20(1):78-100, 2012.
- [Ke et al., 2017] Guolin Ke, Qi Meng, Thomas Finley, Taifeng Wang, Wei Chen, Weidong Ma, Qiwei Ye, and Tie-Yan Liu. Lightgbm: A highly efficient gradient boost- ing decision tree. Advances in neural information process- ing systems, 30, 2017.
- [Keskġn et al., 2010] Hidayet Keskġn, Canan Ġentürk, Onur Sungur, and Hakan M Kġrġġ. The importance of smes in developing economies. In 2nd international symposium on sustainable development, volume 183, 2010.
- [Kipf and Welling, 2016] Thomas N Kipf and Max Welling. Semi-supervised classification with graph convolutional networks. In International Conference on Learning Rep- resentations, 2016.
- [Li et al., 2020] Zhao Li, Xin Shen, Yuhang Jiao, Xuming Pan, Pengcheng Zou, Xianling Meng, Chengwei Yao, and Jiajun Bu. Hierarchical bipartite graph neural networks: Towards large-scale e-commerce applications. In 2020 IEEE 36th International Conference on Data Engineering (ICDE), pages 1677-1688. IEEE, 2020.
- [Liu et al., 2023] Yong Liu, Tengge Hu, Haoran Zhang, Haixu Wu, Shiyu Wang, Lintao Ma, and Mingsheng Long. itransformer: Inverted transformers are effective for time series forecasting, 2023.
- [Luo et al., 2022] Ruikang Luo, Yaofeng Song, Liping Huang, Yicheng Zhang, and Rong Su. Stgin: A spatial temporal graph-informer network for long sequence traf- fic speed forecasting. arXiv preprint arXiv:2210.01799, 2022.
- [Martínez-Jaramillo et al., 2010] Serafín Martínez- Jaramillo, Omar Pérez Pérez, Fernando Avila Embriz, and Fabrizio López Gallo Dey. Systemic risk, financial contagion and financial fragility. Journal of Economic Dynamics and Control, 34(11):2358-2374, 2010.
- [Nicolicioiu et al., 2019] Andrei Nicolicioiu, Iulia Duta, and Marius Leordeanu. Recurrent space-time graph neural net- works. Advances in neural information processing sys- tems, 32, 2019.
- [Nie et al., 2023] Yuqi Nie, Nam H. Nguyen, Phanwadee Sinthong, and Jayant Kalagnanam. A time series is worth 64 words: Long-term forecasting with transformers. In International Conference on Learning Representations, 2023.
- [Niepert et al., 2016] Mathias Niepert, Mohamed Ahmed, and Konstantin Kutzkov. Learning convolutional neural networks for graphs. In International conference on ma- chine learning, pages 2014-2023. PMLR, 2016.
- [Niu et al., 2018] Zhibin Niu, Dawei Cheng, Liqing Zhang, and Jiawan Zhang. Visual analytics for networked- guarantee loans risk management. In 2018 IEEE Pa- cific Visualization Symposium (PacificVis), pages 160- 169. IEEE, 2018.
- [Niu et al., 2020] Zhibin Niu, Runlin Li, Junqi Wu, Dawei Cheng, and Jiawan Zhang. iconviz: Interactive visual exploration of the default contagion risk of networked- guarantee loans. In 2020 IEEE conference on visual ana- lytics science and technology (VAST), pages 84-94. IEEE, 2020.
- [Niu et al., 2021] Zhibin Niu, Junqi Wu, Dawei Cheng, and Jiawan Zhang. Regshock: Interactive visual analytics of systemic risk in financial networks. arXiv preprint arXiv:2104.11863, 2021.
- [Pareja et al., 2020] Aldo Pareja, Giacomo Domeniconi, Jie Chen, Tengfei Ma, Toyotaro Suzumura, Hiroki Kaneza- shi, Tim Kaler, Tao Schardl, and Charles Leiserson. Evolvegcn: Evolving graph convolutional networks for dynamic graphs. In Proceedings of the AAAI conference on artificial intelligence, volume 34, pages 5363-5370, 2020.
- [Scarselli et al., 2008] Franco Scarselli, Marco Gori, Ah Chung Tsoi, Markus Hagenbuchner, and Gabriele Monfardini. The graph neural network model. IEEE transactions on neural networks, 20(1):61-80, 2008.
- [Somin et al., 2020] Shahar Somin, Yaniv Altshuler, Goren Gordon, Alex'Sandy' Pentland, and Erez Shmueli. Net- work dynamics of a financial ecosystem. Scientific reports, 10(1):4587, 2020.
- [Summer, 2013] Martin Summer. Financial contagion and network analysis. Annu. Rev. Financ. Econ., 5(1):277- 297, 2013.
- [Thomas et al., 2017] Lyn Thomas, Jonathan Crook, and David Edelman. Credit scoring and its applications. SIAM, 2017.
- [Van Gestel and Baesens, 2009] Tony Van Gestel and Bart Baesens. Credit Risk Management: Basic concepts: Fi- nancial risk components, Rating analysis, models, eco- nomic and regulatory capital. Oxford University Press, 2009.
- [Velickovic et al., 2017] Petar Velickovic, Guillem Cucu- rull, Arantxa Casanova, Adriana Romero, Pietro Lio, Yoshua Bengio, et al. Graph attention networks. stat, 1050(20):10-48550, 2017.
- [Wang et al., 2020] Yingli Wang, Qingpeng Zhang, and Xi- aoguang Yang. Evolution of the chinese guarantee network under financial crisis and stimulus program. Nature Com- munications, 11(1):2693, 2020.
- [Yang et al., 2020] Shuo Yang, Zhiqiang Zhang, Jun Zhou, Yang Wang, Wang Sun, Xingyu Zhong, Yanming Fang, Quan Yu, and Yuan Qi. Financial risk analysis for smes with graph-based supply chain mining. In Christian Bessiere, editor, Proceedings of the Twenty-Ninth Interna- tional Joint Conference on Artificial Intelligence, IJCAI- 20, pages 4661-4667. International Joint Conferences on Artificial Intelligence Organization, 7 2020. Special Track on AI in FinTech. IJCAI
- [Ying et al., 2020] Xiaoting Ying, Cong Xu, Jianliang Gao, Jianxin Wang, and Zhao Li. Time-aware graph relational attention network for stock recommendation. In Proceed- ings of the 29th ACM International Conference on In- formation & Knowledge Management, pages 2281-2284, 2020.
- [Zhang et al., 2023] Peiyan Zhang, Yuchen Yan, Chaozhuo Li, Senzhang Wang, Xing Xie, and Sunghun Kim. Can transformer and gnn help each other? arXiv preprint arXiv:2308.14355, 2023.
- [Zhou et al., 2021] Haoyi Zhou, Shanghang Zhang, Jieqi Peng, Shuai Zhang, Jianxin Li, Hui Xiong, and Wan- cai Zhang. Informer: Beyond efficient transformer for long sequence time-series forecasting. In Proceedings of the AAAI conference on artificial intelligence, volume 35, pages 11106-11115, 2021.
References were extracted automatically from the PDF and may contain errors.
Full text extracted automatically from the PDF; figures, tables and equations may differ. The PDF is the version of record.
1 Introduction
Small and Medium-sized Enterprises (SMEs) are crucial to the global economy, representing 90% of businesses and contributing to more than half of global employment and GDP, as per United Nations data. Access to finance is vital for SME growth, yet challenges like limited credit histories often lead them to secure loans through mutual guarantees, forming complex networked-loans. While these networks distribute financial risk, they also pose a threat of collective defaults during economic downturns. A single default can trigger a cascade, potentially destabilizing the entire financial system, as Figure 1 illustrated by the propagation of defaults in a real networked-loan. This scenario highlights the urgent need for effective regulatory strategies to identify and mitigate such systemic risks.
∗Corresponding author, zniu@tju.edu.cn
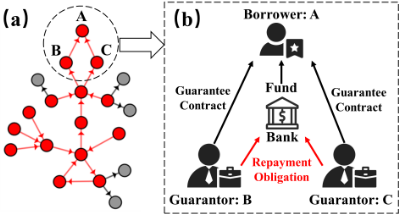
The assessment and management of financial risk has a long history of development. Previous work on financial risk modeling used statistical and regression methods as early as the 1950s [Baesens et al., 2003]. However, the global financial crisis has led to the realization that classical econometric models are limited in their ability to understand financial markets under extreme conditions, in part because they ignore the complex interactions within the system [Somin et al., 2020]. In contrast, new perspectives on financial risk assessment are offered by machine learning and deep learning techniques with their ability to capture and analyze complex data patterns. [Achakzai and Juan, 2022] employed convolutional and recurrent neural networks for the detection of financial fraud. Similarly, [Cheng et al., 2023] integrated deep reinforcement learning with high-order graph message-passing networks to identify key firms and reduce contagion risk in the banking industry. Furthermore, [Yang et al., 2020] developed a spatial-temporal graph neural network approach to extract supply chain relationships in SMEs and assess credit risks. However, the landscape of financial stability and risk management still faces critical challenges:
- Tackling the influence of social media on financial stability: The challenge in today's digital era is the unprece-
dented influence of social media on financial markets. A notable example from 2023 is how negative sentiment across social platforms played a critical role in the crisis of Silicon Valley Bank. The core of this challenge is developing methods to sift through and accurately interpret the vast and often noisy data on social media.
- Addressing cascading risk in networked-loans: The interconnected nature of networked-loans implies that defaults by key entities can trigger widespread cascading risk. They have the potential to not only cause rapid collapse within the network but also provoke a systemic financial crisis. Despite this, current risk management strategies are primarily designed for isolated events, overlooking the cumulative effect on the overall health of the financial system.
- Capturing multivariate correlations in financial analysis: Traditional neural network models, such as Long ShortTerm Memory (LSTM) and Gated Recurrent Unit (GRU), are limited in their ability to capture the complex correlations among multiple financial variables. This limitation poses a significant challenge in accurately predicting financial outcomes and assessing risk.
To address these challenges, this paper introduces a novel risk assessment framework, RisQNet. This framework analyzes social media content by categorizing it into two distinct types: public news and research reports. For public news, which is abundant but often contains a significant amount of noise, we apply a news stream extraction method [Balashankar et al., 2023] to identify risk features. In contrast, for the high-quality but scarcer research reports, we leverage advanced large language models for financial ratings. Further, RisQNet quantifies the cascading risk level by utilizing a risk matrix, which is widely acknowledged in the financial sector for assessing the systemic health of networks. Additionally, the framework incorporates a modified version of the Transformer model, the iTransformer [Liu et al., 2023], which regards independent time series as variate tokens through a transpose strategy. This allows for the capturing of multivariate correlations in financial data through the attention mechanism, providing a more nuanced understanding of financial risk. Our contributions can be summarized as:
- We have pioneered the integration of news features extraction with large language model for financial network behavior forecasting. This innovative approach underscores the pivotal role of social media in finance and sets a new standard for subsequent research and applications.
- We have developed RisQNet, a state-of-the-art (SOTA) framework that merges multisource risk information with detailed node characteristics, advancing beyond traditional risk assessment by addressing the complexities of digital media. This greatly enhances the accuracy and comprehensiveness of financial risk evaluations.
- We have rigorously evaluated RisQNet on a unique realworld financial network dataset, proving its practical utility and significant social impact. Such approach can strengthen the financial stability of SMEs, promotes economic growth, and aligns with sustainable development goals, underscoring our commitment to fostering a resilient and inclusive financial ecosystem.
2 RelatedWorks
2.1 Graph Neural Network
Graph Neural Network was introduced in [Scarselli et al., 2008]. Subsequently, a spectral-based GNN presented in [Bruna et al., 2014], formulating a convolutional operator in the spectral domain based on spectral graph theory. Later, GCN [Kipf and Welling, 2016] was raised up to simplify the convolutional operator. However, most spectral-based GNNs were highly dependent on graph structure. To overcome this, spatial-based GNNs defined convolutional operator on the graph directly [Niepert et al., 2016; Hamilton et al., 2017]. Another approach for GNN was based on the attention mechanism. The graph attention network (GAT) [Velickovic et al., 2017] used the attention mechanism in the propagation step. To capture both temporal and spatial information, [Nicolicioiu et al., 2019] incorporated temporal consideration into GNN. GNNs have been used in finance widely, such as stock market analysis [Ying et al., 2020] and loan default prediction [Cheng et al., 2019]. [Li et al., 2020] stacked multiple GNN modules to learn hierarchical representations, serving for e-commerce. However, none of them took into account media influence or incorporated a large language model into their framework. Recently, TransGNN [Zhang et al., 2023] was presented to expand the receptive field and improve GNN's performance by combining the GNN layer and the Transformer layer alternately. STGIN [Luo et al., 2022] merged Informer and GAT layers for spatial-temporal relationships. Our approach extracts structural information through GAT and processes time series based on iTransformer.
2.2 Networked-loan
Networked-loan is a special economic phenomenon. Traditionally, banks tend to favor large corporations for loans due to their substantial fixed assets as collateral. However, the financing needs of SMEs are equally important, as they have implications for societal employment rates and economic vitality [Kesk˙gn et al., 2010]. To meet the requirements of bank loan evaluation standards, SMEs are allowed to seek guarantors to endorse their loan applications [Haron et al., 2013; Columba et al., 2010]. As more enterprises join, a complex network is formed among these enterprises, guarantors, and borrowers [Wang et al., 2020; Jian and Xu, 2012]. This mode poses new risk management challenges for regulatory authorities and banks. When a company within the network experiences a debt crisis, individual defaults will propagate throughout the network along the guarantee relationship [Bougheas and Kirman, 2015; Cheng et al., 2020]. Especially during recessions, accidental defaults spread like wildfire, even triggering a systemic financial crisis [Mart´ınez-Jaramillo et al., 2010; Summer, 2013]. The intuitive visualization tools provide insights into the complex interconnections of networked-loans and the contagion pattern of defaults [Niu et al., 2018; Niu et al., 2020]. However, if the regulatory authority can effectively predict potential default nodes before a large-scale contagion occurs and implement appropriate regulatory measures, they can effectively avert a massive systemic default.
3 Methods
We first clarify the notation and definitions in Network-loans, then delve into the architecture of RisQNet and the details of the fusion of multidimensional risk information in financial risk prediction.
3.1 Definitions and Architecture Overview
Definition 1. Guarantee Contract. A guarantee relationship is formed when one company agrees to guarantee a loan for another company. This contract includes three key elements: 1) amount, the value of the loan; 2) start time, the effective date of the contract; 3) end time, the expiration date of the contract.
Definition 2. Networked-loan. Given a set of loan guarantee relationship datasets, it can be represented as an ordered set of T graph snapshots:
where each node vi ∈ V , V = {v1, v2, . . . , v|V |} denotes SMEs. The edge ei,j ∈ Et represents the guarantee contract from node vi to vj, and |ei,j| represents the guarantee amount. Xt = {Xt1 ,Xt2 , ...,X t |V |} , Xt i ∈ RFv denotes the original node feature matrix, including both basic SME profiles (enterprise size, registered capital, number of employees, etc.) and credit behaviors (credit period, credit amount, default history, etc.).
Definition 3. Loan Default. When a lender defaults, a record detailing the time of default is generated. Nodes are tagged with a default attribute where y = 1 denotes default at time t, and y = 0 indicates no default.
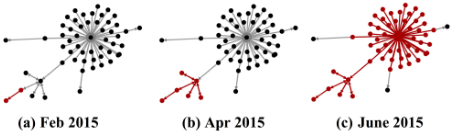
Figure 2 illustrates the evolution of a real-world temporal networked-loan. Our objective is to forecast impending defaults at the subsequent time point, based on the known state of the network.
We now formalize our default prediction problem as follows: Using a series of financial network snapshots marked with default risks {Gt}Tt=1 , we forecast the nodes default probability at a subsequent time point.
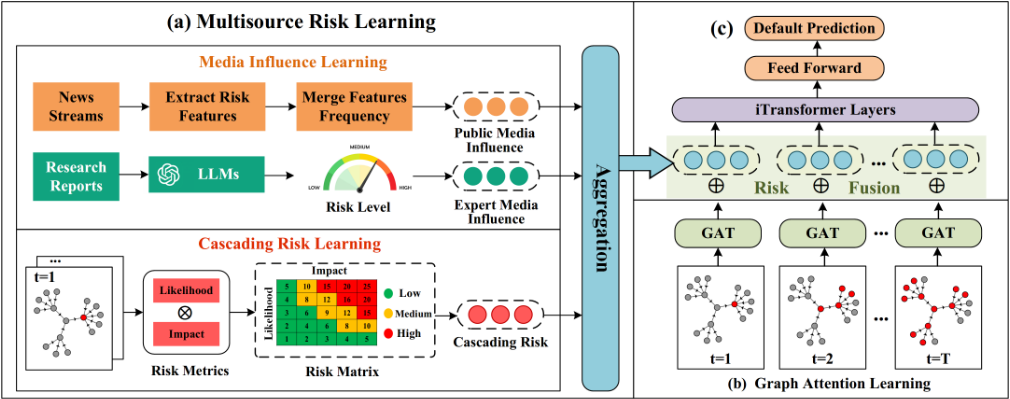
Figure 3 shows RisQNet. This framework comprises three primary components: (a) Multisource Risk Learning Module considers both media influence and cascading risk. (b) Graph Attention Learning Module extracts features from networkedloans. (c) Default Prediction Module aggregates the above information, ensuring that our predictions are affected by both the intrinsic characteristics of the nodes and dynamic risk shocks that evolve over time.
3.2 Media Influence Learning
Financial trends are influenced by media information, we employ varied learning strategies tailored to the characteristics of multisource data, facilitating a comprehensive evaluation of media influence.
To analyze massive public news, we employed semantic role labeling, a well-established and effective technique in social science research [Balashankar et al., 2023]. Initially, we selected the 12 most frequently occurring negative words in financial news (default, bankruptcy, decline, etc.) as seed words. Then, we utilized a semantic analyzer framework, to extract risk features causally related to these seeds.
For instance, in the news item, "Small and medium-sized processing firms are facing bankruptcy massively due to declining sales and rising rents", the semantic analyzer extracted "declining sales" and "rising rents" as the risk features causally linked to seed "bankruptcy". We applied this methodology to the entire news stream, ultimately identifying 126 high-frequency risk features that consistently appear each quarter. In addition, to capture financial terminology, we applied the same approach to 24 academic finance articles, resulting in the identification of 27 additional risk features. In total, 153 different risk features were identified. Subsequently, we partition the news set by month, compute proportion P tw of news mentioning risk features w ∈ {1, ..., 153} during month t, and merge features frequency to obtain the monthly public media influence vector Rp:
However, authoritative research reports published by enterprises and financial institutions, filled with complex data and specialized terminology, require strong comprehension skills to understand. Traditional semantic statistical methods often fail in this area. Therefore, we utilize GPT-4's capabilities in logical reasoning and professional common sense to assess the impact of these reports on the financial environment of SMEs. The prompt flow we used is shown in the Figure 4.
The Large Language Model (LLM) simulates various financial experts to provide a comprehensive evaluation of the report's impact on SMEs, following the gradient of risk outlined by the Standard & Poor's (S&P) Short-Term Issuer Credit Rating Criteria, which progresses from low to high risk levels: A-1 (lowest risk), A-2, A-3, B, C, to D (highest risk). This model incorporates a self-optimization prompting, wherein the LLM provides feedback to its generated candidates, ensuring comprehensive and robust evaluations. Subsequently, we partition the rating outcomes by month and compute the frequency P t l of each rating level l ∈ {1, ..., 6} during month t. These frequencies are aggregated to construct monthly expert media influence vector Re:

3.3 Cascading Risk Learning
The analysis of default records reveals that defaults within networked-loans often exhibit explosive behavior. As shown in Figure 2, a pronounced peak in defaults is observed in June 2015. This volatility stems from cascading failures triggered by the default of critical network nodes, leading to the swift collapse of the network [Elliott et al., 2014]. Existing GNNs, limited by their receptive fields, struggle to capture the health index of the entire network [Alon and Yahav, 2020], hence we incorporated a cascading risk learning module.
To quantify the network's cascading risk, we adopted a risk matrix commonly utilized in financial assessments. We employed two key metrics: the node default rate L(Likelihood) and the default amount ratio I(Impact). These metrics are computed as follows:
L and I can be segmented into five distinct categories (Pass (0%), Special Mention (0-5%), Substandard (5- 15%), Doubtful (15-50%) and Loss (more than 50%)) based on standard credit assessment thresholds [Van Gestel and Baesens, 2009].
Figure 3 demonstrates how the risk matrix cells are divided into three risk levels: low, medium, and high. By correlating the Lt and I t categories, one can pinpoint a specific cell in the risk matrix to ascertain the network's risk level label Kt . Combining metrics generates the network's cascading risk vector Rc:
3.4 Graph Attention Learning
We utilize a graph attention module to capture the structural information and behavioral characteristics of each node. This process creates a spatial representation for each node and ultimately integrates this information with risk learning. For each given node, we need to update its attention weights for its incoming nodes. We compute hti,j as follows: hti,j = φ [Wϕ1Xt i ∥ Wϕ1Xt j ], j ∈ N t i . Here, N t i is Vi neighborhood at t time, Wϕ1 ∈ RF ′×Fv is the weighted matrix of node features, and φ [·] → R is the shared attention mapping mechanism. We normalize hti,j using the Softmax function:
After normalizing the attention coefficient, we use it to calculate the weighted summary of the node's potential embedding. To capture diverse combinations of attention and graph structure features, we utilize a multi-head attention mechanism which enhances model flexibility by employing K independent attention mechanisms for summarizing features:
3.5 Default Prediction
Incorporating graph embeddings with risk quantification vectors, we construct joint risk time series to predict defaults. We utilize the advanced iTransformer [Liu et al., 2023] model. By using a transpose strategy, we transform temporal tokens into variable tokens, enable the attention mechanism to better understand correlations between variables, producing a comprehensive risk representation for each node over period T, denoted as Hi:
As mentioned above, we formalize the SMEs default prediction task into a classification problem for nodes, and for a given labeled point set Dgt = {v, y}, we employ a crossentropy loss based on the final embedding Hi as follows:
Where pred (Hi : θ) is the prediction function that sets Hi to a real-valued score and we use two layers of MLP and a layer of Sigmoid to realize the pred function.
4 Experiments
4.1 Experimental Settings
Datasets
Our dataset from a major East Asian commercial bank spans SME loans from January 2010 to December 2016. It includes around 480,000 SMEs with 760,000 guarantee contracts with a total loan volume of about USD 3 trillion. Besides detailed information on borrowers and guarantors, it contains data on loan amounts, maturity dates, and basic firm-level information like assets, liabilities, and registered capital. Our analysis of the dataset reveals that the majority of loans adhere to a monthly repayment schedule. This finding has led us to concentrate on monthly behavioral patterns to enhance our comprehension of financial trends. Furthermore, we have established monthly ground-truth labels to facilitate a comprehensive evaluation of our methods.
Additionally, we meticulously gathered external media information, comprising 226,146 public financial news and 5,783 professional financial research reports, from Sina Weibo (https://weibo.com/) and the Wind database. The collection, aligned with the time period of the networked-loan dataset, underwent thorough cleansing. The processed media data provided critical insights into the macro business environment and the prevailing financial default risks.
During our experiments, we used data spanning 2010 to 2013 for the training set, and employed 2014 to 2016 data for the test set. The intervals of T were set to one month, mirroring the typical monthly repayment schedule of most loan systems.
Baselines
To substantiate the efficacy of RisQNet on the networkedloans, we consider three categories of methods as baselines:
- Standard Financial Methods: Scorecard, the most popular loan rating approach in commercial banking [Thomas et al., 2017]. GBDT, a decision tree-based gradient boosting method, processes mixed-type data [Ke et al., 2017]. XGBoost is a more efficient and flexible one and is widely used in quantitative finance [Chen and Guestrin, 2016].
- Graph-based Methods: Node2vec, an algorithm for learning node representations in a network through biased random walks [Grover and Leskovec, 2016]. GCN is a graph neural network that uses convolutional processes on graph data to capture relationships [Kipf and Welling, 2016]. GAT, a neural network for graph data, uses attention layers to focus on important parts of the graph [Velickovic et al., 2017].
- Temporal Graph Neural Networks: EvolveGCN, a dynamic GNN using RNN to evolve the GCN parameters [Pareja et al., 2020]. Informer [Zhou et al., 2021] & PatchTST [Nie et al., 2023] are efficient time series forecasting models, with GAT capturing graph structure.
To assess the impact of individual components within our framework, we conducted five ablation studies. Each study involved removing a specific component to understand its contribution to the overall effectiveness. The configurations tested were: GAT-iTransformer, which operates without the multisource risk learning module; RisQNet-noMedia, complete removal of the media influence learning module; RisQNet-noPublic, deletion of the public news learning module; RisQNet-noExpert, excluding the professional research reports learning module; and RisQNet-noCascade, without the cascading risk learning module. These experiments were designed to isolate and evaluate the significance of each component in enhancing our framework's performance.
All models were trained end-to-end using the Adam optimizer, we set the learning rate to 0.001, and the batch size to 200. The effectiveness of our methodology was evaluated using classification metrics, including the AUC (Area Under the ROC Curve), F-Score, and Kolmogorov-Smirnov (KS) score.
4.2 Result
Table 1 presents the values of AUC, F-Score, and KS. It is observed that GBDT surpasses the conventional logistic regression model, Scorecard, indicating that corporate default prediction necessitates the consideration of complex interactions and nonlinear relationships. Furthermore, Node2vec outperforms the most powerful decision tree model, XGBoost, highlighting the significance of graph network structural information in forecasting within financial networks. The outstanding performance of GCN illustrates the efficacy of graph neural networks in graph feature learning, with GAT providing superior results due to the advantages of the attention mechanism. The efficacy of EvolveGCN, as a dynamic graph neural network, underscores the critical importance of temporal dynamics in this domain.
| Model | AUC | F-Score | KS |
|---|---|---|---|
| Scorecard | 0.677 | 0.552 | 0.271 |
| GBDT | 0.713 | 0.604 | 0.337 |
| XGBoost | 0.718 | 0.613 | 0.342 |
| Node2vec | 0.726 | 0.625 | 0.368 |
| GCN | 0.741 | 0.637 | 0.374 |
| GAT | 0.751 | 0.656 | 0.395 |
| EvolveGCN | 0.783 | 0.677 | 0.458 |
| GAT-Informer | 0.814 | 0.692 | 0.517 |
| GAT-PatchTST | 0.820 | 0.715 | 0.533 |
| GAT-iTransformer | 0.823 | 0.719 | 0.540 |
| RisQNet-noMedia | 0.838 | 0.730 | 0.562 |
| RisQNet-noPublic | 0.847 | 0.736 | 0.572 |
| RisQNet-noExpert | 0.853 | 0.741 | 0.579 |
| RisQNet-noCascade | 0.855 | 0.749 | 0.596 |
| RisQNet | 0.871* | 0.768* | 0.621* |
Consequently, GAT was chosen as the primary graph neural network, augmented by a time series prediction model, leading to significant improvements. Among the transformerbased models evaluated, iTransformer was selected for its superior ability to capture multivariate correlations, outperforming both Informer and PatchTST. The ablation study confirmed the utility of incorporating public news, research reports, and cascading risk learning modules, underlining the value of external information and cascading risk assessment. The final model, RisQNet, which integrates all financial risk quantification modules, achieved the highest performance across all metrics.
4.3 Risk LearningModules Analysis
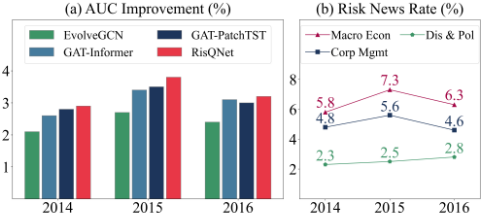
To further affirm the robustness and broad applicability of our risk quantization modules, we incorporated the media influence learning module into various Temporal Graph Neural Networks used as baselines. Figure 5a illustrates the significant annual performance enhancements of these networks following the integration of media influence vector (Rp ⊕Re). Remarkably, all models demonstrated their maximum improvement in 2015.
To explain this phenomenon, we manually categorized news containing risk features from the test year and displayed their proportion compared to the total annual news in Figure 5b. The data from 2015 indicated an increased presence of news containing risk features related to macroeconomics and corporate management. Further analysis linked this rise to the mid-2015 stock market crash in mainland China, leading to diminished confidence in the financial sector and subsequent effects on the real economy, resulting in several debt defaults. This illustrates the media influence learning module's ability to detect market anxiety through public media and foresee potential financial disturbances.
In contrast, we applied the same test to the cascading risk learning module. Figure 6a illustrates the improvement in baseline performance following the integration of cascading risk vectors (Rc), notably a substantial increase in 2014. To understand this phenomenon, we analyzed the systemic risk levels within the test set. Figure 6b illustrates the annual distribution of systemic risk levels, revealing a notably higher proportion of networks classified at medium and high risk levels in 2014. This elevated proportion is attributed to the collective defaults in the bond market that occurred in 2014. These findings demonstrate that the cascading risk learning module effectively identifies cascade failures and accurately evaluates systemic risks.
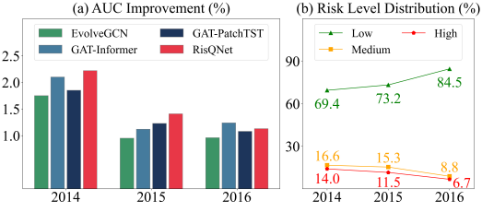
In summary, our experiment substantiated the efficacy of the multisource risk learning module. RisQNet significantly enhances the accuracy of default prediction within networked-loan by integrating network structure, media environment, and financial expertise.
5 Case Study
We have developed an interactive system for the dynamic presentation of RisQNet predictions, by adopting a "risk island" layout that clusters entities according to business situation without disrupting the network's topological structure [Niu et al., 2021]. The system substantially enhances the efficiency of detecting and analyzing risk patterns, outperforming traditional force-directed graphs. We demonstrate the system's effectiveness with a real-world networked-loan case, featuring a network of 123 companies, 187 guarantee contracts, and $2.3 billion in loans. In our system, the financial status of entities within a network is color-coded: dark red nodes have defaulted, while white nodes represent solvent entities.
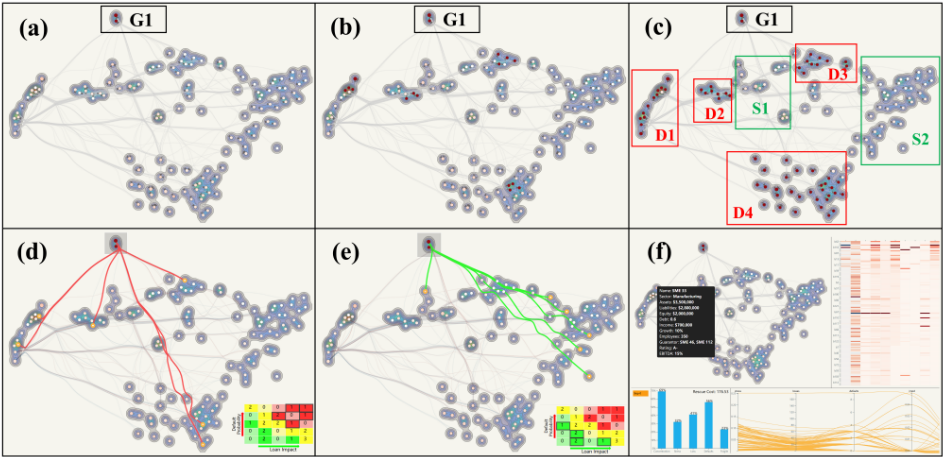
Figure 7a illustrates the network's earliest default state, indicating that only two firms, denoted as G1, have defaulted. As time progresses, the risk of default propagates along the network's guarantee chains, with Figure 7b displaying early signs of widespread default. This progression culminates in Figure 7c, where the default has extended across the network, with 62 firms defaulting, which accounts for 71% of the total loans. The network's nodes can ultimately be divided into four default clusters (D1 to D4) and two secure clusters (S1 and S2). Our analytical objective is to pinpoint the inception points of these default clusters, enabling preemptive interventions to curb the escalation of defaults.
We utilize the RisQNet to predict the default probability for each node in Figure 7a at the subsequent moment. Considering the different impacts of defaults on loans of varying sizes, we use a financial risk matrix with two axes for a comprehensive assessment of the risk severity of each node: the vertical axis is the node default probability, and the horizontal axis represents the loan size involved with the node. In this study, we focus on default group G1, limiting our risk matrix analysis to 25 nodes that provide direct guarantees to firms within G1. The analysis reveals that 6 of these nodes fall into the high-risk (red) region, 13 into the medium-risk (yellow) region, and 6 into the low-risk (green) region. Notably, our detailed examination of the nodes in the red region, as shown in Figure 7d, indicates that all high-risk nodes cluster in the final default clusters (D1-D4). Conversely, Figure 7e displays the low-risk nodes in the green region, all situated in secure clusters (S1-S2). The correlation between our predictions and the nodes' final states significantly substantiates the efficacy of our model. As depicted in Figure 7f, our comprehensive system provides an interactive visualization of risk patterns. This functionality enables users to access vital information on network entities, cluster risks, and the financial consequences of isolating nodes. Financial experts who have assessed our system provide positive feedback, underscoring its swift integration into financial practices and its critical role in promoting financial sustainability.
6 Conclusion
In our study, we introduced RisQNet, a novel framework that revolutionizes financial risk assessments by integrating graph neural networks with advanced risk quantification methods. This approach not only advances AI's role in financial analysis but also supports the UN SDGs. Through rigorous scientific validation, RisQNet has proven to significantly enhance loan default predictions, supporting the stability and growth of globally SMEs and demonstrating AI's potential to impact social and economic structures positively.
Furthermore, the development of RisQNet benefited from collaboration with financial experts, policymakers, and nonprofit organizations, emphasizing its adaptability across various financial scenarios. We are actively working to expand the scope of collaboration and enhance the functionality of RisQNet, aiming to deploy it in critical sectors including supply chain finance and banking risk management. This research is anticipated to notably enhance regional financial stability and aid in the global economic recovery.
@inproceedings{ijcai2024p817,
  title     = {RisQNet: Rescuing SMEs from Financial Shocks with a Novel Networked-Loan Risk Assessment},
  author    = {Lu, Zhaoyuan and Li, Taijun and Zhang, Jingzhen and Liu, Moyang and Li, Xiang and Cui, Linyi and Chen, Junqi and Niu, Zhibin},
  booktitle = {Proceedings of the Thirty-Third International Joint Conference on
               Artificial Intelligence, {IJCAI-24}},
  publisher = {International Joint Conferences on Artificial Intelligence Organization},
  editor    = {Kate Larson},
  pages     = {7385--7393},
  year      = {2024},
  month     = {8},
  note      = {AI for Good},
  doi       = {10.24963/ijcai.2024/817},
  url       = {https://doi.org/10.24963/ijcai.2024/817},
}
TY - CPAPER TI - RisQNet: Rescuing SMEs from Financial Shocks with a Novel Networked-Loan Risk Assessment AU - Lu, Zhaoyuan AU - Li, Taijun AU - Zhang, Jingzhen AU - Liu, Moyang AU - Li, Xiang AU - Cui, Linyi AU - Chen, Junqi AU - Niu, Zhibin T2 - Proceedings of the Thirty-Third International Joint Conference on Artificial Intelligence, IJCAI-24 PB - International Joint Conferences on Artificial Intelligence Organization PY - 2024 SP - 7385 EP - 7393 DO - 10.24963/ijcai.2024/817 UR - https://doi.org/10.24963/ijcai.2024/817 ER -Copied
Machine-readable versions of this paper, for tools and AI agents:





