
Financial Risk Analysis for SMEs with Graph-based Supply Chain Mining
Proceedings of the Twenty-Ninth International Joint Conference on Artificial Intelligence. Special Track on AI in FinTech. Pages 4661-4667.
https://doi.org/10.24963/ijcai.2020/643
Keywords
- AI for risk and security: AI for financial risk factors and prediction
- AI for banking: AI for credit loan
- AI for lending: General
Abstract
Small and Medium-sized Enterprises (SMEs) are playing a vital role in the modern economy. Recent years, financial risk analysis for SMEs attracts lots of attentions from financial institutions.
However, the financial risk analysis for SMEs usually suffers data deficiency problem, especially for the mobile financial institutions which seldom collect credit-related data directly from SMEs.
Fortunately, although credit-related information of SMEs is hard to be acquired sufficiently, the interactive relationships between SMEs, which may contain valuable information of financial risk, is usually available for the mobile financial institutions.
Finding out credit-related relationship of SME from massive interactions helps comprehensively model the SMEs thus improve the performance of financial risk analysis.
In this paper, tackling the data deficiency problem of financial risk analysis for SMEs, we propose an innovative financial risk analysis framework with graph-based supply chain mining.
Specifically, to capture the credit-related topology structural and temporal variation information of SMEs, we design and employ a novel spatial-temporal aware graph neural network, to mine supply chain relationship on a SME graph, and then analysis the credit risk based on the mined supply chain graph.
Experimental results on real-world financial datasets prove the effectiveness of our proposal for financial risk analysis for SMEs.
- [Beck et al., 2011] Thorsten Beck, Asli Demirgüc ¸-Kunt, and María Soledad Martínez Pería. Bank financing for smes: Evidence across countries and bank ownership types. Journal of Financial Services Research, 39(1-2):35-54, 2011.
- [Berger and Frame, 2007] Allen N Berger and W Scott Frame. Small business credit scoring and credit availabil- ity. Journal of small business management, 45(1):5-22, 2007.
- [Bruna et al., 2013] Joan Bruna, Wojciech Zaremba, Arthur Szlam, and Yann LeCun. Spectral networks and lo- cally connected networks on graphs. arXiv preprint arXiv:1312.6203, 2013.
- [Friedman, 2001] Jerome H Friedman. Greedy function ap- proximation: a gradient boosting machine. Annals of statistics, pages 1189-1232, 2001.
- [Hamilton et al., 2017] Will Hamilton, Zhitao Ying, and Jure Leskovec. Inductive representation learning on large graphs. In Advances in Neural Information Processing Systems, pages 1024-1034, 2017.
- [Hu et al., 2019] Binbin Hu, Zhiqiang Zhang, Chuan Shi, Jun Zhou, Xiaolong Li, and Yuan Qi. Cash-out user de- tection based on attributed heterogeneous information net- work with a hierarchical attention mechanism. In Proceed- ings of the AAAI Conference on Artificial Intelligence, vol- ume 33, pages 946-953, 2019.
- [Kim and Sohn, 2010] Hong Sik Kim and So Young Sohn. Support vector machines for default prediction of smes based on technology credit. European Journal of Oper- ational Research, 201(3):838-846, 2010.
- [Kingma and Ba, 2014] Diederik P Kingma and Jimmy Ba. Adam: A method for stochastic optimization. arXiv preprint arXiv:1412.6980, 2014.
- [Kipf and Welling, 2016] Thomas N Kipf and Max Welling. Semi-supervised classification with graph convolutional networks. arXiv preprint arXiv:1609.02907, 2016.
- [Lenny Koh et al., 2007] SC Lenny Koh, Mehmet Demirbag, Erkan Bayraktar, Ekrem Tatoglu, and Selim Zaim. The impact of supply chain management practices on performance of smes. Industrial Management & Data Systems, 107(1):103-124, 2007.
- [Liang et al., 2019] Chen Liang, Ziqi Liu, Bin Liu, Jun Zhou, Xiaolong Li, Shuang Yang, and Yuan Qi. Uncover- ing insurance fraud conspiracy with network learning. In Proceedings of the 42nd International ACM SIGIR Con- ference on Research and Development in Information Re- trieval, pages 1181-1184, 2019.
- [Liu et al., 2018] Ziqi Liu, Chaochao Chen, Xinxing Yang, Jun Zhou, Xiaolong Li, and Le Song. Heterogeneous graph neural networks for malicious account detection. In Proceedings of the 27th ACM International Conference on Information and Knowledge Management, pages 2077- 2085, 2018.
- [Liu et al., 2019] Ziqi Liu, Dong Wang, Qianyu Yu, Zhiqiang Zhang, Yue Shen, Jian Ma, Wenliang Zhong, Jin- jie Gu, Jun Zhou, Shuang Yang, et al. Graph representa- tion learning for merchant incentive optimization in mo- bile payment marketing. In Proceedings of the 28th ACM International Conference on Information and Knowledge Management, pages 2577-2584, 2019.
- [Malhotra et al., 2005] Arvind Malhotra, Sanjay Gosain, and Omar A El Sawy. Absorptive capacity configurations in supply chains: Gearing for partner-enabled market knowl- edge creation. MIS quarterly, 29(1), 2005.
- [Nicolicioiu et al., 2019] Andrei Nicolicioiu, Iulia Duta, and Marius Leordeanu. Recurrent space-time graph neural net- works. In Advances in Neural Information Processing Sys- tems, pages 12818-12830, 2019.
- [Niepert et al., 2016] Mathias Niepert, Mohamed Ahmed, and Konstantin Kutzkov. Learning convolutional neural networks for graphs. In International conference on ma- chine learning, pages 2014-2023, 2016.
- [Sankar et al., 2018] Aravind Sankar, Yanhong Wu, Liang Gou, Wei Zhang, and Hao Yang. Dynamic graph represen- tation learning via self-attention networks. arXiv preprint arXiv:1812.09430, 2018.
- [Scarselli et al., 2008] Franco Scarselli, Marco Gori, Ah Chung Tsoi, Markus Hagenbuchner, and Gabriele Monfardini. The graph neural network model. IEEE Transactions on Neural Networks, 20(1):61-80, 2008.
- [Vaaland and Heide, 2007] Terje I Vaaland and Morten Heide. Can the sme survive the supply chain chal- lenges? Supply chain management: an International Jour- nal, 12(1):20-31, 2007.
- [Veličković et al., 2017] Petar Veličković, Guillem Cucurull, Arantxa Casanova, Adriana Romero, Pietro Lio, and Yoshua Bengio. Graph attention networks. arXiv preprint arXiv:1710.10903, 2017.
- [Wang et al., 2019] Daixin Wang, Jianbin Lin, Peng Cui, Quanhui Jia, Zhen Wang, Yanming Fang, Quan Yu, Jun Zhou, Shuang Yang, and Yuan Qi. A semi-supervised graph attentive network for financial fraud detection. In 2019 IEEE International Conference on Data Mining (ICDM), pages 598-607. IEEE, 2019.
- [Xu et al., 2019] Dongkuan Xu, Wei Cheng, Dongsheng Luo, Xiao Liu, and Xiang Zhang. Spatio-temporal at- tentive rnn for node classification in temporal attributed graphs. In Proceedings of the 28th International Joint Conference on Artificial Intelligence, pages 3947-3953. AAAI Press, 2019. IJCAI
- [Zhang et al., 2020] Dalong Zhang, Xin Huang, Ziqi Liu, Zhiyang Hu, Xianzheng Song, Zhibang Ge, Zhiqiang Zhang, Lin Wang, Jun Zhou, and Yuan Qi. Agl: a scal- able system for industrial-purpose graph machine learning. arXiv preprint arXiv:2003.02454, 2020.
References were extracted automatically from the PDF and may contain errors.
Full text extracted automatically from the PDF; figures, tables and equations may differ. The PDF is the version of record.
1 Introduction
In recent years, the Small and Medium-sized Enterprises, called SMEs for short, become an essential part of the modern economy and have attracted more attentions from the financial institutions. Since the financial risk is the fundamental of most financial services (e.g., credit card, cash lending, insurance, etc), the financial risk analysis for SMEs, which requires to estimate SMEs' future credit status, has became crucial to all financial institutions. Recent literatures from both the finance community[Berger and Frame, 2007; Beck et al., 2011] and the machine learning community [Kim and Sohn, 2010] make great efforts to this problem. Some of them perform well-designed scoring functions, while others train machine learning models, to leverage various creditrelated attributes of individual SME for financial risk analysis.
However, unlike the large enterprises, the credit-related attributes of SMEs are hard to acquired sufficiently thus fail to perform satisfying results. Such a data deficiency problem becomes much more serious in the online financial institutions (e.g., Ant Financial, WeBank), since they seldom collect credit-related information directly from the SMEs. Therefore, the industry desiderates an innovative methodology which is able to model the financial risk of SMEs in a more comprehensive and practical way.
Although the credit-related attributes for individual SME are insufficient, the online financial institutions can acquire massive interactive relationships between SMEs (e.g., the social relations between the SMEs' owners, the transfers or transactions between SMEs or between SMEs and consumers). The abundant interactive data naturally forms a large-scale graph with SMEs as nodes and the interactions between them as edges (called SME graph). Intuitively, the graph is likely to contain effective information related to financial risk. However, on the other hand, it also contains noisy interactions which are irrelevant to our problem. How to find out the credit-related edges between SMEs is the key toward better financial risk analysis.
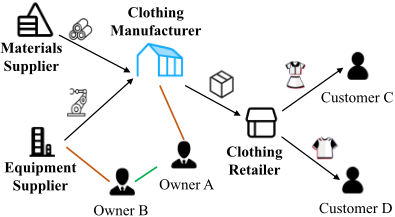
Previous works [Malhotra et al., 2005; Lenny Koh et al., 2007] have proved that the supply chain partners have strong impact to SMEs' business status, which implies that the supply chain relationship is one of the most important relationships between SMEs. Therefore, exploring supply chain relationships helps to comprehensively model the SMEs thus would improve the financial risk analysis for SMEs. The correlation between supply chain relationship and SME's financial risk will be analyzed detailedly in section 3. Figure 1 illustrates an example of the clothing industry supply chain. For the clothing manufacturers, they purchase production equipment and raw materials from the upstream SMEs,. On the other hand, the manufacturers wholesales theirits products (i.e., clothes) to the downstream SMEs (e.g., clothing retailers). At the end of the supply chain, the retailers sell clothes to the customers. Moreover, the owners of the equipment supplier and the clothing manufacturer have a strong social relation.
Considering the abundant but noisy SME graph and the strong correlation between supply chain relationship and SMEs' financial risk, in this paper, we address the data deficiency problem of financial risk analysis for SMEs, and propose an innovative methodology based on graph-based supply chain mining. The first and fundamental task in our proposal is supply chain mining over the SMEs graph. In order to subtly explore SME graph, we propose a Spatial-Temporal aware Graph Neural Network (ST-GNN) to model the local topology and the temporal variation of SME graph simultaneously. Following the semi-supervised link prediction objective, we train an end-to-end model to distinguish the underlying supply chain relationship from other noisy relations between SMEs. The trained model is applied on the whole SME graph and assigns each edge between SMEs with a confidence score. The original SME graph is then refined by filtering edges with lower confidence. We call the refined graph as supply-chain graph.
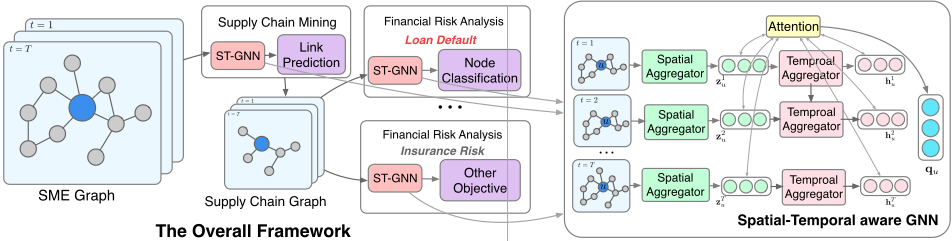
Based on the supply-chain graph, the data deficiency problem is alleviated by aggregating information from the neighborhood into the target SME. Therefore, taking the supplychain graph as the foundation, the financial institutions are able to perform better financial risk analysis for SMEs in various related products and services. To fully demonstrate the ability of the proposed supply chain mining based methodology, we tackle one of the most pivotal tasks in financial risk analysis for SMEs, i.e., the loan default prediction. This task requires to predict whether a SME will fail to repay the loan in the future. Inspired by the idea of information aggregation along the supply chain graph, we propose a novel loan default prediction method employing the forementioned STGNN within a supervised node classification objective. The left part of Figure 3 shows the overall framework of our proposal.
The major contributions of this paper is summrized as:
- We conduct inspiring data analyses to prove the intuition that supply chain relationships have strong impact to the financial risk analysis for SMEs. (See Section 3)
- Tackling the data deficiency problem of financial risk analysis for SMEs, we propose an innovative methodology based on graph-based supply chain mining. Considering the effectiveness required by financial applications, we design a spatial-temporal aware graph neural network, in a semi-supervised link prediction manner
| RF | RF1 | RF2 | RF3 | RF4 |
|---|---|---|---|---|
| Revenue | 53.9% | 94.5% | 63.9% | 97.7% |
| Shareholder | 41.3% | 88.3% | 53.6% | 91.6% |
| Mortgage | 0.8% | 7.1% | 4.0% | 9.5% |
| Recruitment | 5.8% | 52.4% | 18.1% | 56.7% |
| Patent | 1.5% | 19.1% | 7.8% | 22.7% |
to mine supply chain relationship among SME graph, and in a supervised node classification manner to predict loan default among supply chain graph.
- Extensive experimental results on real-world datasets illustrate that the supply chain relationships improve the accuracy of the loan default prediction significantly. Meanwhile, the proposed spatial-temporal aware graph neural network is more effective for both supply chain relationship mining and loan default prediction of SMEs.
2 RelatedWork
2.1 Supply Chain for SMEs
Lots of studies [Vaaland and Heide, 2007] have realized the importance of supply chain for SMEs. Previous research [Malhotra et al., 2005] has established that supply chain partners are engaging in interlinked processes that enable rich information sharing and knowledge creating, which indicated that SMEs have a great influence on their supply chain partners. Some other studies in the finance field [Lenny Koh et al., 2007] also discussed supply chain management for SMEs.
To the best of our knowledge, no study utilizes the supply chain information to improve the financial risk analysis accuracy for SMEs.
2.2 Graph Neural Network
The concept of Graph Neural Network (GNN) was first proposed in [Scarselli et al., 2008]. And the following research on GNN presented in [Bruna et al., 2013; Kipf and Welling, 2016], is based on spectral graph theory. However, spectral-based methods handle the whole graph simultaneously, and are difficult to be applied on a large-scale graph. As a result, spatial-based GNN was gradually proposed in [Niepert et al., 2016; Hamilton et al., 2017; Hu et al., 2019; Wang et al., 2019]. These methods directly aggregated the neighbor nodes' information. And GNN models are also widely used in financial businesses [Liu et al., 2019; Liu et al., 2018; Liang et al., 2019]. Most of the previous GNN models focus on exploring the static graph. Some literatures [Sankar et al., 2018; Xu et al., 2019; Nicolicioiu et al., 2019] employ temporal design in GNNs, to jointly learned the spatial and temporal contextual information. However, seldom of them tackle the problem of modeling temporal variation in financial risk. In the scenario of financial risk analysis, the variation of risk may lurk for quite a long time.
3 Exploratory Analyses
In this section, two exploratory analyses are conducted to verify two perspectives: first, the data deficiency problem for SMEs can be alleviated by exploring the supply chain relationships, and second, the supply chain relationships have great impact on SMEs' financial risk.
In summary, the analyses are conducted on 28 million SMEs and 219 million ground truth supply chain relationships. Each SME averagely has 6.7 upstream SMEs and 23.2 downstream SMEs. Specifically, we refer to the SMEs that default for more than 30 days as default SMEs.
3.1 Data Deficiency can be Alleviated with Supply Chain
Data deficiency problem for SMEs exists in various categories of credit-related attributes. Leveraging the supply chain relationships can help to alleviate this problem by absorbing information from the receptive field of each SMEs. To verify this perspectives, we first define four type of receptive field, i.e., target SME itself (RF1), target SME together with its upstream SMEs (RF2), target SME together with its downstream SMEs (RF3) and target SME together with its upstream and downstream SMEs (RF4), and perform evaluation over five categories of attributes, i.e., revenue, shareholder, mortgage, recruitment and patent. Note that each category contain 5 to 10 attributes. Table 1 demonstrates the fractions of SMEs whose receptive fields contain nodes (SMEs) with attributes w.r.t. the five categories.
As shown in Table 1, the five categories of credit-related attributes suffer deficiency problem to varying degree (see the results of receptive field RF1). Fortunately, the supply chain relationship enhances the information of individual SME in all of the five categories. For instance, only 1.5% SMEs have attributes about patent. But if they absorb their supply chain partners' patent information, the percentage of SMEs having patent attributes increases to 22.7%. Moreover, in this dataset, more information are supplemented by the upstream SMEs.
3.2 Correlation between Supply Chain and Financial Risk
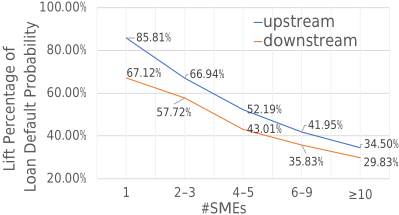
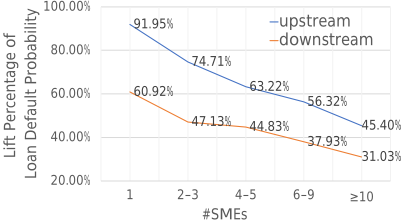
To verify that supply chain relationship has great impact on financial risk, we explore how the number of upstream or downstream SMEs affects the targeted SME's loan default probability (one of the common and important financial risk). We categorize the SMEs into five groups according to the number of upstream/downstream SMEs in the supply chain. Figure 2 demonstrates the lift percentage of loan default probability, which is defined as the loan default probability in a certain group divided by the average loan default probability of all SMEs, to indicate the financial risk of SMEs in different groups. Note that the value less than 1 means the corresponding group has lower risk than the average, and the smaller value means the lower risk.
From Figure 2, it's obviously that the SMEs with observed supply chain partner (even with only one) have lower financial risk (i.e., loan default probability) than the average risk. Moreover, with the increase of the number of upstream/downstream SMEs, the financial risk reduces significantly. Specifically, with more than 10 upstream or downstream partners, the financial risk reduces more than a half w.r.t average risk (i.e., 34.50% and 29.83% respectively). In practice, a SME with more supply chain partners usually has higher operation stability. It's worth to mention that, a SME with the same number of downstream SMEs has a lower risk than with upstream SMEs. Actually, more downstream partners implies that its productions attract more buyers, thus the targeted SME has lower financial risk.
According to the above analyses, we conclude that: first, mining the supply chain is able to alleviated the data deficiency problem of financial risk analysis. And second, there exists strong correlations between supply chain and SMEs' financial risk. Based on the two conclusions, how to effectively mine the actual supply chains from the SME graph and how to subtly leverage them in financial risk analysis are the two main issues toward the innovative and effective financial risk analysis for SMEs.
4 Methodology
Before diving into the proposed methodology, let's introduce some notations and definitions first. Then, we will elaborate the architecture of the spatial-temporal aware graph neural network, as well as how to employ it in supply chain mining and financial risk analysis.
4.1 Notations and Definitions
Definition 1. SME Graph. The temporal SME graph is denoted as an ordered set of T graph snapshots G = {G t }Tt=1 = {{V, E t ,Xt ,Et }}Tt=1 . Here, V and E denotes the node and the edge set, including SMEs, consumers, and the owners of SMEs, E t denotes the edge set at time t. Xt ∈ R|V|×fV and Et ∈ R|E|×fE denote the original node feature matrix and edge feature matrix of all nodes and edges at time t.
Note that the supply chain graph Gsc is also treated as temporal graph with multiple graph snapshots, and each of them is a subset of G t with all the SMEs.
Definition 2. Graph-based Supply Chain Mining Given the temporal SME graph G = {Gt}Tt=1 , and a set of labeled edges between SMEs Dsc = {(u, v, y)} (y = 1 denotes there exists a supply chain relationship between u and v, otherwise y =
<
l
a
t
e
x
i
s
h
1
_
b
6
4
=
"
j
d
U
0
g
n
7
z
T
V
I
c
R
S
Y
2
M
X
A
o
>
B
N
8
E
J
3
r
q
/
9
L
m
k
f
Z
u
Q
+
C
F
w
K
P
G
H
p
y
W
O
5
D
v
t = 1
T

ࢶᔮىմӱ
<
l
a
t
e
x
i
s
h
1
_
b
6
4
=
"
j
f
0
O
p
A
T
5
o
/
D
w
I
H
G
S
>
B
n
c
V
N
8
E
J
3
W
X
K
k
U
9
C
v
2
Q
+
z
F
q
7
m
Z
u
Y
L
y
r
d
M
g
P
R
<
l
a
t
e
x
i
s
h
1
_
b
6
4
=
"
j
d
U
0
g
n
7
z
T
V
I
c
R
S
Y
2
M
X
A
o
>
B
N
8
E
J
3
r
q
/
9
L
m
k
f
Z
u
Q
+
C
F
w
K
P
G
H
p
y
W
O
5
D
v
<
l
a
t
e
x
i
s
h
1
_
b
6
4
=
"
j
f
0
O
p
A
T
5
o
/
D
w
I
H
G
S
>
B
n
c
V
N
8
E
J
3
W
X
K
k
U
9
C
v
2
Q
+
z
F
q
7
m
Z
u
Y
L
y
r
d
M
g
P
R
<
l
a
t
e
x
i
s
h
1
_
b
6
4
=
"
j
d
U
0
g
n
7
z
T
V
I
c
R
S
Y
2
M
X
A
o
>
B
N
8
E
J
3
r
q
/
9
L
m
k
f
Z
u
Q
+
C
F
w
K
P
G
H
p
y
W
O
5
D
v
<
l
a
t
e
x
i
s
h
1
_
b
6
4
=
"
j
f
0
O
p
A
T
5
o
/
D
w
I
H
G
S
>
B
n
c
V
N
8
E
J
3
W
X
K
k
U
9
C
v
2
Q
+
z
F
q
7
m
Z
u
Y
L
y
r
d
M
g
P
R
<
l
a
t
e
x
i
s
h
1
_
b
6
4
=
"
U
g
d
T
E
2
m
z
D
5
c
7
Y
f
R
P
8
>
A
B
n
V
N
S
J
3
r
q
/
9
L
0
K
Q
C
v
H
W
M
u
O
o
k
X
j
Z
F
y
G
p
I
w
+
<
l
a
t
e
x
i
s
h
1
_
b
6
4
=
"
j
d
U
0
g
n
7
z
T
V
I
c
R
S
Y
2
M
X
A
o
>
B
N
8
E
J
3
r
q
/
9
L
m
k
f
Z
u
Q
+
C
F
w
K
P
G
H
p
y
W
O
5
D
v
<
l
a
t
e
x
i
s
h
1
_
b
6
4
=
"
5
T
J
+
S
7
V
N
p
R
g
F
c
q
I
D
d
k
Z
A
>
B
H
8
E
3
U
r
/
9
L
0
m
o
M
2
Q
z
u
G
j
Y
w
y
f
v
O
X
W
C
P
K
n
<
l
a
t
e
x
i
s
h
1
_
b
6
4
=
"
5
T
J
+
S
7
V
N
p
R
g
F
c
q
I
D
d
k
Z
A
>
B
H
8
E
3
U
r
/
9
L
0
m
o
M
2
Q
z
u
G
j
Y
w
y
f
v
O
X
W
C
P
K
n
<
l
a
t
e
x
i
s
h
1
_
b
6
4
=
"
5
T
J
+
S
7
V
N
p
R
g
F
c
q
I
D
d
k
Z
A
>
B
H
8
E
3
U
r
/
9
L
0
m
o
M
2
Q
z
u
G
j
Y
w
y
f
v
O
X
W
C
P
K
n
<
l
a
t
e
x
i
s
h
1
_
b
6
4
=
"
j
f
0
O
p
A
T
5
o
/
D
w
I
H
G
S
>
B
n
c
V
N
8
E
J
3
W
X
K
k
U
9
C
v
2
Q
+
z
F
q
7
m
Z
u
Y
L
y
r
d
M
g
P
R
<
l
a
t
e
x
i
s
h
1
_
b
6
4
=
"
j
d
U
0
g
n
7
z
T
V
I
c
R
S
Y
2
M
X
A
o
>
B
N
8
E
J
3
r
q
/
9
L
m
k
f
Z
u
Q
+
C
F
w
K
P
G
H
p
y
W
O
5
D
v
<
l
a
t
e
x
i
s
h
1
_
b
6
4
=
"
3
R
+
A
D
P
c
o
J
H
u
E
I
B
2
>
9
X
V
L
S
N
F
p
r
f
Z
d
v
g
q
0
G
j
K
W
T
M
n
z
U
7
Y
/
8
O
k
w
m
C
Q
5
y
<
l
a
t
e
x
i
s
h
1
_
b
6
4
=
"
5
+
r
M
E
8
W
X
H
P
Y
m
D
Q
T
p
A
>
B
9
c
V
L
S
N
F
3
u
U
d
0
7
K
C
f
g
I
2
O
n
z
w
j
v
G
o
k
Z
J
q
R
y
/
<
l
a
t
e
x
i
s
h
1
_
b
6
4
=
"
w
U
F
G
K
q
y
k
c
Q
N
2
X
v
3
E
>
A
B
9
V
D
L
S
W
u
r
Y
m
j
T
M
p
O
Z
H
P
/
0
R
d
z
+
7
8
I
f
5
n
J
C
g
o
<
l
a
t
e
x
i
s
h
1
_
b
6
4
=
"
5
O
Y
R
W
Q
J
2
u
c
N
k
w
o
X
E
>
A
B
9
V
D
L
S
g
M
F
3
j
Z
p
m
U
+
C
y
K
n
H
f
G
7
/
r
z
v
8
P
0
T
I
d
q
<
l
a
t
e
x
i
s
h
1
_
b
6
4
=
"
J
M
7
u
5
w
n
o
k
D
H
X
v
8
V
W
z
c
0
>
A
B
9
L
S
N
F
2
p
r
f
Z
d
g
q
G
P
E
y
m
3
T
Q
/
j
U
C
K
O
Y
+
I
R
<
l
a
t
e
x
i
s
h
1
_
b
6
4
=
"
F
O
M
u
L
n
2
D
U
f
y
R
N
v
T
9
P
Z
Q
>
A
B
X
c
V
S
g
p
r
d
k
w
W
o
G
5
+
J
j
3
I
Y
/
H
7
8
K
z
m
q
C
E
0
<
l
a
t
e
x
i
s
h
1
_
b
6
4
=
"
+
8
m
9
V
q
U
R
F
y
o
L
H
C
/
N
E
>
A
B
3
c
D
S
2
p
r
f
Z
d
u
v
g
0
G
X
j
K
J
P
T
z
7
Y
O
k
w
W
n
I
5
M
Q
<
l
a
t
e
x
i
s
h
1
_
b
6
4
=
"
j
d
U
0
g
n
7
z
T
V
I
c
R
S
Y
2
M
X
A
o
>
B
N
8
E
J
3
r
q
/
9
L
m
k
f
Z
u
Q
+
C
F
w
K
P
G
H
p
y
W
O
5
D
v
<
l
a
t
e
x
i
s
h
1
_
b
6
4
=
"
j
f
0
O
p
A
T
5
o
/
D
w
I
H
G
S
>
B
n
c
V
N
8
E
J
3
W
X
K
k
U
9
C
v
2
Q
+
z
F
q
7
m
Z
u
Y
L
y
r
d
M
g
P
R
<
l
a
t
e
x
i
s
h
1
_
b
6
4
=
"
U
g
d
T
E
2
m
z
D
5
c
7
Y
f
R
P
8
>
A
B
n
V
N
S
J
3
r
q
/
9
L
0
K
Q
C
v
H
W
M
u
O
o
k
X
j
Z
F
y
G
p
I
w
+
<
l
a
t
e
x
i
s
h
1
_
b
6
4
=
"
5
T
J
+
S
7
V
N
p
R
g
F
c
q
I
D
d
k
Z
A
>
B
H
8
E
3
U
r
/
9
L
0
m
o
M
2
Q
z
u
G
j
Y
w
y
f
v
O
X
W
C
P
K
n
<
l
a
t
e
x
i
s
h
1
_
b
6
4
=
"
5
T
J
+
S
7
V
N
p
R
g
F
c
q
I
D
d
k
Z
A
>
B
H
8
E
3
U
r
/
9
L
0
m
o
M
2
Q
z
u
G
j
Y
w
y
f
v
O
X
W
C
P
K
n
<
l
a
t
e
x
i
s
h
1
_
b
6
4
=
"
5
T
J
+
S
7
V
N
p
R
g
F
c
q
I
D
d
k
Z
A
>
B
H
8
E
3
U
r
/
9
L
0
m
o
M
2
Q
z
u
G
j
Y
w
y
f
v
O
X
W
C
P
K
n
<
l
a
t
e
x
i
s
h
1
_
b
6
4
=
"
3
R
+
A
D
P
c
o
J
H
u
E
I
B
2
>
9
X
V
L
S
N
F
p
r
f
Z
d
v
g
q
0
G
j
K
W
T
M
n
z
U
7
Y
/
8
O
k
w
m
C
Q
5
y
<
l
a
t
e
x
i
s
h
1
_
b
6
4
=
"
5
+
r
M
E
8
W
X
H
P
Y
m
D
Q
T
p
A
>
B
9
c
V
L
S
N
F
3
u
U
d
0
7
K
C
f
g
I
2
O
n
z
w
j
v
G
o
k
Z
J
q
R
y
/
<
l
a
t
e
x
i
s
h
1
_
b
6
4
=
"
w
U
F
G
K
q
y
k
c
Q
N
2
X
v
3
E
>
A
B
9
V
D
L
S
W
u
r
Y
m
j
T
M
p
O
Z
H
P
/
0
R
d
z
+
7
8
I
f
5
n
J
C
g
o
<
l
a
t
e
x
i
s
h
1
_
b
6
4
=
"
5
O
Y
R
W
Q
J
2
u
c
N
k
w
o
X
E
>
A
B
9
V
D
L
S
g
M
F
3
j
Z
p
m
U
+
C
y
K
n
H
f
G
7
/
r
z
v
8
P
0
T
I
d
q
<
l
a
t
e
x
i
s
h
1
_
b
6
4
=
"
J
M
7
u
5
w
n
o
k
D
H
X
v
8
V
W
z
c
0
>
A
B
9
L
S
N
F
2
p
r
f
Z
d
g
q
G
P
E
y
m
3
T
Q
/
j
U
C
K
O
Y
+
I
R
<
l
a
t
e
x
i
s
h
1
_
b
6
4
=
"
F
O
M
u
L
n
2
D
U
f
y
R
N
v
T
9
P
Z
Q
>
A
B
X
c
V
S
g
p
r
d
k
w
W
o
G
5
+
J
j
3
I
Y
/
H
7
8
K
z
m
q
C
E
0
<
l
a
t
e
x
i
s
h
1
_
b
6
4
=
"
+
8
m
9
V
q
U
R
F
y
o
L
H
C
/
N
E
>
A
B
3
c
D
S
2
p
r
f
Z
d
u
v
g
0
G
X
j
K
J
P
T
z
7
Y
O
k
w
W
n
I
5
M
Q
u 0), the goal of graph-based supply chain mining is to find out the actual supply chains between SMEs in the future.
t = 1 Spatial Aggregator Temproal Aggregator Attention u z1u Definition 3. Loan Default Prediction based on Supply Chain Graph Given the temporal supply chain graph Gsc = {G tsc }Tt=1 and a set of labeled SMEs as training set Ddp = {(u, y)}, here y = 1 denotes default otherwise y = 0, the goal of loan default prediction based on supply chain graph is to predict the future default probability of SMEs.
t = 2
ŏ Spatial Aggregator Temproal Aggregator u z2u 4.2 Spatial-Temporal aware Graph Neural Network
t = T Spatial Aggregator Temproal Aggregator u zTu യ᱾ଫ׀Ӥӥ ࢶாۖ ᐟᕪᗑᕶ ᱾ളᶼၥ ຉړᰂᣟᷚᴾ ࢶாۖ ᔄړᜓᅩ ᐟᕪᗑᕶ t = T ࣳմӱ᭨๗ᷚᴾ3'ཛྷ ŏ t = 1 ຉړᰂᣟᷚᴾ The right part of Figure 3 demonstrates the overall architecture of ST-GNN, which has two core components: the spatial-aware aggregator and the temporal-aware aggregator. As shown in Figure 3, the proposed ST-GNN first employs spatial-aware aggregator in each snapshot of the temporal graph. After that, for a node in the T graph snapshots, we can acquire T spatial embeddings respectively. By taking all the T spatial embeddings as input, the temporal-aware aggregator models the temporal variation within the sequential graph snapshots, and outputs temporal embeddings. Finally, by leveraging the attention mechanism over the spatial embeddings and temporal embeddings, ST-GNN output the final node embedding and combine it with the downstream learning objective to form an end-to-end model.
ࢶ᱾ଫ׀մӱ ࢶாۖ ۓձ՜ٌ ᐟᕪᗑᕶ Generally, given a targeted node u and its neighborhood at t time N tu , the spatial-aware aggregator φ(·) can be defined as:
where xtu and etu,v is the original feature vector of node u and edge (u, v) at time t, respectively, Θtφ is the learnable parameter set of the spatial-aware aggregator at time t. Considering the fact that different neighbors have different impacts on the targeted node, the linear attention operator is adopted to implement φ(·). Specifically, Equation 1 are revised as follows:

t = T t = 2 ŏ ݳᑮᳵᘸ ᓒৼ ݳᑮᳵᘸ ᓒৼ ݳᳵᘸ ᓒৼ ݳᳵᘸ ᓒৼ u u z2u zTu h2u hTu qu h1u h2u where σ is a nonlinear activation function (sigmoid function in our implementation), [·, ·] denotes the concatenation of vectors, Wtφ1 , Wtφ2 , Wtφ3 and vtφ are learnable parameters of the spatial-aware aggregator at t time. By stacking this aggregator iteratively for L times, the final spatial embedding is able to absorb the topological and attributed information in L-hops neighborhood. For simplification, we still use ztu to denote the final spatial embedding for node u at time t.
qu Temporal aware Aggregator
hTu Generally, given a targeted node u and its spatial embeddings generated from T graph snapshots {ztu }Tt=1 , the temporal aware aggregator ϕ(·) can be defined as:
where Θϕ is the learnable parameter set of the temporal aware aggregator. To model the temporal variation of the T graph snapshots, we suggest to employ a LSTM-like operator to general temporal embeddings for u as follows:
where ⊙ denotes the element-wise multiplication. Note that the tth LSTM unit takes the current spatial embedding ztu and the previous temporal embedding ht-1 u and ct-1 u as input and output htu and ctu to the next unit. The temporal embedding htu encodes the temporal information of node u until the t time. As mentioned in [Xu et al., 2019], recent snapshots have greater impact on the learning procedure of LSTM. However, supply chain or financial risk may lurk for a long time. Tackling this problem, after collecting all the spatial and temporal embeddings of node u, we employ the attention operator over them to aggregate important spatial and temporal information among all the T graph snapshots. Specifically, given the set of spatial and temporal embeddings of node u denoted as Eemb = {ztu }Tt=1 ∪ {htu }Tt=1 , we em-
<
l
a
t
e
x
i
s
h
1
_
b
6
4
=
"
5
T
J
+
S
7
V
N
p
R
g
F
c
q
I
D
d
k
Z
A
>
B
H
8
E
3
U
r
/
9
L
0
m
o
M
2
Q
z
u
G
j
Y
w
y
f
v
O
X
W
C
P
K
n
<
l
a
t
e
x
i
s
h
1
_
b
6
4
=
"
j
f
0
O
p
A
T
5
o
/
D
w
I
H
G
S
>
B
n
c
V
N
8
E
J
3
W
X
K
k
U
9
C
v
2
Q
+
z
F
q
7
m
Z
u
Y
L
y
r
d
M
g
P
R
<
l
a
t
e
x
i
s
h
1
_
b
6
4
=
"
U
g
d
T
E
2
m
z
D
5
c
7
Y
f
R
P
8
>
A
B
n
V
N
S
J
3
r
q
/
9
L
0
K
Q
C
v
H
W
M
u
O
o
k
X
j
Z
F
y
G
p
I
w
+
<
l
a
t
e
x
i
s
h
1
_
b
6
4
=
"
j
d
U
0
g
n
7
z
T
V
I
c
R
S
Y
2
M
X
A
o
>
B
N
8
E
J
3
r
q
/
9
L
m
k
f
Z
u
Q
+
C
F
w
K
P
G
H
p
y
W
O
5
D
v
<
l
a
t
e
x
i
s
h
1
_
b
6
4
=
"
5
T
J
+
S
7
V
N
p
R
g
F
c
q
I
D
d
k
Z
A
>
B
H
8
E
3
U
r
/
9
L
0
m
o
M
2
Q
z
u
G
j
Y
w
y
f
v
O
X
W
C
P
K
n
<
l
a
t
e
x
i
s
h
1
_
b
6
4
=
"
5
T
J
+
S
7
V
N
p
R
g
F
c
q
I
D
d
k
Z
A
>
B
H
8
E
3
U
r
/
9
L
0
m
o
M
2
Q
z
u
G
j
Y
w
y
f
v
O
X
W
C
P
K
n
<
l
a
t
e
x
i
s
h
1
_
b
6
4
=
"
5
T
J
+
S
7
V
N
p
R
g
F
c
q
I
D
d
k
Z
A
>
B
H
8
E
3
U
r
/
9
L
0
m
o
M
2
Q
z
u
G
j
Y
w
y
f
v
O
X
W
C
P
K
n
<
l
a
t
e
x
i
s
h
1
_
b
6
4
=
"
3
R
+
A
D
P
c
o
J
H
u
E
I
B
2
>
9
X
V
L
S
N
F
p
r
f
Z
d
v
g
q
0
G
j
K
W
T
M
n
z
U
7
Y
/
8
O
k
w
m
C
Q
5
y
<
l
a
t
e
x
i
s
h
1
_
b
6
4
=
"
5
+
r
M
E
8
W
X
H
P
Y
m
D
Q
T
p
A
>
B
9
c
V
L
S
N
F
3
u
U
d
0
7
K
C
f
g
I
2
O
n
z
w
j
v
G
o
k
Z
J
q
R
y
/
<
l
a
t
e
x
i
s
h
1
_
b
6
4
=
"
w
U
F
G
K
q
y
k
c
Q
N
2
X
v
3
E
>
A
B
9
V
D
L
S
W
u
r
Y
m
j
T
M
p
O
Z
H
P
/
0
R
d
z
+
7
8
I
f
5
n
J
C
g
o
<
l
a
t
e
x
i
s
h
1
_
b
6
4
=
"
5
O
Y
R
W
Q
J
2
u
c
N
k
w
o
X
E
>
A
B
9
V
D
L
S
g
M
F
3
j
Z
p
m
U
+
C
y
K
n
H
f
G
7
/
r
z
v
8
P
0
T
I
d
q
<
l
a
t
e
x
i
s
h
1
_
b
6
4
=
"
J
M
7
u
5
w
n
o
k
D
H
X
v
8
V
W
z
c
0
>
A
B
9
L
S
N
F
2
p
r
f
Z
d
g
q
G
P
E
y
m
3
T
Q
/
j
U
C
K
O
Y
+
I
R
<
l
a
t
e
x
i
s
h
1
_
b
6
4
=
"
F
O
M
u
L
n
2
D
U
f
y
R
N
v
T
9
P
Z
Q
>
A
B
X
c
V
S
g
p
r
d
k
w
W
o
G
5
+
J
j
3
I
Y
/
H
7
8
K
z
m
q
C
E
0
<
l
a
t
e
x
i
s
h
1
_
b
6
4
=
"
+
8
m
9
V
q
U
R
F
y
o
L
H
C
/
N
E
>
A
B
3
c
D
S
2
p
r
f
Z
d
u
v
g
0
G
X
j
K
J
P
T
z
7
Y
O
k
w
W
n
I
5
M
Q
ploy a linear attention operator over them and generate the final embeddings qu as follows:
where βe denotes the normalized attention score w.r.t. embedding e. Thus, the final embedding qu is able to adaptively capture the spatial and temporal information from node u's neighborhoods of the T graph snapshots. Next, the node embedding q can be delivered to the downstream learning objective to form an end-to-end model.
4.3 Supply ChainMining
As mentioned above, we formalize the supply chain mining task as a supervised link prediction problem. Specifically, given the labeled edge set Dsc = {u, v, y}, we employ a MLP with cross entropy loss based on the final node embeddings q as follows:
where MLPsc(·) is a multi-layer perception with two fullyconnected layers based on the concatenation of two node embeddings. In practical implementation, a l2 regularization of all learnable parameters should be add to Lsc.
4.4 Loan Default Prediction
As mentioned above, we formalize the loan default prediction task as a node classification problem. Specifically, give the labeled node set Ddp = {u, y}, we also employ a MLP with cross entropy loss based on the final node embeddings q as follows:
where MLPdp(·) is a multi-layer perception with two fullyconnected layers based on the corresponding node embedding. In practical implementation, a l2 regularization of all learnable parameters should be add to Ldp.
Note that for the supply chain mining task, the node embeddings are generated based on the SME graph G. After acquiring supply chains with higher predicted scores, a supply chain graph Gsc is built as mentioned in subsection 4.1. For the loan default prediction task, the node embeddings are generated based on the supply chain graph Gsc. Both the two models are trained in an end-to-end manner with the ADAM optimizer.
5 Experiments
In this section, extensive experiments are conducted on the large-scale industrial datasets to evaluate the effectiveness of the proposed financial risk analysis framework for SMEs.
| Dataset | Supply Chain Mining | Default Prediction |
|---|---|---|
| Nodes | 23.4M | 8.6M |
| Edges | 103.2M | 21.1M |
| Node Features | 95 | 66 |
| Edge Features | 160 | 52 |
| Train | 904K | 529K |
| Validation | 301K | 217K |
| Test | 602K | 307K |
5.1 Experiments Setup
Datasets
The SME graph as well as the labeled data for supply chain mining are from Alipay, a mobile cashless payment service. The lending data is from Ant SME Lending, an online credit loan service for SMEs.
Data Protection Statement:
- The data used in this research does not involve any Personal Identifiable Information (PII).
- The data used in this research were all processed by data abstraction and data encryption, and the researchers were unable to restore the original data.
- Sufficient data protection was carried out during the process of experiments to prevent the data leakage and the data was destroyed after the experiments were finished.
- The data is only used for academic research and sampled from the original data, therefore it does not represent any real business situation in Ant Financial Services Group.
For supply chain mining, we employ the ownerships of SMEs and their owners, the transfers/transactions between SMEs and between consumers, and the social relations between the owners of SMEs, to build the SME graph. About 1.8 million ground-truth relationships are used for model training and evaluation. For the loan default prediction, about 21 millions supply chain edges with 8.6 million SMEs mined from the previous task are utilized to construct the supply chain graph. The model is trained and evaluated over about 1 million SMEs' post-loan information.
More specifically, both the SME graph and the supply chain graph are temporal graph with three snapshots on each nodes. The supply chain graph is constructed based on the results from supply chain mining. We guarantee that the data from the training set and the validation set is ahead of the test set, which ensures that we are predicting the future.
Baselines
We consider three categories of methods as baselines: Treebased Methods, GNN-based methods and the proposed STGNN.
- Tree-based methods: GBDT[Friedman, 2001] model takes the credit-related features of the corresponding individual SME. GBDTst employs some well-designed spatial and temporal features, e.g., the number of interactive SMEs or consumers, first month revenue and second month revenue derived from the original feature
| Data set | Supply Chain Mining | Default Prediction | ||
|---|---|---|---|---|
| Model | AUC | KS | AUC | KS |
| GBDT | 0.986 | 0.917 | 0.574 | 0.094 |
| GBDTst | 0.987 | 0.921 | 0.581 | 0.102 |
| GAT | 0.988 | 0.926 | 0.671 | 0.231 |
| GATensemble | 0.990 | 0.937 | 0.673 | 0.236 |
| STAR | 0.991 | 0.941 | 0.696 | 0.272 |
| ST-GNN | 0.995 | 0.948 | 0.701 | 0.276 |
revenue, etc. Note that GBDT is widely used in lots of prediction tasks among conventional financial institutions.
- GNN-based methods: Most GNN models learn node representation in a static graph. GAT[Veliˇckovi´c et al., 2017] based on the recent graph snapshot is chosen in this category. Moreover, GATensemble first applies GAT in each graph snapshot, then uses ensemble mechanism to generate final prediction. STAR [Xu et al., 2019] is a temporal graph neural network.
- ST-GNN is our proposed spatial-temporal aware graph neural network model introduced in Section 4.
Note that for the supply chain mining task, the tree-based models take the concatenation of features of the two examplerelated nodes as input. And the static GNN-based model, i.e., GAT, takes the most recent graph snapshot as input.
We implement all GNN models in TensorFlow with the Adam optimizer [Kingma and Ba, 2014], and set the hyperparameters according to the best result in validation set. All the GNN-based models are set to involve 2-hop neighbors. Models are trained on a cluster of 15 Dual-CPU server with AGL framework [Zhang et al., 2020]. We evaluate the performance of different methods with AUC (Area Under Curve) and KS (Kolmogorov-Smirnov).
5.2 Result Analysis
Effectiveness
As shown in Table 3, with some well-designed spatial and temporal feature, the GBDTst achieve better performance than the GBDT with only credit-related features. Since GNNbased methods effectively leverage the spatial topological and attributed information, they outperform GBDT-based models in both two task. Among all GNN-based methods, GAT with only a static graph can't outperform others with a series of graph snapshots. With the help of temporal aggregator, both STAR and the proposed ST-GNN outperform GATensemble, which model multiple graph snapshots by simple ensemble mechanism. It's obviously ST-GNN achieves the best performance in both two tasks, which illustrates the effectiveness of the proposed spatial and temporal aware aggregator. Specifically, the improvement of ST-GNN against STAR is achieved by the ingenious design of attention operator over both spatial and temporal embeddings.
Note that in the loan default prediction task, GNN-based models are significantly superior to the tree-based method. It implies that the data deficiency problem can be alleviated by introducing the supply chain relationships, thus results in a great improvement. We can conclude that the idea of mining supply chain relationship with a graph-based model is fundamental and effective to the financial risk analysis for SME.
The Impact of Mined Supply Chain on Financial Risk Analysis
Here we conduct a similar analysis in subsection 3.2 on the mined supply chain relationships (i.e., the top 20% edges with the highest confident scores of ST-GNN), to further demonstrate the effectiveness of our supply chain mining model. As shown in Figure 4, SMEs with mined supply chain partners (even with only one) have lower financial risk (i.e., loan default probability) than the average risk. Moreover, as the number of upstream/downstream SMEs increases, the financial risk reduces significantly. Compared to Figure 2, it's obviously that the result of mined supply chain relationship is quite similar to the result of the observed relationship (ground truth). It implies that the mined supply chain have a very high confidence to be the actual one and it also have great impact on financial risk of SMEs.
6 Conclusion
In this paper, we address the data deficiency problem of financial risk analysis for SMEs, and propose an innovative financial risk analysis methodology based on graph-based supply chain mining. To better model the spatial topology and temporal variation of the financial graph data, we design a novel spatial-temporal graph neural network(ST-GNN), and apply it to mine high-confident supply chain relationships, as well as predict SMEs' financial risk. The experimental results on real-world financial datasets illustrate that the mined supply chains alleviate the data deficiency problem and the overall proposal is very effective to financial risk analysis for SMEs.
In the future, we expect to further apply the proposed financial risk analysis framework to other financial applications for SMEs (e.g., supply chain finance, insurance services, etc). As for the ST-GNN model, we would like to polish it to enable the capability of interpretability, both in spatial topology and temporal variation. We believe that with such capability, our proposed framework is able to boost the performance of more financial services.
@inproceedings{ijcai2020p643,
  title     = {Financial Risk Analysis for SMEs with Graph-based Supply Chain Mining},
  author    = {Yang, Shuo and Zhang, Zhiqiang and Zhou, Jun and Wang, Yang and Sun, Wang and Zhong, Xingyu and Fang, Yanming and Yu, Quan and Qi, Yuan},
  booktitle = {Proceedings of the Twenty-Ninth International Joint Conference on
               Artificial Intelligence, {IJCAI-20}},
  publisher = {International Joint Conferences on Artificial Intelligence Organization},
  editor    = {Christian Bessiere},
  pages     = {4661--4667},
  year      = {2020},
  month     = {7},
  note      = {Special Track on AI in FinTech},
  doi       = {10.24963/ijcai.2020/643},
  url       = {https://doi.org/10.24963/ijcai.2020/643},
}
TY - CPAPER TI - Financial Risk Analysis for SMEs with Graph-based Supply Chain Mining AU - Yang, Shuo AU - Zhang, Zhiqiang AU - Zhou, Jun AU - Wang, Yang AU - Sun, Wang AU - Zhong, Xingyu AU - Fang, Yanming AU - Yu, Quan AU - Qi, Yuan T2 - Proceedings of the Twenty-Ninth International Joint Conference on Artificial Intelligence, IJCAI-20 PB - International Joint Conferences on Artificial Intelligence Organization PY - 2020 SP - 4661 EP - 4667 DO - 10.24963/ijcai.2020/643 UR - https://doi.org/10.24963/ijcai.2020/643 ER -Copied
Machine-readable versions of this paper, for tools and AI agents:





