
Recommender Systems for Democracy: Toward Adversarial Robustness in Voting Advice Applications
Proceedings of the Thirty-Fourth International Joint Conference on Artificial Intelligence. AI and Social Good. Pages 9564-9572.
https://doi.org/10.24963/ijcai.2025/1063
Keywords
- Multidisciplinary Topics and Applications: General
- AI Ethics, Trust, Fairness: General
- Humans and AI: General
Abstract
Voting advice applications (VAAs) help millions of voters understand which political parties or candidates best align with their views. This paper explores the potential risks these applications pose to the democratic process when targeted by adversarial entities. In particular, we expose 11 manipulation strategies and measure their impact using data from Switzerland’s primary VAA, Smartvote, collected during the last two national elections. We find that altering application parameters, such as the matching method, can shift a party’s recommendation frequency by up to 105%. Cherry-picking questionnaire items can increase party recommendation frequency by over 261%, while subtle changes to parties’ or candidates’ responses can lead to a 248% increase. To address these vulnerabilities, we propose adversarial robustness properties VAAs should satisfy, introduce empirical metrics for assessing the resilience of various matching methods, and suggest possible avenues for research toward mitigating the effect of manipulation. Our framework is key to ensuring secure and reliable AI-based VAAs poised to emerge in the near future.
- [Batterton and Hale, 2017] Katherine A Batterton and Kim- berly N Hale. The likert scale what it is and how to use it. Phalanx, 50(2):32-39, 2017.
- [Etter et al., 2014] Vincent Etter, Julien Herzen, Matthias Grossglauser, and Patrick Thiran. Mining democracy. In Proceedings of the second ACM conference on Online so- cial networks, pages 1-12, 2014.
- [Garzia and Marschall, 2012] Diego Garzia and Stefan Marschall. Voting advice applications under review: the state of research. International Journal of Electronic Governance, 5(3-4):203-222, 2012.
- [Garzia and Marschall, 2014] Diego Garzia and Stefan Marschall. Matching Voters With Parties and Candidates. Voting Advice Applications in a Comparative Perspective. ECPR Press, 01 2014.
- [Germann and Gemenis, 2019] Micha Germann and Kostas Gemenis. Getting out the vote with voting advice applica- tions. Political Communication, 36(1):149-170, 2019.
- [Hurley, 2011] Neil J Hurley. Robustness of recommender systems. In Proceedings of the fifth ACM conference on Recommender systems, pages 9-10, 2011.
- [Isotalo, 2021] Veikko Isotalo. Improving candidate-based voting advice application design: The case of finland. In- formaatiotutkimus, 40(3):85-109, 2021.
- [Kenneally and Dittrich, 2012] Erin Kenneally and David Dittrich. The menlo report: Ethical principles guiding in- formation and communication technology research. Avail- able at SSRN 2445102, 2012.
- [Kirkpatrick et al., 1983] Scott Kirkpatrick, C Daniel Gelatt Jr, and Mario P Vecchi. Optimization by simulated annealing. science, 220(4598):671-680, 1983.
- [Ladner and Pianzola, 2010] Andreas Ladner and Joëlle Pi- anzola. Do voting advice applications have an effect on electoral participation and voter turnout? evidence from the 2007 swiss federal elections. In Electronic Partici- pation: Second IFIP WG 8.5 International Conference, ePart 2010, Lausanne, Switzerland, August 29-September 2, 2010. Proceedings 2, pages 211-224. Springer, 2010.
- [Ladner, 2016] Andreas Ladner. Do vaas encourage issue voting and promissory representation? evidence from the swiss smartvote. Policy & Internet, 8(4):412-430, 2016.
- [Louwerse and Rosema, 2014] Tom Louwerse and Martin Rosema. The design effects of voting advice applications: Comparing methods of calculating matches. Acta politica, 49:286-312, 2014.
- [Munzert and Ramirez-Ruiz, 2021] Simon Munzert and Se- bastian Ramirez-Ruiz. Meta-analysis of the effects of voting advice applications. Political Communication, 38(6):691-706, 2021.
- [Ovaisi et al., 2022] Zohreh Ovaisi, Shelby Heinecke, Jia Li, Yongfeng Zhang, Elena Zheleva, and Caiming Xiong. Rgrecsys: A toolkit for robustness evaluation of recom- mender systems. In Proceedings of the Fifteenth ACM In- ternational Conference on Web Search and Data Mining, pages 1597-1600, 2022.
- [Pasek and Krosnick, 2010] Josh Pasek and Jon A Krosnick. Optimizing survey questionnaire design in political sci- ence: Insights from psychology. The Oxford Handbook of American Elections and Political Behavior, 2010. [Politools, 2024a] Politools. Smartvote. https://www. smartvote.ch, 2024. Accessed: 2025-06-05. Link
- [Politools, 2024b] Politools. Terms of use and data pro- tection. https://www.smartvote.ch/en/wiki/anb-privacy, 2024. Accessed: 2025-06-05. Link
- [Schwarz et al., 2010] Daniel Schwarz, Lisa Schädel, and Andreas Ladner. Pre-election positions and voting be- haviour in parliament: Consistency among swiss mps. Swiss Political Science Review, 16(3):533-564, 2010.
- [Tang et al., 2019] Jinhui Tang, Xiaoyu Du, Xiangnan He, Fajie Yuan, Qi Tian, and Tat-Seng Chua. Adversarial training towards robust multimedia recommender system. IEEE Transactions on Knowledge and Data Engineering, 32(5):855-867, 2019.
- [Terán, 2020] Luis Terán. Voting advice applications. Dy- namic Profiles for Voting Advice Applications: An Imple- mentation for the 2017 Ecuador National Elections, pages 15-26, 2020.
- [Thirey and Hickman, 2015] Benjamin Thirey and Randal Hickman. Distribution of euclidean distances between randomly distributed gaussian points in n-space. arXiv preprint arXiv:1508.02238, 2015.
- [Van der Linden and Dufresne, 2017] Clifton Van der Lin- den and Yannick Dufresne. The curse of dimensionality in voting advice applications: reliability and validity in al- gorithm design. Journal of Elections, Public Opinion and Parties, 27(1):9-30, 2017.
- [Walgrave et al., 2009] Stefaan Walgrave, Michiel Nuyte- mans, and Koen Pepermans. Voting aid applications and the effect of statement selection. West European Politics, 32(6):1161-1180, 2009.
References were extracted automatically from the PDF and may contain errors.
Full text extracted automatically from the PDF; figures, tables and equations may differ. The PDF is the version of record.
1 Introduction
Recent advances in information technology have significantly transformed our daily lives. One area that remains relatively underexplored is digital democracy, which integrates digital innovations into the political system. Among the most notable developments in this field is the emergence of Voting Advice Applications (VAAs). VAAs provide voters with personalized recommendations on which parties or candidates best align with their preferences and policy stances. VAAs exist in as many as 30 countries across the world, including the USA, Canada, Australia, as well as many European countries [Ter´an, 2020]. Interestingly, the legal basis of VAAs varies widely from country to country, ranging from publicly governed and regulated entities to loosely controlled private associations [Garzia and Marschall, 2012]. Strikingly, almost every country chooses a different method to match voters to candidates [Louwerse and Rosema, 2014]. In countries where VAAs are currently in use, they are often consulted by 1050% of voters [Ter´an, 2020], making them a highly popular source of information. On top of that, the advice provided by these applications has been shown to significantly influence both voter turnout and voter decisions [Munzert and Ramirez-Ruiz, 2021]. In Switzerland specifically, Germann and Gemenis [2019] showed that the VAA mobilized 58,000 additional voters in 2007, while Ladner and Pianzola [2010] reported that 67% of the users had stated that the VAA had influenced their voting behavior. The profound impact of VAAs has gone as far as triggering a shift from representative to promissory democracy, in which VAA profiles are interpreted as electoral promises [Ladner, 2016]. This transition occurred without requiring any changes to constitutional or legal frameworks. While the benefits of VAAs are undeniable and well-documented [Munzert and Ramirez-Ruiz, 2021], for the first time, this study aims to shed light on their potential vulnerabilities. Specifically, we seek to quantify the impact that a hypothetical adversarial actor could have on the recommendations. Toward this goal, we focus our analysis on Smartvote, Switzerland's primary VAA. In 2023, Smartvote was used by up to 20% of eligible Swiss voters, up from 17% in 2011. In 2023, a total of 2.1 million voting advice reports were created [Politools, 2024a]. Our contributions:
1 Corresponding authors.
2 See extended version for App. references (arXiv:2505.13329).
- We propose three adversarial robustness properties for VAAs. Namely, robustness against manipulation by (i) candidates and parties, (ii) platform operators, and (iii) question designers (Section 2).
- We empirically demonstrate the importance of these robustness properties by leveraging two comprehensive datasets collected by Smartvote during the Swiss national elections of 2019 and 2023. We uncover a total of 11 vulnerabilities through which adversaries could manipulate the recommendations (Table 1 and App. C). 2
- Based on the highest-risk vulnerabilities, we suggest 9 metrics to compare the adversarial robustness of existing and newly proposed matching methods (Section 5).
- Finally, with input from Politools, the non-profit organization behind Smartvote, we propose research directions to mitigate these vulnerabilities, enabling the development of more robust VAAs in the future (Section 6).
| Vulnerability | Adversary Type | Code | Section | Data | Benefactors | Visibility Gain | Likelihood | Impact |
|---|---|---|---|---|---|---|---|---|
| Answer Optimization | Candidates | AO | 4.1 | ✓ | user | 259% | Low | High |
| Answer Calibration | Candidates | AC | 4.1 | times | user list flagbalance-scale | 248% | High | High |
| Diversification | Candidates (Party) | DIV | 4.1 | times | flag | 345% | Medium | High |
| List Centralization | Candidates (Party) | LC | App. C | times | list | - | Low | Low |
| Matching Method | Platform operator | MM | 4.2 | times | balance-scale | 105% | Medium | Medium |
| Question Ordering | Platform operator | QO | App. C | ✓ | flag | 6% | Low | Low |
| Weight Selection | Platform operator | WS | 4.2 | times | balance-scale | ≈15% | Low | Low |
| Similarity Score | Platform operator | SS | 4.2 | times | flagbalance-scale | - | Medium | Low |
| Tie-breaking | Platform operator | TB | App. C | times | user | 210% | Medium | Medium |
| Question Favoritism | Question designer | QF | 4.3 | ✓ | flag | 261% | Low | High |
| Question Correlation | Question designer | QC | 4.3 | times | flag | - | Medium | Medium |
2 Background
Most popular VAAs use a set of questions Q = {qt}Nq t=1 to position both candidates C = {cj}Nc j=1 and voters V = {vi}Nv i=1 within the high-dimensional Euclidean space RNq . Formally, each question qt : V ∪C →At assigns an answer to a given voter or candidate, with At ⊆ R being the set of allowable answers for that question (generally discrete and bounded). For example, the question "Are VAAs robust?" might map the answers "No", "Rather no", "Rather yes", and "Yes" to the numerical values 0, 25, 75, and 100, respectively. Additionally, for each question qt, voters can typically choose a numerical weight within a set of allowable values Wt ⊆ R to reflect how important each question is to them. This weight is formally represented as a mapping wt : V →Wt. Given a voter-candidate pair (vi, cj) and their respective answer and weight vectors vi = [q1(vi), ..., qNq (vi)]T , cj = [q1(cj), ..., qNq (cj)]T and wi = [w1(vi), ..., wNq (vi)]T , the VAA computes a similarity score s(vi, cj) between vi's and cj's opinions using a predefined weighted distance function d(vi,wi, cj), with d : RNq ×RNq ×RNq →R+. Lastly, for each voter vi, the VAA provides a ranking ri ∈ R(C) based on these similarity scores, with R(C) the set of total orders on C. See Table 3 in the Appendix for a summary of how the most popular VAAs align with this framework. As some of our analysis will concern parties and lists, we also account for the fact that candidates can belong to exactly one party p ∈ P and one list l ∈ L, with P and L being the set of all parties and lists, respectively. In Swiss National Council elections, lists are party- or coalition-specific slates of candidates from which voters choose or modify their preferred selections (see Appendix A.1 for more details). A canonical set of properties that any safe VAA must satisfy commonly includes [Garzia and Marschall, 2014]:
- (R) Reproducibility: The VAA produces reproducible recommendations, enabling users to verify the system's reliability.
- (I) Interpretability: The rationale behind the VAA's recommendations is easily understandable and intuitive to users, including those with less technical expertise.
- (T) Transparency: The VAA's matching algorithm and all factors influencing recommendations are open-source.
- (F) Fairness: The VAA is purely issue-based and does not consider any other characteristics of voters or candidates.
- (E) Explainability: Voters receive clear and intuitive explanations for candidate or list recommendations.
- (P) Privacy: The VAA ensures the privacy and anonymity of users' responses and preferences.
Although the importance of these properties is clear, they do not offer protection against malicious actors (i.e., adversaries) aiming to manipulate the recommendations to favor a particular candidate or party. From the above definitions, one can identify three potential types of such adversaries: (i) The candidates providing their answer vectors, (ii) the platform operator in charge of choosing d, {At}Nq t=1 , {Wt}Nq t=1 and all other aspects related to VAA's interface (such as question ordering, tie-breaking, etc.), and (iii) the question designers writing the questions Q. 3 In Section 4, we analyze the primary dangers associated with each type of adversary, grounding our analysis in the two datasets from Smartvote presented in Section 3. Then, in Section 6, we propose solutions to mitigate these risks.
3 For Smartvote, the non-profit association Politools is responsible for selecting the questions and operating the platform [Politools, 2024a].
3 Dataset
We empirically evaluate our claims using two comprehensive datasets collected by Smartvote [Politools, 2024a], which include questionnaire responses and metadata from both voters and candidates in the 2019 and 2023 Swiss National Council elections. In both elections, approximately 85% of electable candidates participated by completing the questionnaire, and around 20% of eligible Swiss voters used Smartvote for voting recommendations. These recent datasets provide a solid foundation for analyzing VAA robustness, capturing a significant portion of both voters and candidates. Smartvote contains Nq = 75 questions with At = {0, 25, 75, 100} for questions 1 ≤ t ≤ 60 (policy questions), At = {0, 17, 33, 50, 67, 83, 100} for 61 ≤ t ≤ 67 (value questions) and At = {0, 25, 50, 75, 100} for 68 ≤ t ≤ 75 (budget questions). For all questions, the allowable values for the weights are Wt = {0, 0.5, 1, 2}, with 1 being the default value for answered questions and 0 the value automatically assigned to any unanswered question. The distance metric used in Smartvote is the L2 distance
which is used to compute the normalized similarity scores
where 1Nq (respectively 0Nq ) denote the one-valued (respectively zero-valued) Nq dimensional vector. In addition to candidate rankings, Smartvote also provides a list ranking by averaging the similarity scores of all candidates on each list l ∈ L, i.e., s(vi, l) = 1 |l| ∑c∈l s(vi, c). For a more detailed description of the Swiss political system and Smartvote, we refer the reader to Appendix A. In Appendix B, we provide a comprehensive description of the preprocessing applied to the two datasets, as well as an exploratory data analysis. We conducted all analyses and experiments on both datasets, but present results from the more recent 2023 dataset, as the overall findings are consistent across both elections.
4 Vulnerabilities
While Smartvote satisfies in large part 4 all the safety properties listed in Section 2, its robustness to adversarial entities remains unclear. In this section, we analyze the key strategies that the different types of adversaries might use to increase the visibility of a particular candidate or party. Given a set of candidates C and a set of recommendations (i.e., rankings) RC = {ri ∈ R(C) | vi ∈ V }, we define the k-visibility of a candidate νk(c | C) as the frequency with which candidate c appears in the top k positions of the rankings RC. Additionally, we define the k-visibility of a party νk(p | P) as the fraction of the top k recommendations that are occupied by members of that party. Finally, we define the k-visibility of a list νk(l | L) as the frequency with which l appears in the top k positions of the list rankings RL = {ri ∈ R(L) | vi ∈ V }. Throughout this work, unless specified otherwise, we set k to the number of seats allocated to the candidate's state 5 in the National Council, for both candidate and party visibility. For lists, we use k = 1 by default, as voters can only vote for one list. These default values also correspond to the number of candidates and lists visually put forward by Smartvote. Due to their specificity, we discuss the list centralization (LC), the question ordering (QO), and the tie-breaking (TB) vulnerabilities in Appendix C.
4 The fairness and reproducibility properties of Smartvote are not fully met, as they break ties using last names and allowed some candidates to overwrite their initial answers on a few questions.
4.1 Candidates and Parties
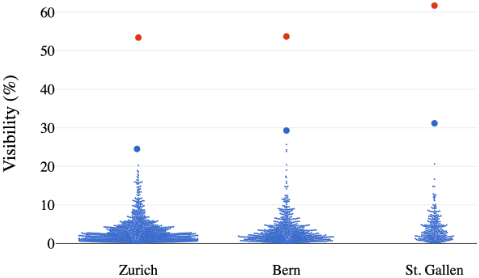
Answer Optimization (AO) We start by investigating the potential for a single candidate to manipulate their answers to increase their popularity. The computation of the provably optimal candidate is of combinatorial complexity and thus infeasible, as pointed out by Etter et al. [2014]. However, we can find an approximate solution through randomized optimization. For each state, we craft an artificial candidate c∗ using simulated annealing [Kirkpatrick et al., 1983] and optimizing νk(c∗ | C ∪ {c∗ }). In almost all states, the crafted candidate appears in more than 50% of top k recommendations, significantly outperforming the previously crafted candidate by Etter et al. [2014], as well as any actual candidate. 6 Figure 1 shows that the crafted candidates in the states of Zurich, Bern, and St. Gallen easily surpass their competition in terms of visibility. Table 7 in Appendix C contains the popularity of our best crafted candidate for each state, as well as a comparison with other optimization strategies. Specifically, it demonstrates that the visibility of candidates crafted using only 1% of the voters' data is nearly as high as those optimized with the full dataset, achieving 51.70%, 50.66%, and 52.55% in Zurich, Bern, and St. Gallen, respectively. The analysis of the crafted candidate's profile reveals that almost no questions are answered on the answer spectrum's extremities (e.g., only 2 out of 75 answers for the crafted candidate in Zurich). This points to a systematic bias toward candidates with moderate positions. We investigate this lead next.
5 Usually referred to as a canton in Switzerland
6 Note that Etter et al. [2014] set k = 50 in the popularity metric, while for us k ∈ {1, · · · , 36}. Our result is thus strictly stronger.
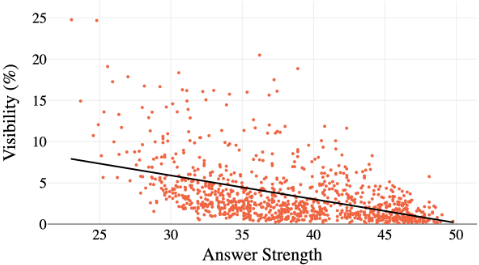
Answer Calibration (AC) In Smartvote, candidates are provided with four or more response options. They can deliberately choose to respond "strongly" by selecting answers at the poles (0 or 100) or "moderately" by choosing options closer to the middle of the answer spectrum (25 or 75). 7 We define the strength σ of an answer cj by its deviation from the neutral position in absolute value, i.e.,
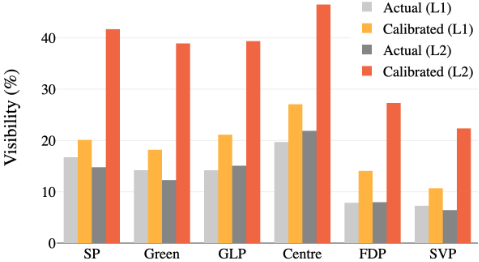
In Figure 2, we find that in Smartvote, candidates with moderate answers (i.e., lower answer strength) are recommended significantly more often. This concerning trend suggests that candidates can artificially boost their visibility by providing moderate answers to all questions. This strategy is particularly problematic because it can be executed with minimal deviation from the true candidate's position, making it difficult to detect. Figure 3 reveals that with the current distance metric used in Smartvote (dL2), some parties can increase their visibility fourfold by unilaterally adopting this strategy.
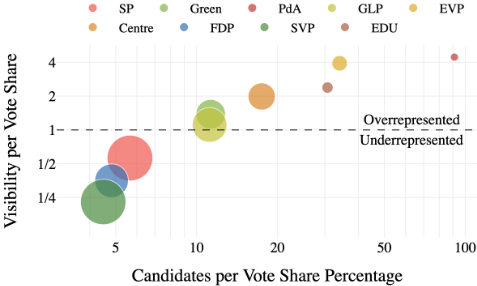
Diversification (DIV) Figure 4 shows that parties with more candidates relative to their vote share tend to receive disproportionately more recommendations on Smartvote. This significant correlation suggests that having more candidates can skew recommendations, thereby providing an artificial advantage in voter outreach and potentially electoral success.
4.2 PlatformDesigners
Matching Method (MM) Louwerse and Rosema [2014] show how sensitive recommendations are to changes in the matching method. We extend these findings by quantitatively evaluating the bias and accuracy of each distance function in Table 2. Additionally, in Table 8 of the Appendix, we show that some methods can disproportionately favor candidates at either end of the political spectrum.
7 Answering moderately can be used to indicate a nuanced position, openness to compromise, or ambivalence. As such, the added expressivity is regarded to be beneficial [Batterton and Hale, 2017].
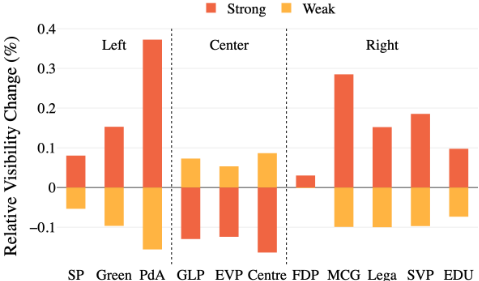
Weight Selection (WS) In Smartvote, voters have the option to decrease or increase the weight of each question qt, but without knowing the actual numerical weights Wt = {0, 12 , 1, 2} corresponding to these actions. 8 Figure 5 displays the relative change of the main parties' visibility (among voters that have weighted at least one question) if these values are changed.
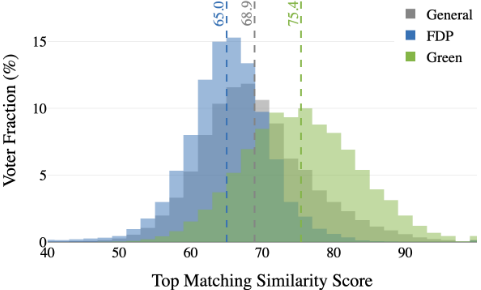
Similarity Score (SS) Apart from determining the ranking ri, the similarity scores s(vi, cj ) can also be displayed to provide voters with a sense of their relative proximity to different candidates. The exact calculation of such a score is mostly arbitrary. In Smartvote, the Euclidean distance between the voter and candidate is scaled by the maximum possible distance between two answers, as specified in Eq. (2). Figure 6 shows that the similarity scores of the best-matching candidate vary by party and are generally quite low, which is in large part a consequence of the curse of dimensionality [Thirey and Hickman, 2015]. This disparity could ultimately influence voters from different parties in different ways.
4.3 Question Designers
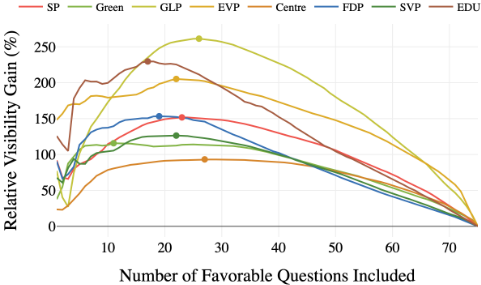
Question Favoritism (QF) Certain questions can significantly benefit specific parties by aligning closely with their popular stances. Figure 7 shows the relative change in party visibility based on the size of alternative questionnaires. These questionnaires consist of a subset of questions from the original set, selected to benefit the respective parties the most during the elections in the state of St. Gallen. With this knowledge, an adversarial question designer could favor questions that benefit their preferred party.
8 These values are available on the About page on Smartvote, but they are not displayed directly alongside the questions.
Question Correlation (QC) If a question is advantageous for a particular party, introducing additional questions with answers highly correlated to this question (among voters and candidates) implicitly increases its weight. For instance, asking the negation of a question effectively doubles the original question's weight. Although this strategy is inherently associated with question favoritism, it has the potential to magnify its impact.
5 Measuring Robustness
From Table 1, we note that three high-risk vulnerabilities, namely AC, AO, and MM, are highly dependent on the matching method. To assess the impact of matching methods on robustness, we compare the five most commonly used distance functions and two novel proposals using various key robustness metrics. A formal definition of these distance functions is provided in Appendix D.3.
Party Bias (BIA). We assess the deviations in party visibility for each matching method relative to the median visibility observed across all other evaluated methods (see Appendix D.1 for a detailed discussion). Here we consider the mean absolute deviation (BIA1) and max deviation (BIA2) over the eight largest parties.
Calibration Potential (CP). For each matching method, we repeat the analysis of Figure 3 and measure the average relative visibility gain or loss that results from a party employing the moderate answering strategy (CP-M) or the strong answering strategy (CP-S) weighted by the adjusted voter shares of the parties in the 2023 election (see Table 4 in Appendix A for the exact values).
Answer Strength Correlation (ASC). This metric addresses the answer calibration manipulation strategy. It is defined as the Pearson correlation between the answer strength (defined in Eq. 3) and the expectation-normalized visibility of candidates. The expectation-normalized visibility adjusts for the varying number of candidates in each state by multiplying the visibility by the ratio of the number of candidates to the number of available seats in the state, ensuring comparability across different states. To minimize the effectiveness of any answer calibration strategy regarding the answer strength, this metric should ideally be close to zero, indicating no systematic bias toward candidates with moderate or strong answers.
Figure 5: Relative visibility change of all parties if the available question weights are set to Wt = {0, 1 10 , 1, 10} (strong) or Wt = {0, 9 10 , 1, 10 9 } (weak). The visibility of each party is computed using only the voters that have weighted at least one question. Parties are listed according to their parliamentary seating arrangement, with traditional larger coalitions (left, center, right) shown at the top. As observed, the actual numerical value of the weights can significantly favor certain coalitions, with center parties benefiting from weak weights and left- and right-wing parties from strong weights.
Gini Coefficient (GIN). This metric measures the Gini coefficient of the expectation-normalized visibilities over all candidates, indicating how evenly distributed the recommendations are among them. A Gini coefficient of 0 represents a perfectly even distribution, and a coefficient of 1 indicates a completely uneven distribution. While there is no ideal Gini coefficient for a distance method, and actual election votes are typically less evenly distributed than Smartvote recommendations (see Figure 20 in the Appendix), the Gini coefficient offers insight into the differences in recommendation diversity between matching methods.
Party Match Accuracy (ACC1). This metric measures the proportion of voters whose top list recommendation matches their preferred party. As manual accuracy checks are impractical, comparing the voter's stated preferred party with the party recommended by the algorithm is common for assessing the accuracy of VAAs [Garzia and Marschall, 2014]. For Smartvote, which does not directly recommend parties, we use the party from the best-matching list as a proxy. While this metric is appealing for its simplicity, it assumes that voters know the party that best represents them, which may not always be true.
Normalized Party Rank (ACC2). This metric provides deeper insight into the rankings of lists associated with voters' preferred parties. It measures the average normalized rank of the top list for the preferred party, with normalization adjusting for the number of lists per state. A normalized rank of 0 means the list is recommended first, while a value of 1 means it is recommended last.
Strong Disagreement Accuracy (ACC3). This metric measures the disagreements between voters and their recommended candidates. However, it specifically focuses on questions that voters weighted more strongly, indicating their greater importance. This metric should ideally be low, as voters likely expect their recommended candidates to align with them on these high-priority questions.
6 FutureWork onMitigation Approaches
Below, we present a series of possible mitigation strategies, specifying the vulnerabilities they aim to address. We also provide mitigations for TB, QO and LC in Appendix E. We emphasize that these strategies have not been extensively tested and may introduce unintended harms. We introduce them here as a foundation for future work, aiming to facilitate systematic research in this direction. Mitigation strategies currently under Politools review are marked with search.
search L1 or Angular instead of L2 (AC, AO, MM). While each distance metric has its trade-offs, we find in Table 2 that L1 and Angular consistently offer better robustness than L2 without sacrificing accuracy. Specifically, L1 outperforms L2 in ACC1 and ACC2, while Angular excels in ACC3 with only minor reductions in ACC1 and ACC2. Therefore, we argue that any of these two methods is a viable robust substitution for L2. Alternatively, the Hybrid method appears to offer strong robustness properties with only a slight decrease in accuracy across all three metrics.
Lower Expressivity (AC, AO). Reducing the number of allowable answers can reduce the impact of many vulnerabilities by limiting opportunities for fine-grained manipulation. Since expressivity is important for voters, it could be reduced specifically for candidates. For example, candidates could be restricted to answering "Yes" or "No" for each question, while voters still have "Rather yes" and "Rather no" as options. This would effectively mitigate the answer calibration strategy, which, based on our subjective assessment in Table 1, poses the greatest risk.
Figure 7: Relative visibility gain for each party using a set of greedily selected optimal questions to generate voting advice in the state of St. Gallen. Each line represents a political party and shows its increase in visibility as more and more favorable questions are included, compared to the baseline scenario with the full questionnaire. Circles indicate each party's maximum attainable visibility (e.g., when only choosing the best-aligned 12 questions, the Green party can increase its visibility by 120%).
search Deal-breaker Filtering (WS). As demonstrated by the vulnerability to weight selection, voters could easily misunderstand the effect of weighting questions. To address this issue, we propose to allow only the weights to Wt = {0, 1, ∞} for each question qt. Assigning a weight ∞ to a question effectively treats it as a deal-breaker [Isotalo, 2021], directly excluding all candidates who answered differently from the voter on that question. To avoid leaving voters without candidates due to excessive filtering, the matching algorithm could consider the number of disagreements on deal-breakers as the primary factor in determining the similarity scores. Alternatively, one could also allow voters to exclude all candidates not aligned with their chosen side of the answer spectrum relative to the neutral response.
search Selective Answering (QF, QC). Voters should be informed that answering more questions does not necessarily lead to a more accurate recommendation and may even distort the results. The user interface could instead promote a more selective approach to question selection by each voter.
Distance to Party Mean (AC, AO). Voters often lack tools to assess a candidate's honesty and determine if they answered truthfully or exploited VAA vulnerabilities to boost their visibility. One solution is to display the distance between each candidate's answers and their party's mean answers. A large distance might prompt voters to scrutinize the candidate's responses more closely. However, this metric would only be a proxy for honesty, as some candidates may naturally deviate from their party's position [Schwarz et al., 2010].
| Distance Function (See App. D.3) | BIA1 |arrow-down| | BIA2 |arrow-down| | CP-M arrow-down | CP-S arrow-down | ASC |arrow-down| | GIN | ACC1 arrow-up | ACC2 arrow-down | ACC3 arrow-down | Used By |
|---|---|---|---|---|---|---|---|---|---|---|
| L2 | 23.0% | +40.7% (EVP) | +207% | -71% | -0.470 | 0.475 | 41.0% | 0.103 | 7.8% | Smartvote |
| L1 | 14.3% | +24.4% (Centre) | +46% | -50% | -0.280 | 0.373 | 41.8% | 0.101 | 11.0% | Wahl-O-Mat |
| Angular | 4.1% | -12.2% (GLP) | -27% | -13% | 0.190 | 0.349 | 40.2% | 0.109 | 7.0% | - |
| Agreement Count | 3.6% | +7.8% (SVP) | -36% | -4% | 0.256 | 0.317 | 35.7% | 0.111 | 15.0% | Stemwijzer |
| Mahalanobis | 29.2% | -47.2% (EDU) | +305% | -69% | 0.044 | 0.523 | 29.0% | 0.142 | 21.6% | - |
| L1 Bonus | 15.5% | -27.1% (GLP) | -81% | +27% | 0.583 | 0.387 | 37.9% | 0.109 | 11.3% | Smartvote (old) |
| Hybrid | 5.3% | -15.7% (GLP) | -55% | -12% | 0.292 | 0.349 | 40.2% | 0.106 | 10.1% | EUVox |
Limiting the Number of Candidates (DIV). To prevent parties from disproportionately boosting their visibility by increasing candidate numbers, we propose limiting the number of candidates from the same party that can be recommended to any voter. This limit could be based on the similarity score between the voter's position and each party's average position. For instance, if two parties have the same similarity score with a given voter but one has more candidates, the top k recommendations should be evenly distributed between the parties, minimizing the risk of biased recommendations arising from the diversification strategy.
Fair Answer Normalization (SS). To avoid presenting varying similarity scores to voters from different parties (as shown in Figure 6), we propose normalizing similarity scores relative to the top candidate for each voter (who would always be considered a 100% match). While this would change the score's meaning and might reduce its overall usefulness, it would also eliminate bias.
7 RelatedWork
VAAs emerged around 30 years ago and have quickly gained popularity since then. Garzia and Marschall [2012] provide a comprehensive overview of existing VAAs, summarized in Table 3 in the Appendix. The voter data collected by VAAs are a treasure trove, for political, social, and computer scientists alike. Etter et al. [2014] for example, extract valuable data on the Swiss political landscape. An extended related work discussion on the influence of VAAs on democratic institutions and their development is detailed in Appendix F.
VAAs under Scrutiny. Walgrave et al. [2009] show that the question selection has a substantial impact on the voting advice. Louwerse and Rosema [2014] highlight the significant impact matching methods (mainly L1 and L2) have on recommendations, using StemWijzer as an example. We corroborate this finding but crucially demonstrate that these matching methods behave differently in the presence of an adversary. Van der Linden and Dufresne [2017] critically analyze current methods to visualize aggregate results, and propose a technique based on learned dimensions to correct shortcomings. Finally, Isotalo [2021] identifies several issues with Finnish VAAs, including lack of transparency, user interactivity, and problems in statement structure. Our work supports the effectiveness of their suggested filtering method.
Adversarial Robustness of Recommender Systems. Other applications have recognized the importance of adversarial robustness [Hurley, 2011; Tang et al., 2019] and the challenges of questionnaire design [Pasek and Krosnick, 2010]. Ovaisi et al. [2022] provide a toolkit to compare the robustness of learning-based recommender systems. Given the much stricter requirements of recommender systems for democracy (see Section 2), while our introduced metrics apply to all methods, we restrict our evaluation to non-learningbased methods for now.
8 Outlook
This study highlights critical vulnerabilities in voting advice applications (VAAs), providing empirical evidence that malicious actors could pose a risk to democratic processes. Crucially, many vulnerabilities also uncover the existence of strong biases in VAAs, even in the absence of adversarial entities. We are convinced that VAAs are a highly desirable addition to the political landscape and believe that our proposed comparative metrics and mitigations can help guide future VAA development toward more robust designs. As VAAs continue to evolve in the era of AI, future work should also aspire to extend our results to other types of political recommender systems that fall outside our formalism.
Ethical Statement
The dataset has been collected and anonymized by Politools in accordance with the new Swiss Federal Act on Data Protection (nFADP), the Telecommunications Act (TCA), and other applicable data protection regulations [Politools, 2024b]. Further, we strictly follow the platform's terms of use for data. As such, we do not publish results that may be attributed to specific individuals. In accordance with the terms of use for research, the dataset is kept private, and we adhere to established best practices for dealing with sensitive data. While the dataset cannot be made accessible directly, it might be made available to researchers by Politools upon request [Politools, 2024a]. Given access to the data, all numerical results and figures can be easily reproduced using the code in the supplementary material. In the absence of established Ethics guidelines, we follow Menlo's report on Computer Science research principles [Kenneally and Dittrich, 2012]. Publicly disclosing all found vulnerabilities presents a risk, as various actors might benefit from exploiting them. We mitigate these risks by publishing our results after Switzerland's national election, leaving enough time to implement potential mitigation for the 2027 elections. To the best of our knowledge, no countries with popular VAAs that could be affected by our research will hold national elections in the months following the publication of this work. Thus, we believe that this is the right time to shed light on these vulnerabilities. Overall, we believe that despite some inherent risks, this work will have a clear net positive social impact by providing tools to enhance the robustness of VAAs, and consequently, democracies.
Acknowledgments
We thank Michael Erne and Daniel Schwarz from Politools for the uncomplicated and fruitful collaboration, as well as their helpful feedback. Our gratitude extends to Roger Germann, Douglas Orsini-Rosenberg, Leon Plath, and Gina Stoffel, whose Bachelor and Master thesis contributed to our understanding of VAAs and the success of this project. Finally, we thank Judith Beesterm¨oller and Robin Fritsch for their valuable input and guidance.
@inproceedings{ijcai2025p1063,
  title     = {Recommender Systems for Democracy: Toward Adversarial Robustness in Voting Advice Applications},
  author    = {Berdoz, Frédéric and Brunner, Dustin and Vonlanthen, Yann and Wattenhofer, Roger},
  booktitle = {Proceedings of the Thirty-Fourth International Joint Conference on
               Artificial Intelligence, {IJCAI-25}},
  publisher = {International Joint Conferences on Artificial Intelligence Organization},
  editor    = {James Kwok},
  pages     = {9564--9572},
  year      = {2025},
  month     = {8},
  note      = {AI and Social Good},
  doi       = {10.24963/ijcai.2025/1063},
  url       = {https://doi.org/10.24963/ijcai.2025/1063},
}
TY - CPAPER TI - Recommender Systems for Democracy: Toward Adversarial Robustness in Voting Advice Applications AU - Berdoz, Frédéric AU - Brunner, Dustin AU - Vonlanthen, Yann AU - Wattenhofer, Roger T2 - Proceedings of the Thirty-Fourth International Joint Conference on Artificial Intelligence, IJCAI-25 PB - International Joint Conferences on Artificial Intelligence Organization PY - 2025 SP - 9564 EP - 9572 DO - 10.24963/ijcai.2025/1063 UR - https://doi.org/10.24963/ijcai.2025/1063 ER -Copied
Machine-readable versions of this paper, for tools and AI agents:





